| Param | Original file | Final file |
|---|---|---|
| Filename | modeM0/AS1T05_044T01_9000005270_37043cztM0_level2.evt | modeM0/AS1T05_044T01_9000005270_37043cztM0_level2_quad_clean.evt |
| Size (bytes) | 159,678,720 | 29,505,600 |
| Size | 152.3 MB | 28.1 MB |
| Events in quadrant A | 943,910 | 213,202 |
| Events in quadrant B | 1,118,304 | 212,605 |
| Events in quadrant C | 1,125,535 | 201,317 |
| Events in quadrant D | 1,551,357 | 162,040 |
| Mode M0 | |||
|---|---|---|---|
| Quadrant | BADHDUFLAG | Total packets | Discarded packets |
| A | 0 | 3800 | 1 |
| B | 0 | 4261 | 1 |
| C | 0 | 4299 | 1 |
| D | 0 | 5519 | 1 |
| Mode SS | |||
|---|---|---|---|
| Quadrant | BADHDUFLAG | Total packets | Discarded packets |
| A | 0 | 28 | 0 |
| B | 0 | 28 | 0 |
| C | 0 | 28 | 0 |
| D | 0 | 28 | 0 |
| Quadrant | Total seconds | Saturated seconds | Saturation percentage |
|---|---|---|---|
| A | 1392 | 13 | 0.933908% |
| B | 1392 | 52 | 3.735632% |
| C | 1392 | 76 | 5.459770% |
| D | 1393 | 366 | 26.274228% |
Noise dominated data is calculated using 1-second bins in cleaned event files. If a bin has >2000 counts, and if more than 50% of those come from <1% of pixels, then it is considered to be noise-dominated and hence unusable.
| Quadrant | # 1 sec bins | Bins with >0 counts | Bins with >2000 counts | High rate bins dominated by noise | Noise dominated (total time) | Noise dominated (detector-on time) | Marked lightcurve |
|---|---|---|---|---|---|---|---|
| A | 1392 | 1392 | 10 | 10 | 0.72% | 0.72% | 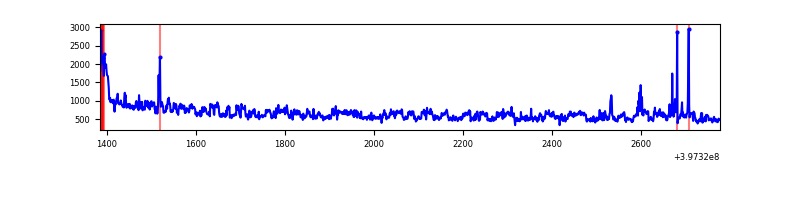 |
| B | 1392 | 1392 | 36 | 36 | 2.59% | 2.59% | 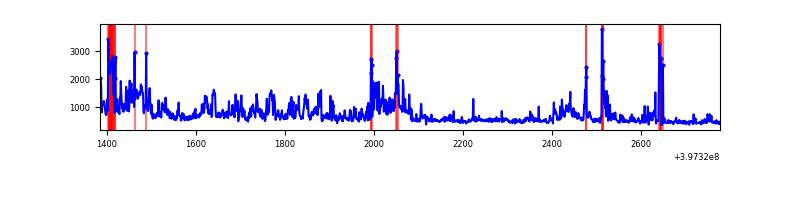 |
| C | 1392 | 1392 | 66 | 66 | 4.74% | 4.74% | 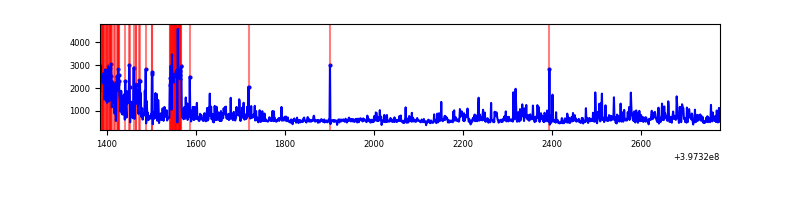 |
| D | 1393 | 1393 | 350 | 350 | 25.13% | 25.13% | 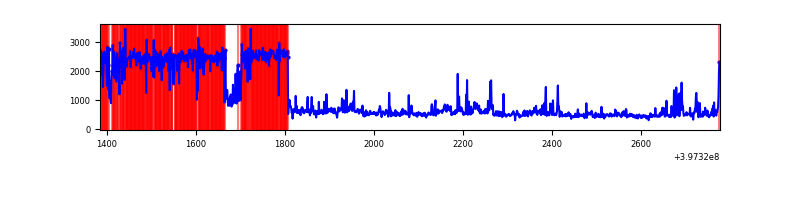 |
Top three noisy pixels from each quadrant. If the there are fewer than three noisy pixels in the level2.evt file, extra rows are filled as -1
| Pixel properties | Quadrant properties | ||||||
|---|---|---|---|---|---|---|---|
| Quadrant | DetID | PixID | Counts | Sigma | Mean | Median | Sigma |
| A | 11 | 254 | 110361 | 2924.08 | 178 | 175 | 37.7 |
| A | 10 | 83 | 108638 | 2878.36 | 178 | 175 | 37.7 |
| A | 13 | 248 | 26769 | 705.74 | 178 | 175 | 37.7 |
| B | 0 | 182 | 97639 | 2817.83 | 175 | 172 | 34.6 |
| B | 5 | 172 | 96910 | 2796.76 | 175 | 172 | 34.6 |
| B | 5 | 32 | 51372 | 1480.22 | 175 | 172 | 34.6 |
| C | 0 | 10 | 265106 | 6677.71 | 168 | 169 | 39.7 |
| C | 1 | 23 | 89991 | 2263.96 | 168 | 169 | 39.7 |
| C | 15 | 214 | 61222 | 1538.84 | 168 | 169 | 39.7 |
| D | 2 | 250 | 521666 | 14063.43 | 144 | 139 | 37.1 |
| D | 12 | 233 | 323173 | 8710.89 | 144 | 139 | 37.1 |
| D | 12 | 235 | 62418 | 1679.41 | 144 | 139 | 37.1 |
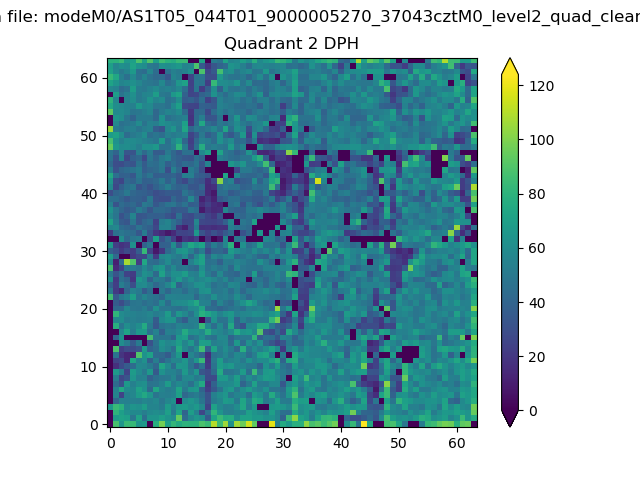
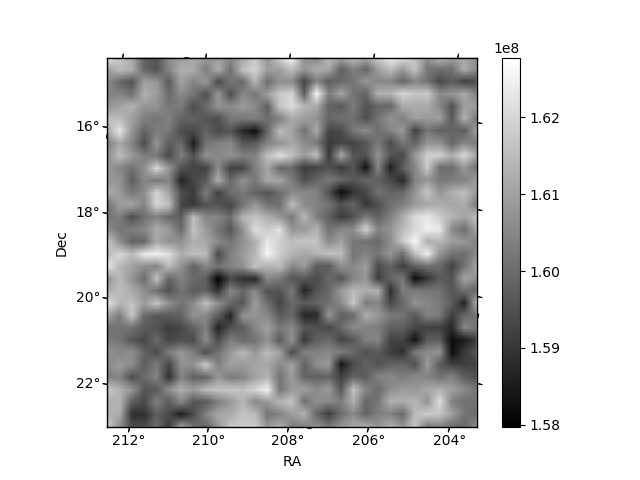
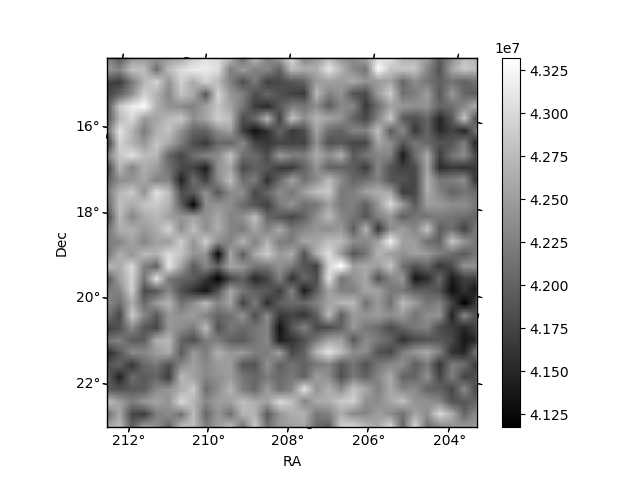
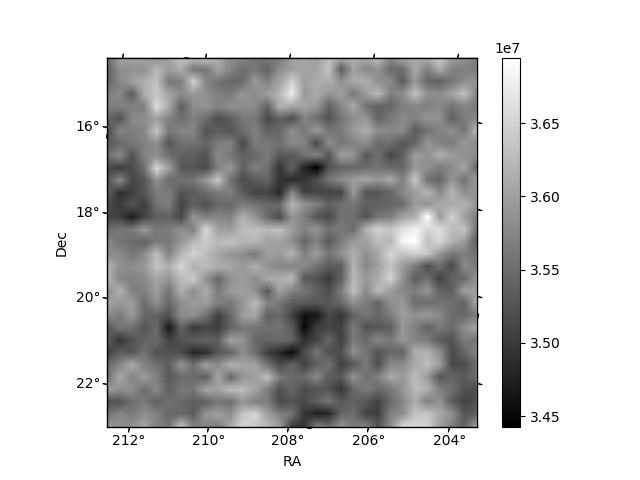
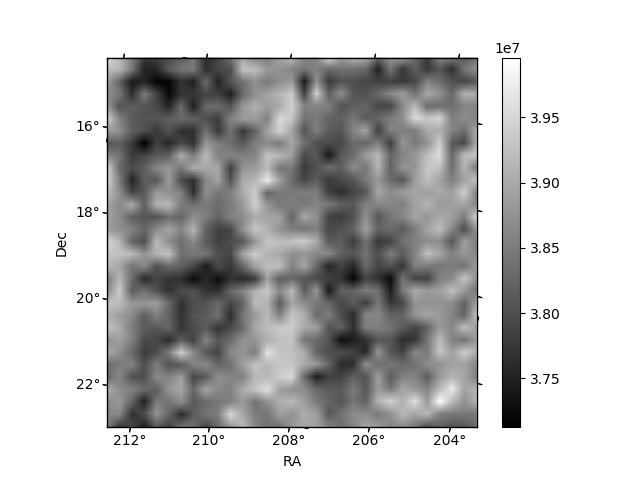
Histogram calculated using DETX and DETY for each event in the final _common_clean file
| Quadrant A | 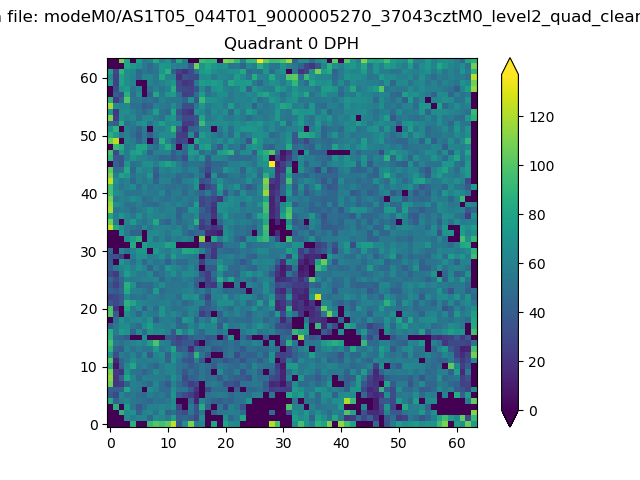 |
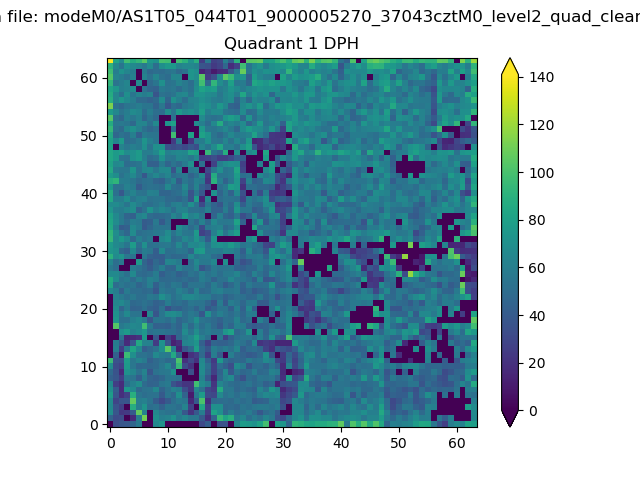 |
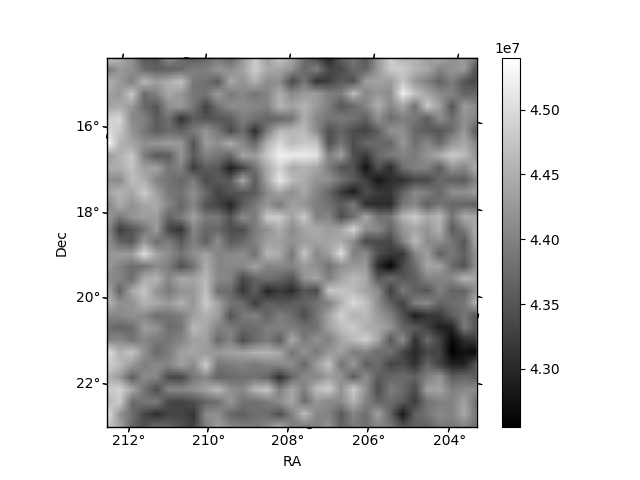
Quadrant B |
|---|---|---|---|
| Quadrant D | 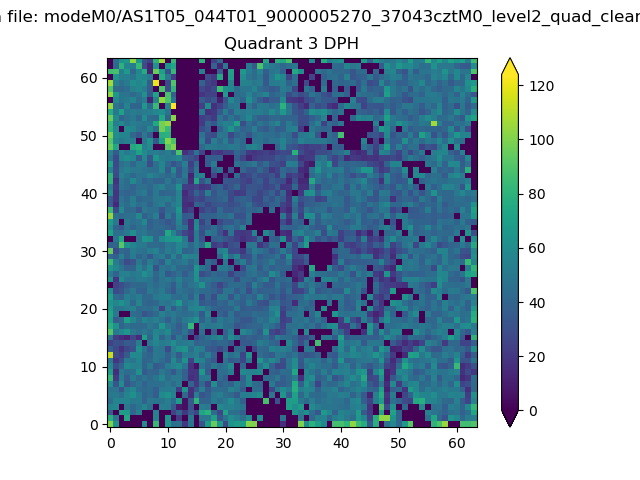 |
 |
Quadrant C |
| Plot type | Count rate plots | Images |
|---|---|---|
| Comparison with Poisson distribution Blue bars denote a histogram of data divided into 1 sec bins. Red curve is a Poisson curve with rate = median count rate of data. |
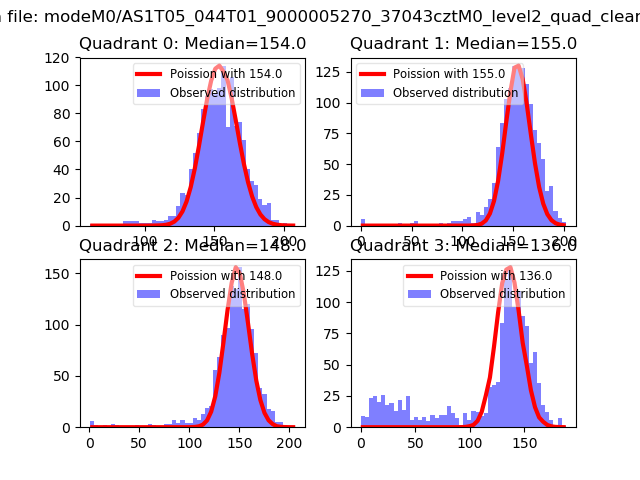 |
 |
| Quadrant-wise count rates Data is divided into 100 sec bins |
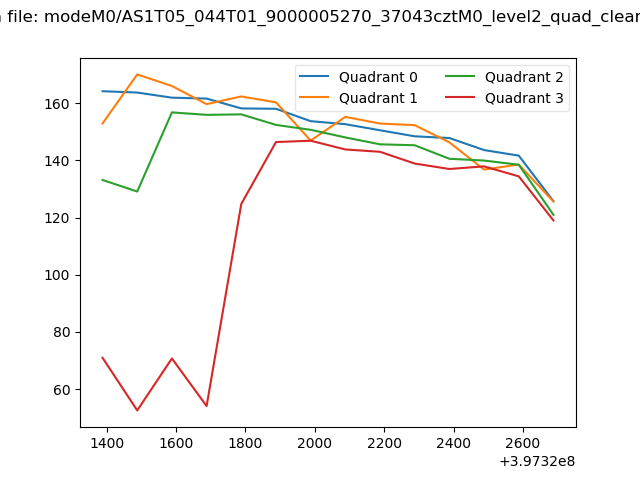 |
|
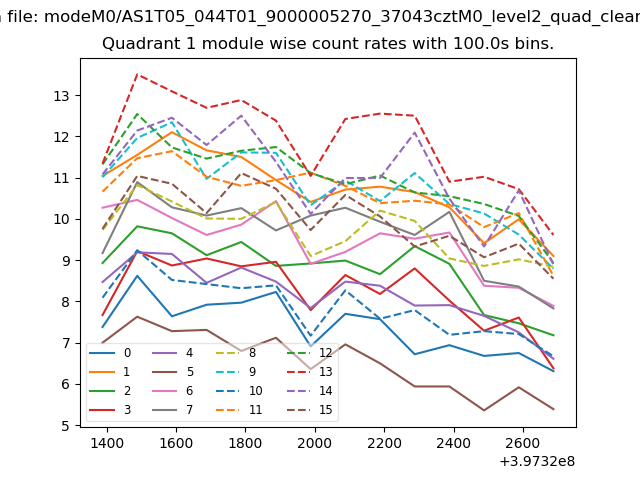
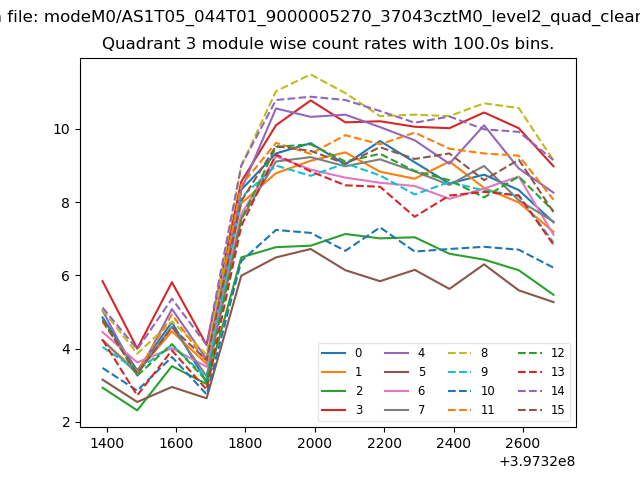
| Module-wise count rates for Quadrant A Data is divided into 100 sec bins |
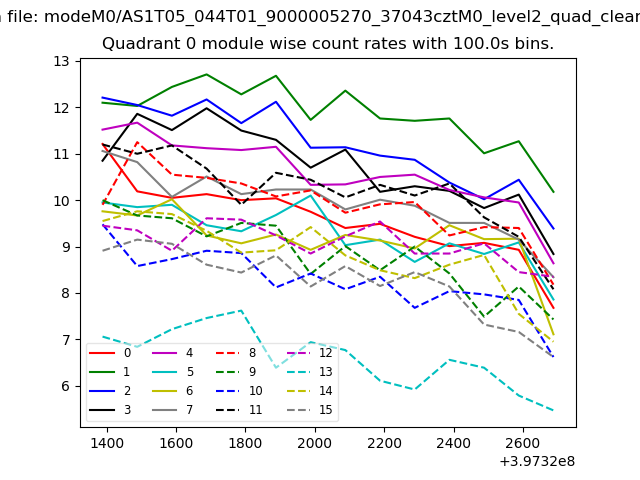 |
 |
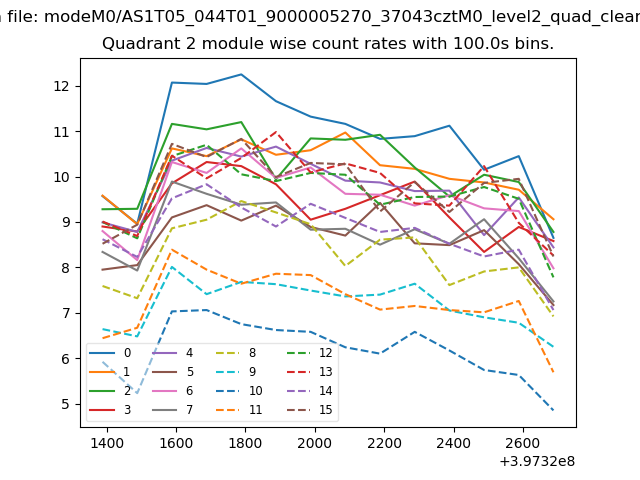
| Module-wise count rates for Quadrant B Data is divided into 100 sec bins |
 |
 |
| Module-wise count rates for Quadrant C Data is divided into 100 sec bins |
 |
 |
| Module-wise count rates for Quadrant D Data is divided into 100 sec bins |
 |
 |
| Parameter | Plot |
|---|---|
| CZT HV Monitor | 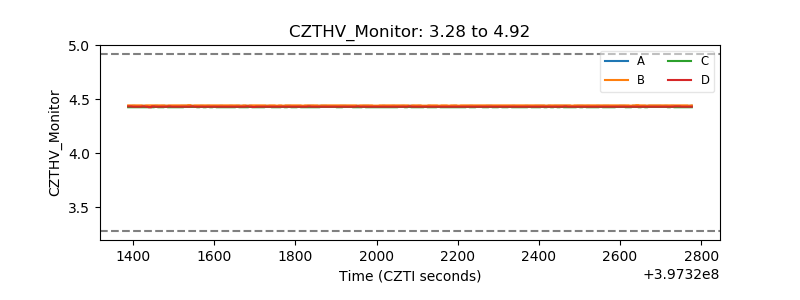 |
| D_VDD | 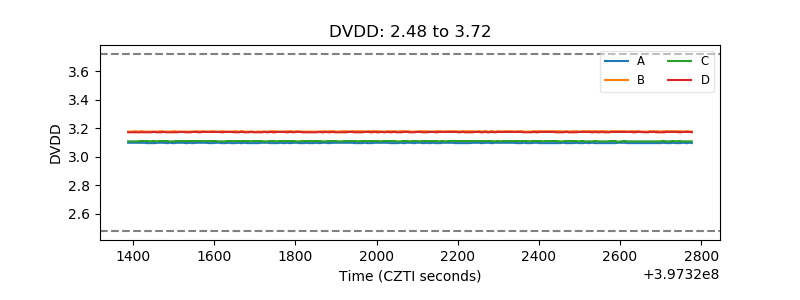 |
| Temperature 1 | 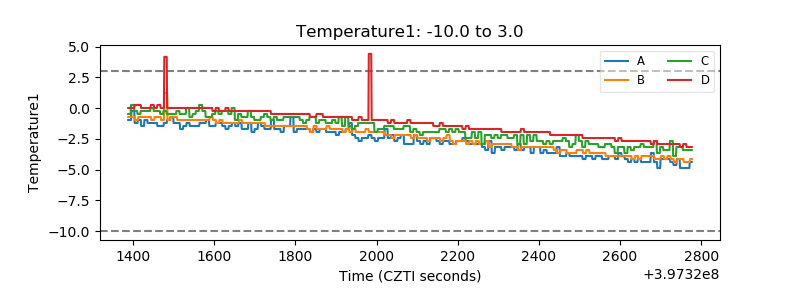 |
| Veto HV Monitor | 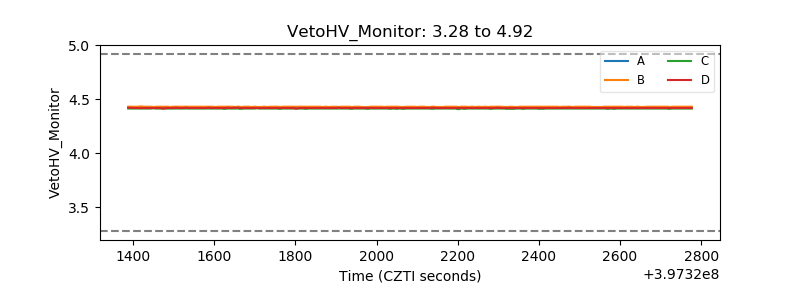 |
| Veto LLD | 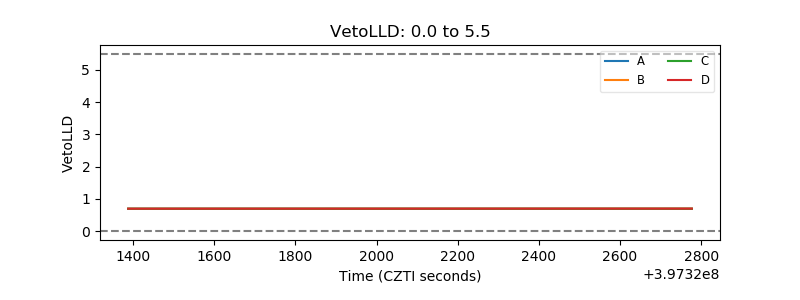 |
| Alpha Counter | 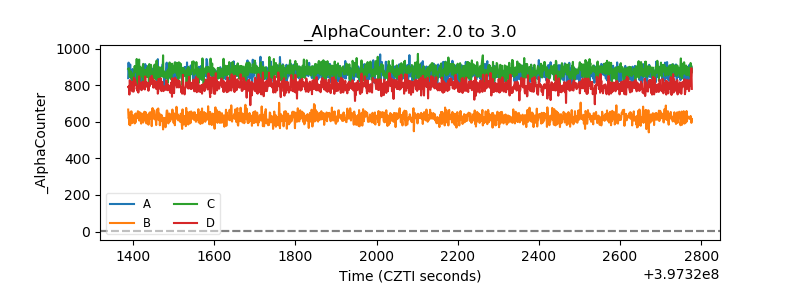 |
| _CPM_Rate | 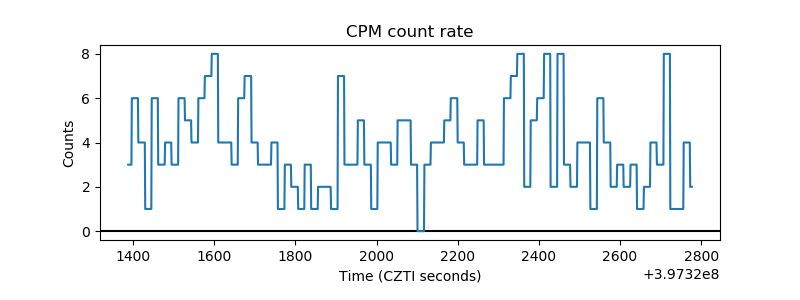 |
| CZT Counter | 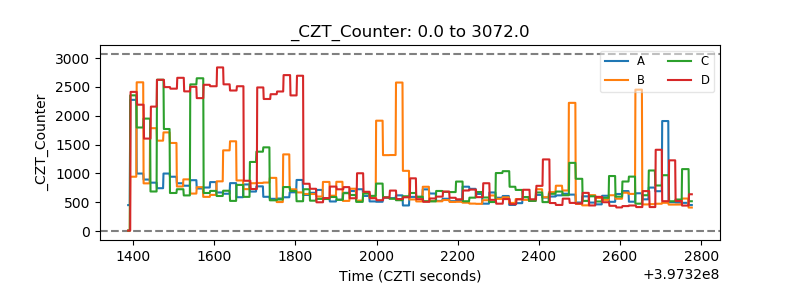 |
| +2.5 Volts monitor | 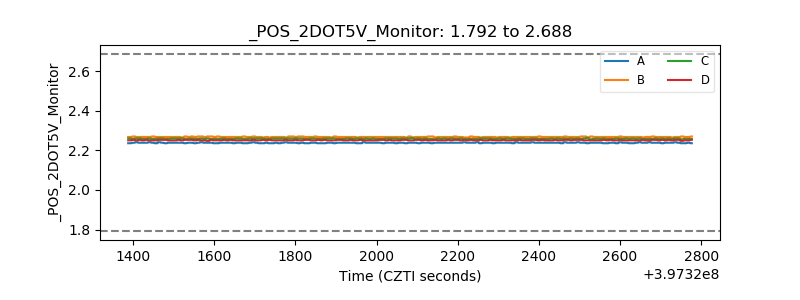 |
| +5 Volts monitor | 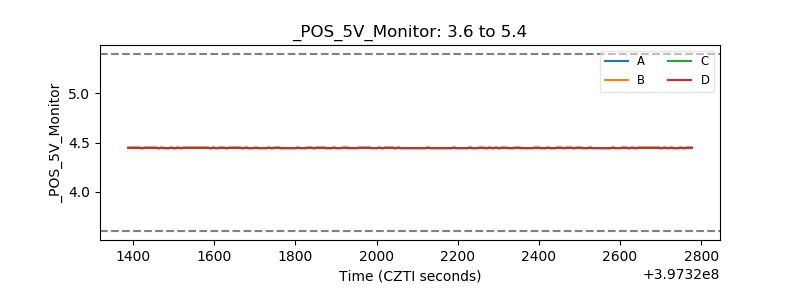 |
| _ROLL_ROT | 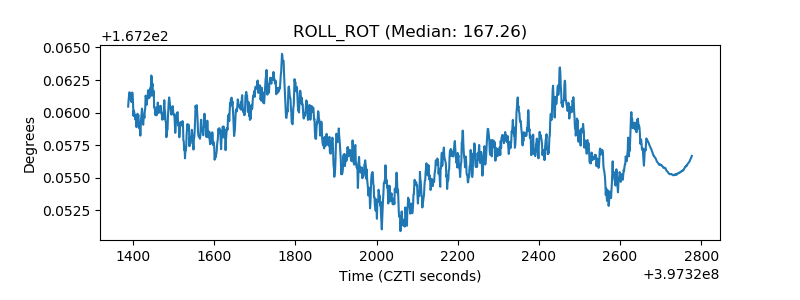 |
| _Roll_DEC | 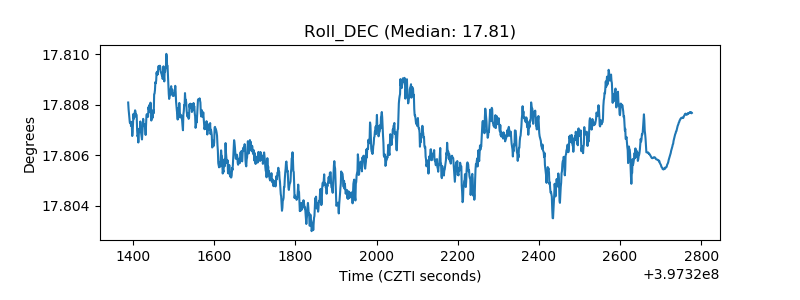 |
| _Roll_RA | 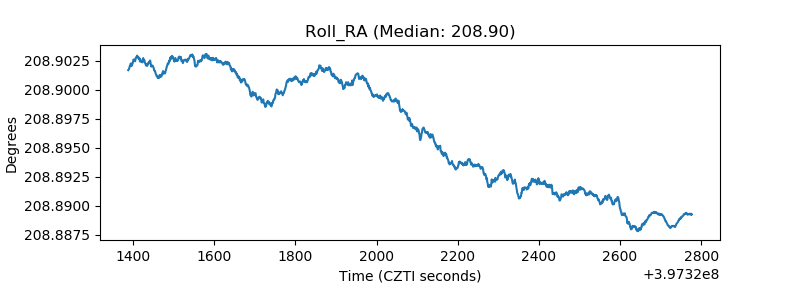 |
| Veto Counter |  |