| Param | Original file | Final file |
|---|---|---|
| Filename | modeM0/AS1A09_026T06_9000005278cztM0_level2.fits | modeM0/AS1A09_026T06_9000005278cztM0_level2_quad_clean.evt |
| Size (bytes) | 176,857,920 | 164,220,480 |
| Size | 168.7 MB | 156.6 MB |
| Events in quadrant A | 1,079,126 | 995,536 |
| Events in quadrant B | 999,942 | 936,607 |
| Events in quadrant C | 1,052,700 | 923,044 |
| Events in quadrant D | 884,074 | 777,765 |
| Mode M9 | |||
|---|---|---|---|
| Quadrant | BADHDUFLAG | Total packets | Discarded packets |
| A | 0 | 43 | 0 |
| B | 0 | 43 | 0 |
| C | 0 | 43 | 0 |
| D | 0 | 43 | 0 |
| Mode SS | |||
|---|---|---|---|
| Quadrant | BADHDUFLAG | Total packets | Discarded packets |
| A | 0 | 396 | 0 |
| B | 0 | 396 | 0 |
| C | 0 | 396 | 0 |
| D | 0 | 396 | 0 |
| Mode M0 | |||
|---|---|---|---|
| Quadrant | BADHDUFLAG | Total packets | Discarded packets |
| A | 0 | 41084 | 0 |
| B | 0 | 51514 | 0 |
| C | 0 | 43832 | 0 |
| D | 0 | 62556 | 0 |
| Quadrant | Total seconds | Saturated seconds | Saturation percentage |
|---|---|---|---|
| A | 19442 | 41 | 0.210884% |
| B | 19442 | 879 | 4.521140% |
| C | 19442 | 297 | 1.527621% |
| D | 19442 | 1518 | 7.807839% |
Noise dominated data is calculated using 1-second bins in cleaned event files. If a bin has >2000 counts, and if more than 50% of those come from <1% of pixels, then it is considered to be noise-dominated and hence unusable.
| Quadrant | # 1 sec bins | Bins with >0 counts | Bins with >2000 counts | High rate bins dominated by noise | Noise dominated (total time) | Noise dominated (detector-on time) | Marked lightcurve |
|---|---|---|---|---|---|---|---|
| A | 23620 | 19441 | 0 | 0 | 0.00% | 0.00% |  |
| B | 23620 | 19428 | 0 | 0 | 0.00% | 0.00% |  |
| C | 23620 | 19436 | 0 | 0 | 0.00% | 0.00% |  |
| D | 23619 | 19423 | 0 | 0 | 0.00% | 0.00% |  |
Top three noisy pixels from each quadrant. If the there are fewer than three noisy pixels in the level2.evt file, extra rows are filled as -1
| Pixel properties | Quadrant properties | ||||||
|---|---|---|---|---|---|---|---|
| Quadrant | DetID | PixID | Counts | Sigma | Mean | Median | Sigma |
| A | 7 | 110 | 899 | 8.8 | 281 | 265 | 72.1 |
| A | 9 | 19 | 851 | 8.13 | 281 | 265 | 72.1 |
| A | 0 | 29 | 837 | 7.94 | 281 | 265 | 72.1 |
| B | 2 | 9 | 911 | 12.07 | 265 | 253 | 54.5 |
| B | 3 | 80 | 819 | 10.38 | 265 | 253 | 54.5 |
| B | 2 | 8 | 758 | 9.26 | 265 | 253 | 54.5 |
| C | 3 | 234 | 740 | 6.51 | 278 | 261 | 73.6 |
| C | 7 | 221 | 713 | 6.14 | 278 | 261 | 73.6 |
| C | 3 | 158 | 711 | 6.11 | 278 | 261 | 73.6 |
| D | 10 | 189 | 678 | 6.42 | 253 | 230 | 69.8 |
| D | 10 | 113 | 672 | 6.34 | 253 | 230 | 69.8 |
| D | 6 | 62 | 668 | 6.28 | 253 | 230 | 69.8 |
Histogram calculated using DETX and DETY for each event in the final _common_clean file
| Quadrant A |  |
 |
Quadrant B |
|---|---|---|---|
| Quadrant D |  |
 |
Quadrant C |
| Plot type | Count rate plots | Images |
|---|---|---|
| Comparison with Poisson distribution Blue bars denote a histogram of data divided into 1 sec bins. Red curve is a Poisson curve with rate = median count rate of data. |
 |
 |
| Quadrant-wise count rates Data is divided into 100 sec bins |
 |
|
| Module-wise count rates for Quadrant A Data is divided into 100 sec bins |
 |
 |
| Module-wise count rates for Quadrant B Data is divided into 100 sec bins |
 |
 |
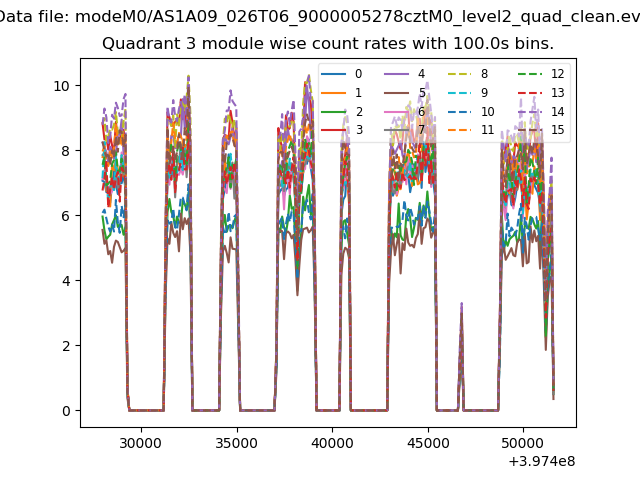
| Module-wise count rates for Quadrant C Data is divided into 100 sec bins |
 |
 |
| Module-wise count rates for Quadrant D Data is divided into 100 sec bins |
 |
 |
| Parameter | Plot |
|---|---|
| CZT HV Monitor |  |
| D_VDD | 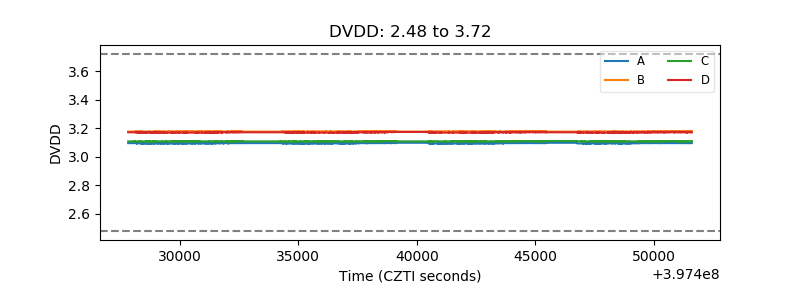 |
| Temperature 1 |  |
| Veto HV Monitor |  |
| Veto LLD | 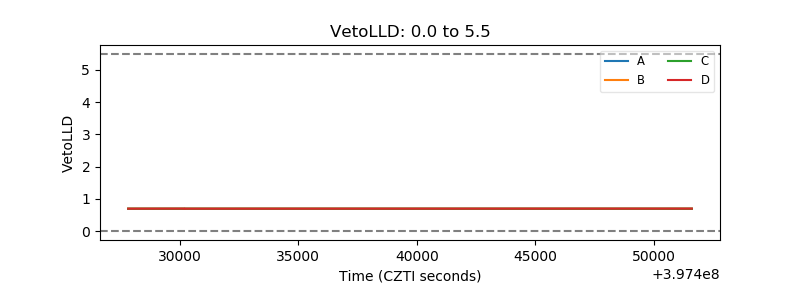 |
| Alpha Counter |  |
| _CPM_Rate |  |
| CZT Counter |  |
| +2.5 Volts monitor |  |
| +5 Volts monitor |  |
| _ROLL_ROT |  |
| _Roll_DEC |  |
| _Roll_RA |  |
| Veto Counter |  |