| Param | Original file | Final file |
|---|---|---|
| Filename | modeM0/AS1A09_026T06_9000005278_37060cztM0_level2.evt | modeM0/AS1A09_026T06_9000005278_37060cztM0_level2_quad_clean.evt |
| Size (bytes) | 89,360,640 | 14,823,360 |
| Size | 85.2 MB | 14.1 MB |
| Events in quadrant A | 437,466 | 101,844 |
| Events in quadrant B | 614,305 | 96,631 |
| Events in quadrant C | 547,794 | 94,806 |
| Events in quadrant D | 1,050,223 | 92,359 |
| Mode M9 | |||
|---|---|---|---|
| Quadrant | BADHDUFLAG | Total packets | Discarded packets |
| A | 0 | 2 | 0 |
| B | 0 | 2 | 0 |
| C | 0 | 2 | 0 |
| D | 0 | 2 | 0 |
| Mode SS | |||
|---|---|---|---|
| Quadrant | BADHDUFLAG | Total packets | Discarded packets |
| A | 0 | 16 | 0 |
| B | 0 | 16 | 0 |
| C | 0 | 16 | 0 |
| D | 0 | 16 | 0 |
| Mode M0 | |||
|---|---|---|---|
| Quadrant | BADHDUFLAG | Total packets | Discarded packets |
| A | 0 | 1805 | 2 |
| B | 0 | 2341 | 1 |
| C | 0 | 2099 | 1 |
| D | 0 | 3663 | 1 |
| Quadrant | Total seconds | Saturated seconds | Saturation percentage |
|---|---|---|---|
| A | 790 | 2 | 0.253165% |
| B | 790 | 69 | 8.734177% |
| C | 790 | 83 | 10.506329% |
| D | 790 | 98 | 12.405063% |
Noise dominated data is calculated using 1-second bins in cleaned event files. If a bin has >2000 counts, and if more than 50% of those come from <1% of pixels, then it is considered to be noise-dominated and hence unusable.
| Quadrant | # 1 sec bins | Bins with >0 counts | Bins with >2000 counts | High rate bins dominated by noise | Noise dominated (total time) | Noise dominated (detector-on time) | Marked lightcurve |
|---|---|---|---|---|---|---|---|
| A | 790 | 790 | 2 | 2 | 0.25% | 0.25% | 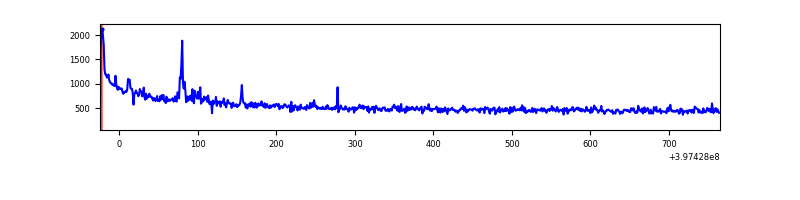 |
| B | 790 | 790 | 52 | 52 | 6.58% | 6.58% | 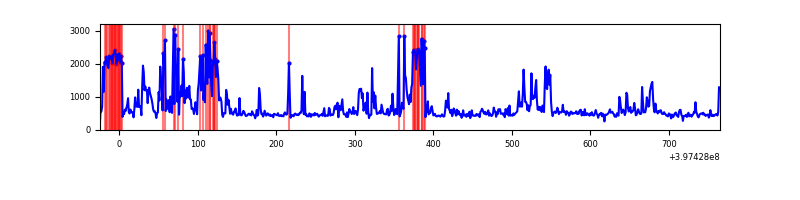 |
| C | 790 | 790 | 54 | 54 | 6.84% | 6.84% | 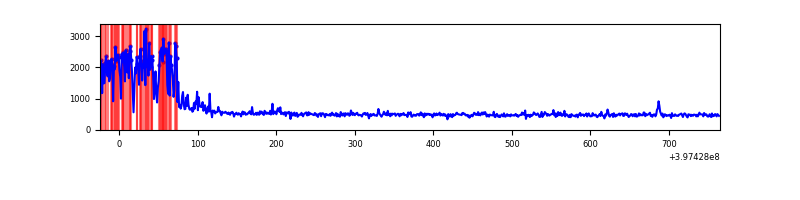 |
| D | 790 | 790 | 132 | 132 | 16.71% | 16.71% | 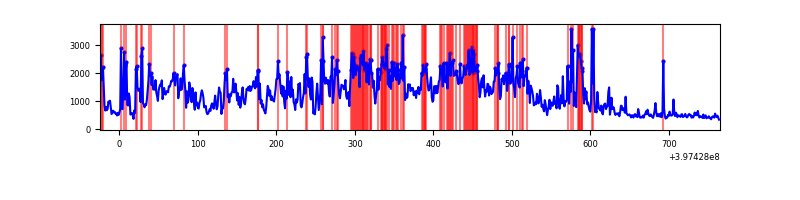 |
Top three noisy pixels from each quadrant. If the there are fewer than three noisy pixels in the level2.evt file, extra rows are filled as -1
| Pixel properties | Quadrant properties | ||||||
|---|---|---|---|---|---|---|---|
| Quadrant | DetID | PixID | Counts | Sigma | Mean | Median | Sigma |
| A | 10 | 83 | 84392 | 4349.15 | 87 | 85 | 19.4 |
| A | 7 | 3 | 6020 | 306.17 | 87 | 85 | 19.4 |
| A | 10 | 67 | 2827 | 141.45 | 87 | 85 | 19.4 |
| B | 5 | 184 | 136195 | 7466.91 | 84 | 81 | 18.2 |
| B | 5 | 172 | 62264 | 3411.22 | 84 | 81 | 18.2 |
| B | 0 | 190 | 41190 | 2255.15 | 84 | 81 | 18.2 |
| C | 0 | 10 | 184026 | 8559.37 | 82 | 83 | 21.5 |
| C | 15 | 214 | 35691 | 1656.94 | 82 | 83 | 21.5 |
| C | 15 | 159 | 2572 | 115.82 | 82 | 83 | 21.5 |
| D | 6 | 112 | 517979 | 23024.26 | 85 | 82 | 22.5 |
| D | 1 | 52 | 104107 | 4624.66 | 85 | 82 | 22.5 |
| D | 13 | 249 | 19076 | 844.42 | 85 | 82 | 22.5 |
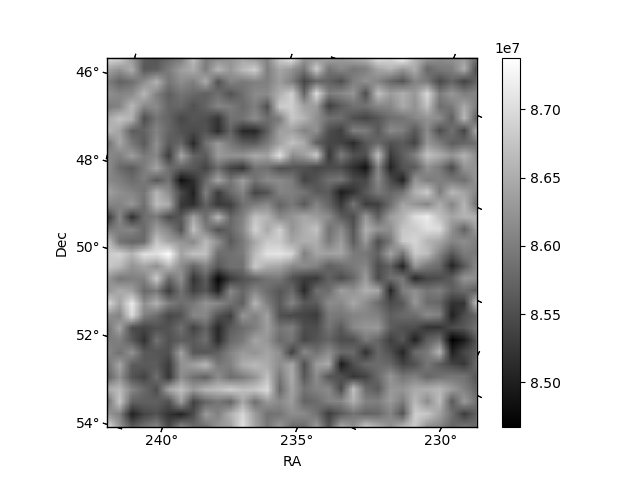
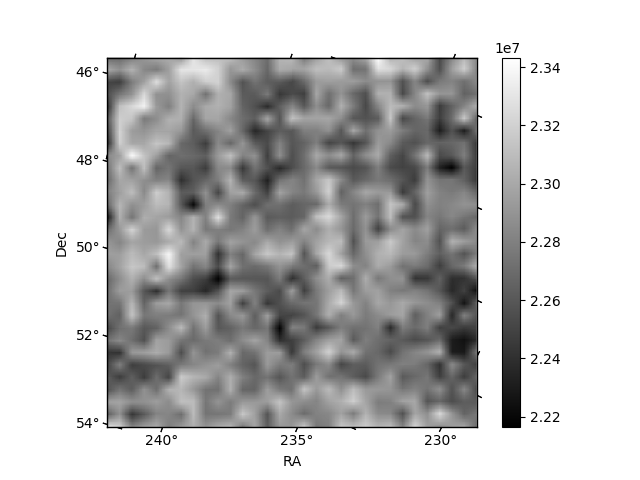
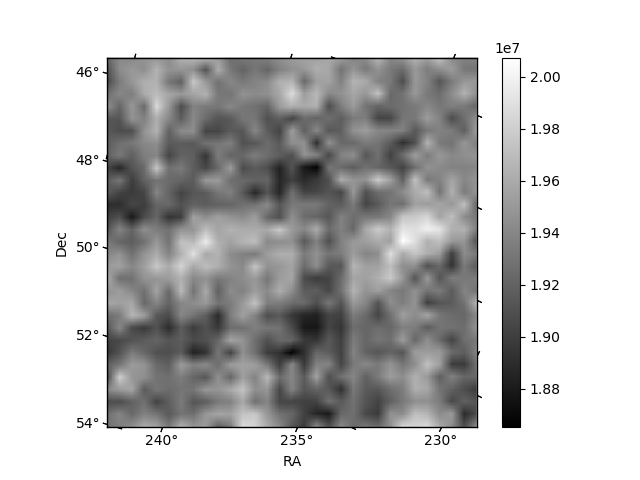
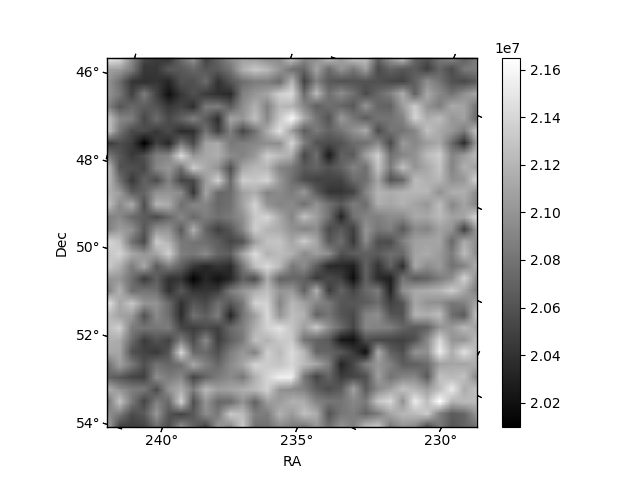
Histogram calculated using DETX and DETY for each event in the final _common_clean file
| Quadrant A | 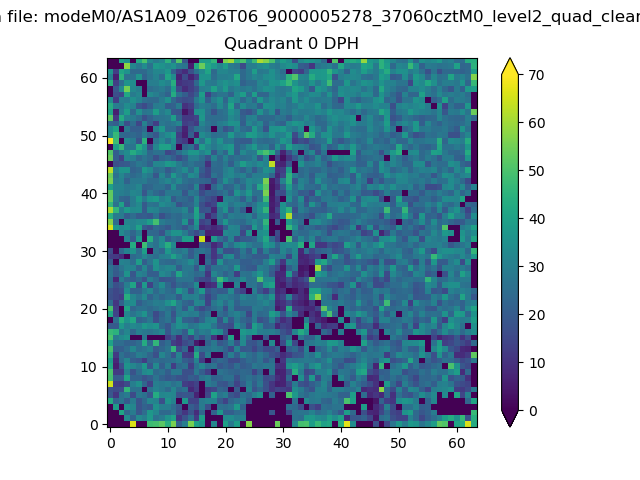 |
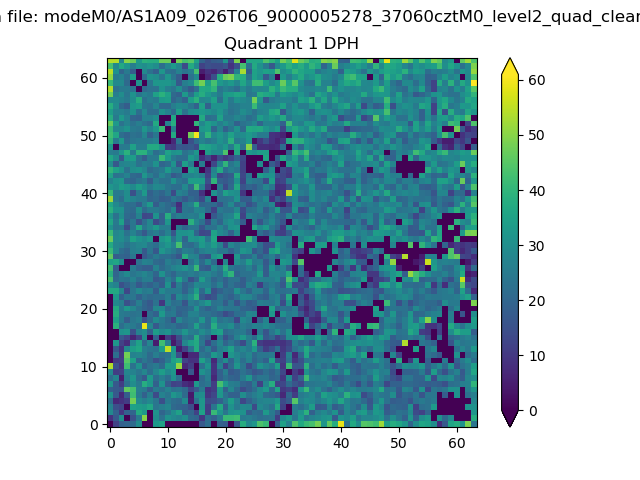 |
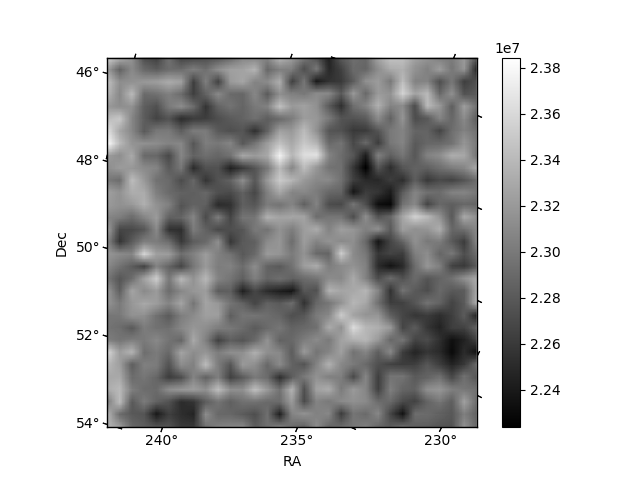
Quadrant B |
|---|---|---|---|
| Quadrant D | 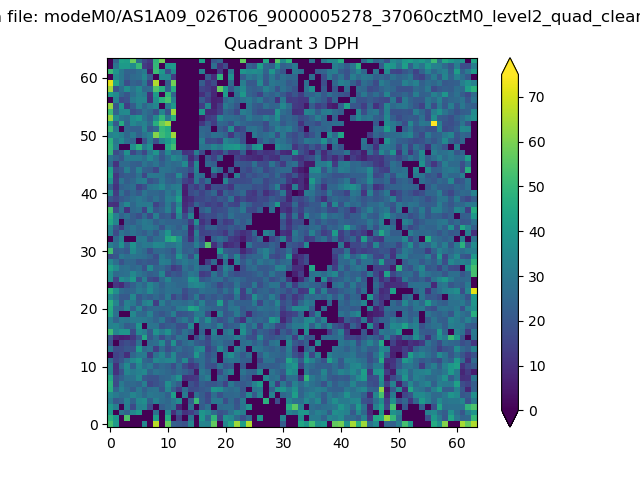 |
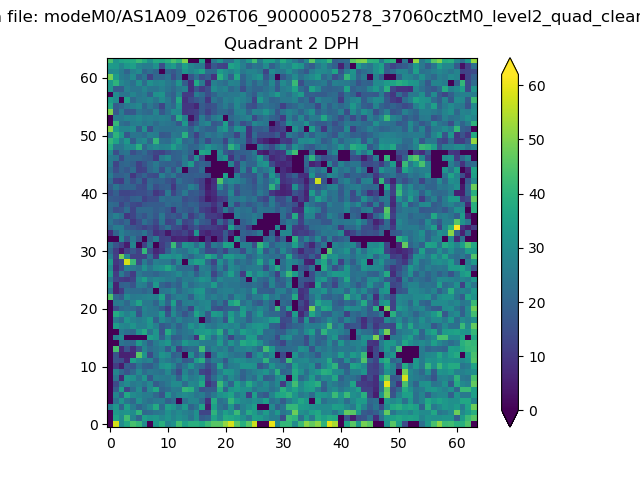 |
Quadrant C |
| Plot type | Count rate plots | Images |
|---|---|---|
| Comparison with Poisson distribution Blue bars denote a histogram of data divided into 1 sec bins. Red curve is a Poisson curve with rate = median count rate of data. |
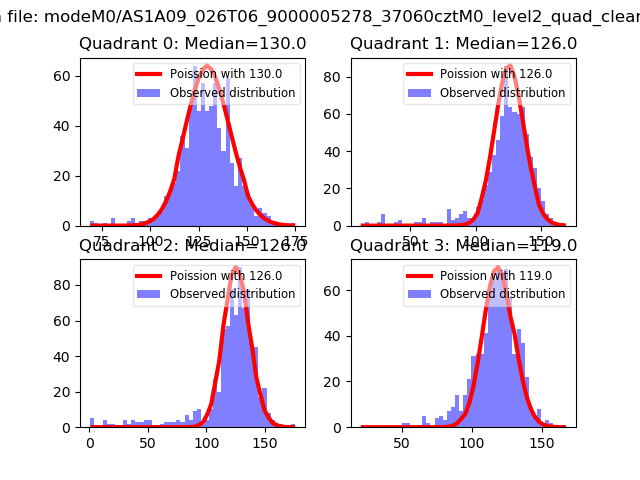 |
 |
| Quadrant-wise count rates Data is divided into 100 sec bins |
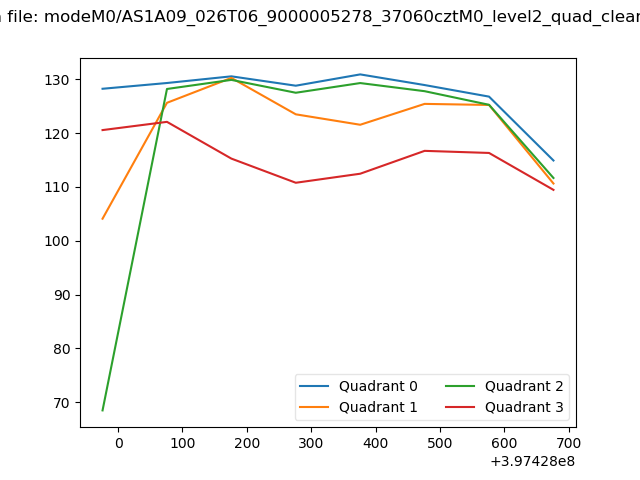 |
|
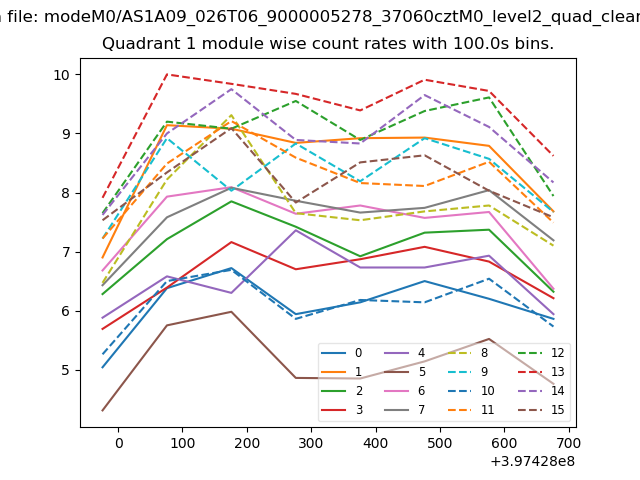
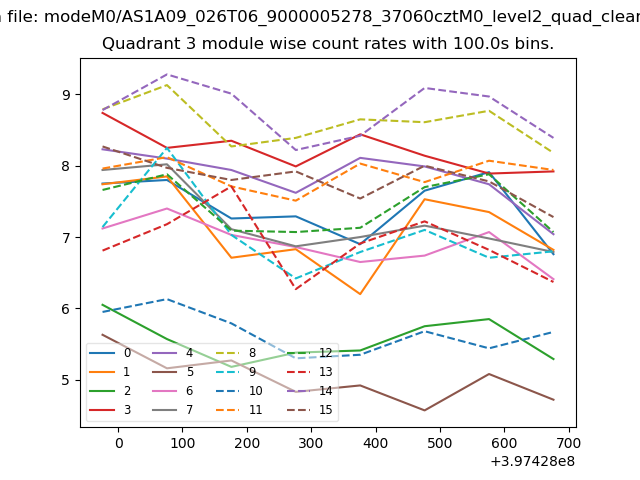
| Module-wise count rates for Quadrant A Data is divided into 100 sec bins |
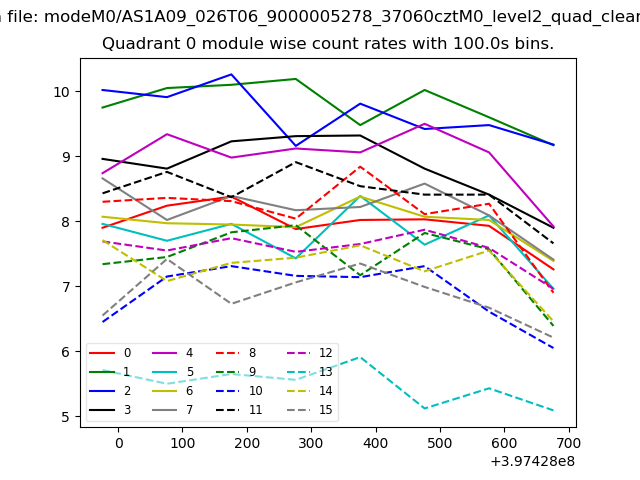 |
 |
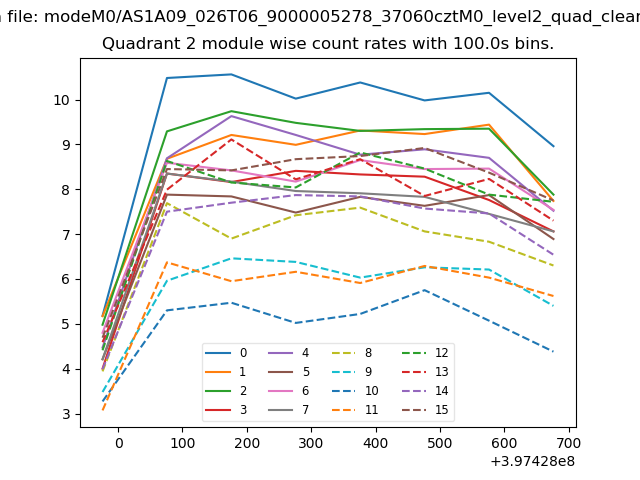
| Module-wise count rates for Quadrant B Data is divided into 100 sec bins |
 |
 |
| Module-wise count rates for Quadrant C Data is divided into 100 sec bins |
 |
 |
| Module-wise count rates for Quadrant D Data is divided into 100 sec bins |
 |
 |
| Parameter | Plot |
|---|---|
| CZT HV Monitor | 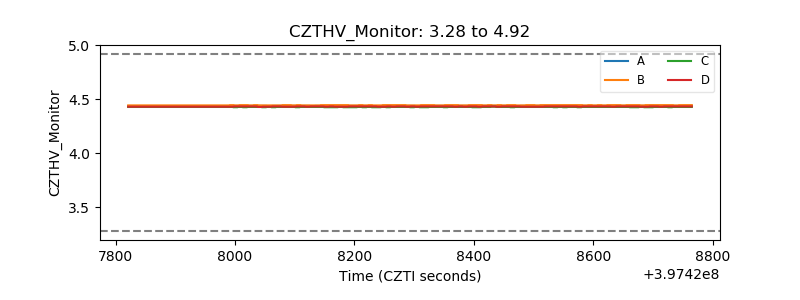 |
| D_VDD | 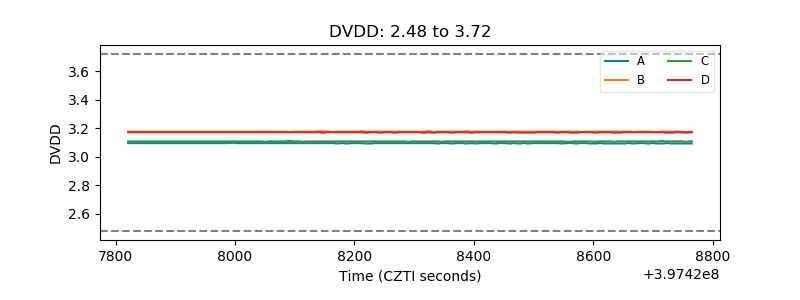 |
| Temperature 1 | 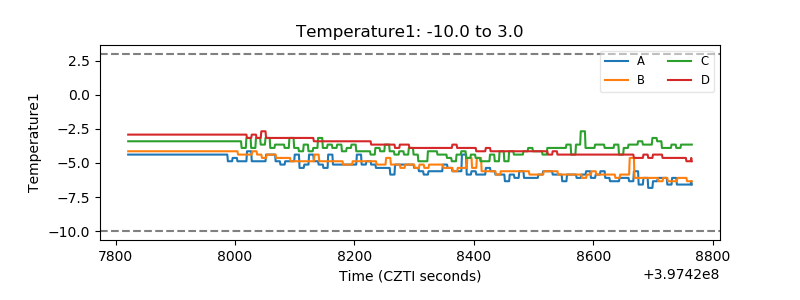 |
| Veto HV Monitor | 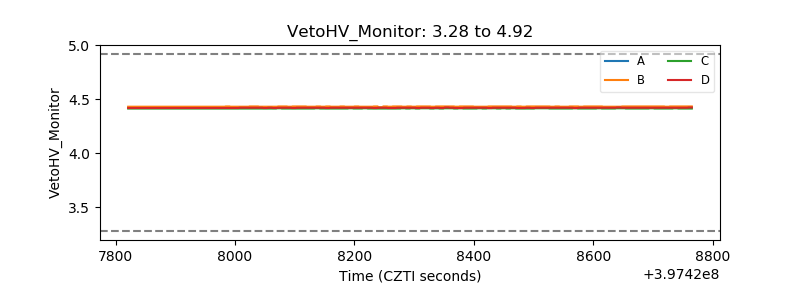 |
| Veto LLD | 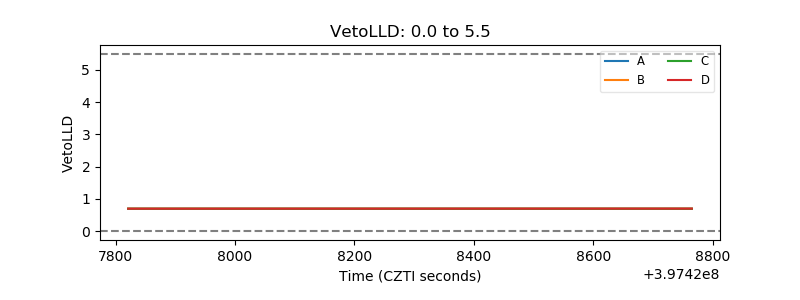 |
| Alpha Counter | 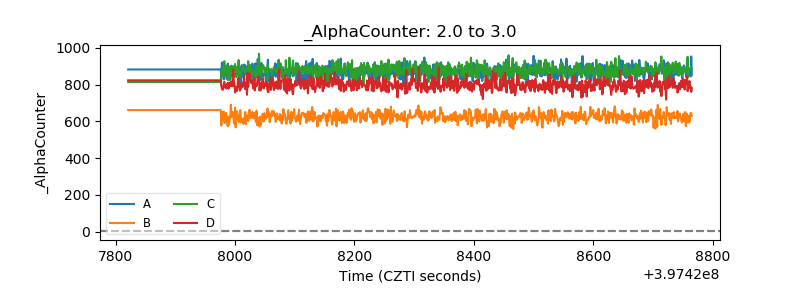 |
| _CPM_Rate | 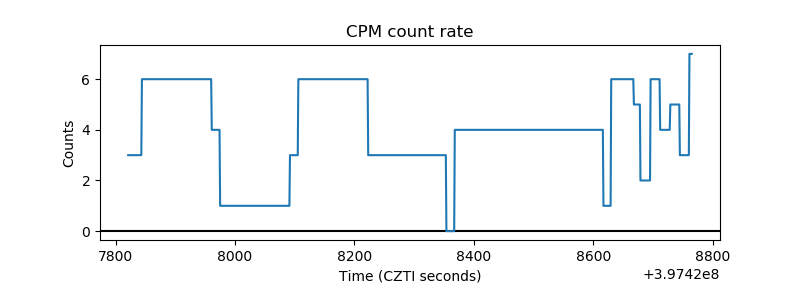 |
| CZT Counter | 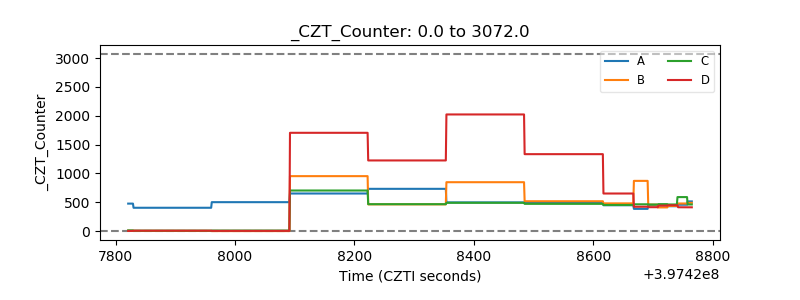 |
| +2.5 Volts monitor | 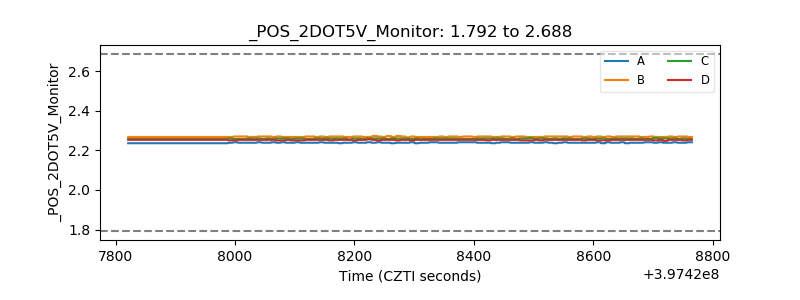 |
| +5 Volts monitor | 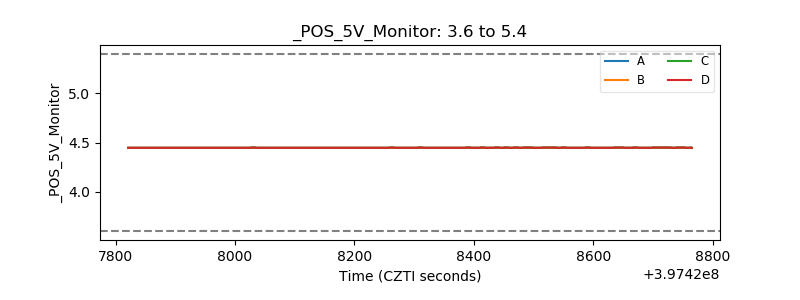 |
| _ROLL_ROT | 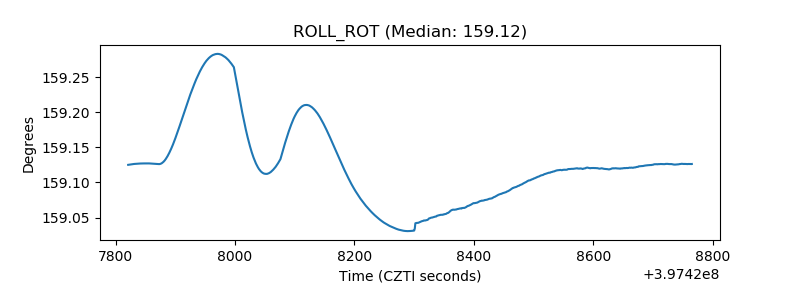 |
| _Roll_DEC | 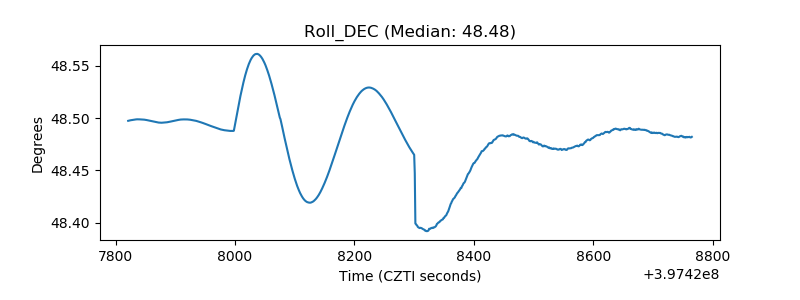 |
| _Roll_RA | 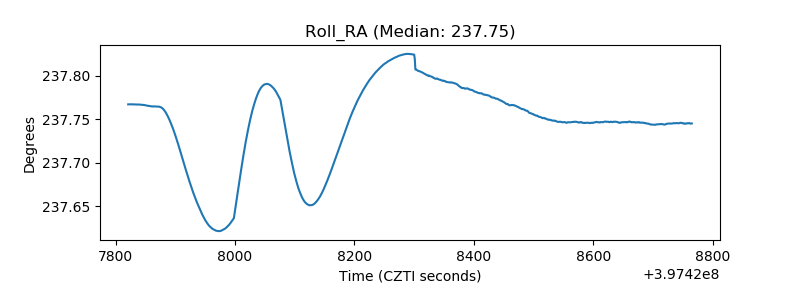 |
| Veto Counter | 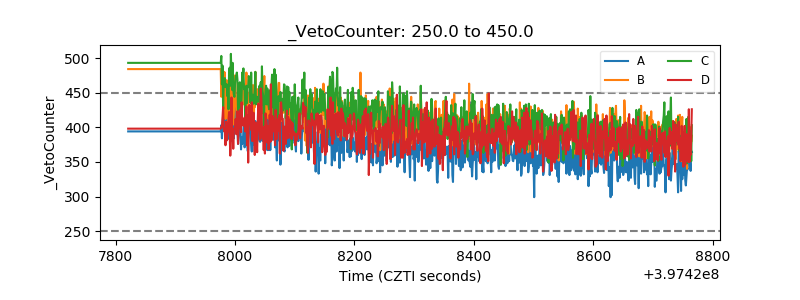 |