| Param | Original file | Final file |
|---|---|---|
| Filename | modeM0/AS1A09_026T06_9000005278_37061cztM0_level2.evt | modeM0/AS1A09_026T06_9000005278_37061cztM0_level2_quad_clean.evt |
| Size (bytes) | 469,195,200 | 68,397,120 |
| Size | 447.5 MB | 65.2 MB |
| Events in quadrant A | 2,728,873 | 438,014 |
| Events in quadrant B | 3,813,810 | 417,917 |
| Events in quadrant C | 2,890,760 | 427,211 |
| Events in quadrant D | 4,408,501 | 408,484 |
| Mode M9 | |||
|---|---|---|---|
| Quadrant | BADHDUFLAG | Total packets | Discarded packets |
| A | 0 | 17 | 0 |
| B | 0 | 17 | 0 |
| C | 0 | 17 | 0 |
| D | 0 | 17 | 0 |
| Mode SS | |||
|---|---|---|---|
| Quadrant | BADHDUFLAG | Total packets | Discarded packets |
| A | 0 | 112 | 0 |
| B | 0 | 112 | 0 |
| C | 0 | 112 | 0 |
| D | 0 | 112 | 0 |
| Mode M0 | |||
|---|---|---|---|
| Quadrant | BADHDUFLAG | Total packets | Discarded packets |
| A | 0 | 11599 | 3 |
| B | 0 | 15002 | 2 |
| C | 0 | 11886 | 2 |
| D | 0 | 16846 | 2 |
| Quadrant | Total seconds | Saturated seconds | Saturation percentage |
|---|---|---|---|
| A | 5411 | 6 | 0.110885% |
| B | 5411 | 346 | 6.394382% |
| C | 5411 | 107 | 1.977453% |
| D | 5411 | 282 | 5.211606% |
Noise dominated data is calculated using 1-second bins in cleaned event files. If a bin has >2000 counts, and if more than 50% of those come from <1% of pixels, then it is considered to be noise-dominated and hence unusable.
| Quadrant | # 1 sec bins | Bins with >0 counts | Bins with >2000 counts | High rate bins dominated by noise | Noise dominated (total time) | Noise dominated (detector-on time) | Marked lightcurve |
|---|---|---|---|---|---|---|---|
| A | 6964 | 5412 | 6 | 6 | 0.09% | 0.11% | 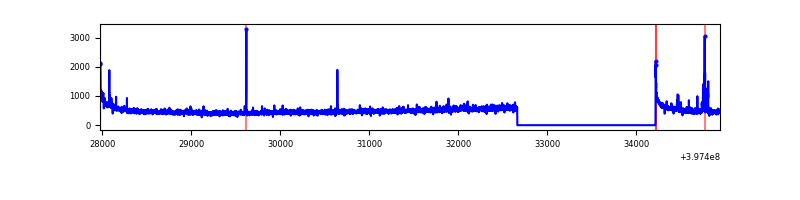 |
| B | 6964 | 5412 | 255 | 255 | 3.66% | 4.71% | 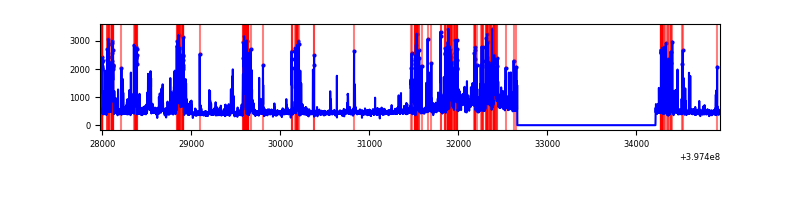 |
| C | 6964 | 5412 | 75 | 75 | 1.08% | 1.39% | 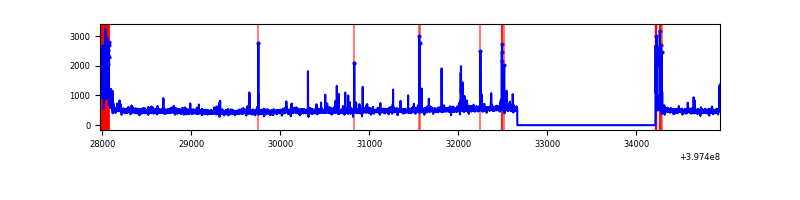 |
| D | 6964 | 5412 | 310 | 310 | 4.45% | 5.73% | 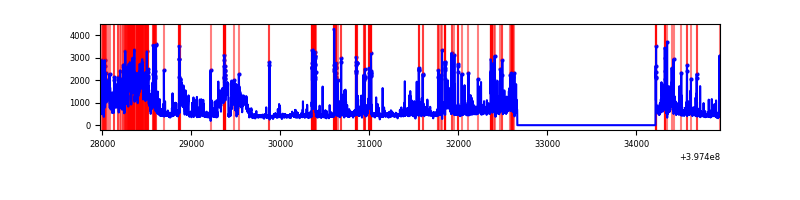 |
Top three noisy pixels from each quadrant. If the there are fewer than three noisy pixels in the level2.evt file, extra rows are filled as -1
| Pixel properties | Quadrant properties | ||||||
|---|---|---|---|---|---|---|---|
| Quadrant | DetID | PixID | Counts | Sigma | Mean | Median | Sigma |
| A | 10 | 83 | 261427 | 2101.18 | 614 | 602 | 124.1 |
| A | 9 | 143 | 59126 | 471.46 | 614 | 602 | 124.1 |
| A | 13 | 6 | 10529 | 79.97 | 614 | 602 | 124.1 |
| B | 5 | 172 | 677056 | 5949.68 | 594 | 579 | 113.7 |
| B | 5 | 184 | 420167 | 3690.31 | 594 | 579 | 113.7 |
| B | 0 | 190 | 169281 | 1483.75 | 594 | 579 | 113.7 |
| C | 0 | 10 | 240568 | 1734.41 | 595 | 600 | 138.4 |
| C | 15 | 214 | 228802 | 1649.37 | 595 | 600 | 138.4 |
| C | 14 | 254 | 59181 | 423.4 | 595 | 600 | 138.4 |
| D | 6 | 112 | 959704 | 6650.6 | 590 | 575 | 144.2 |
| D | 1 | 52 | 342420 | 2370.35 | 590 | 575 | 144.2 |
| D | 13 | 171 | 144534 | 998.21 | 590 | 575 | 144.2 |
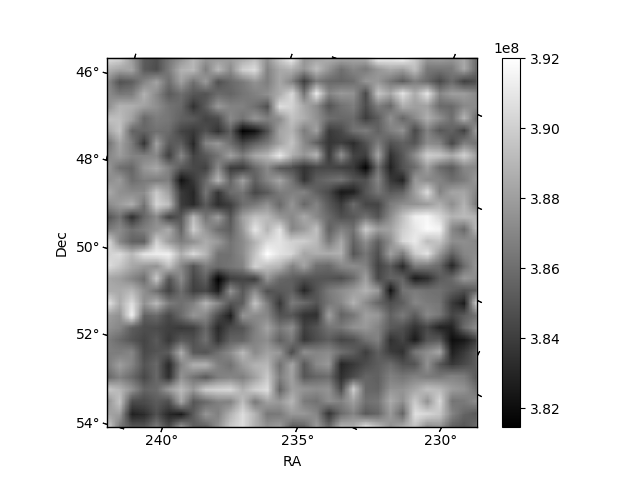
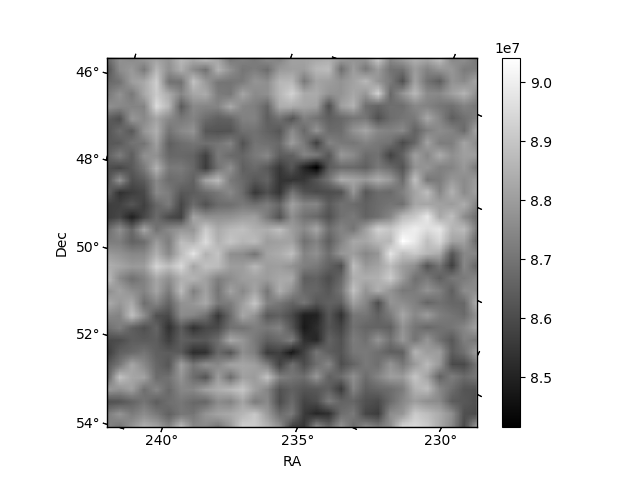
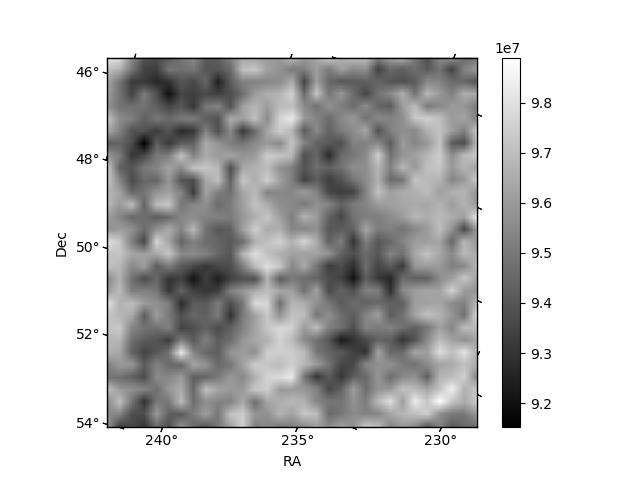
Histogram calculated using DETX and DETY for each event in the final _common_clean file
| Quadrant A | 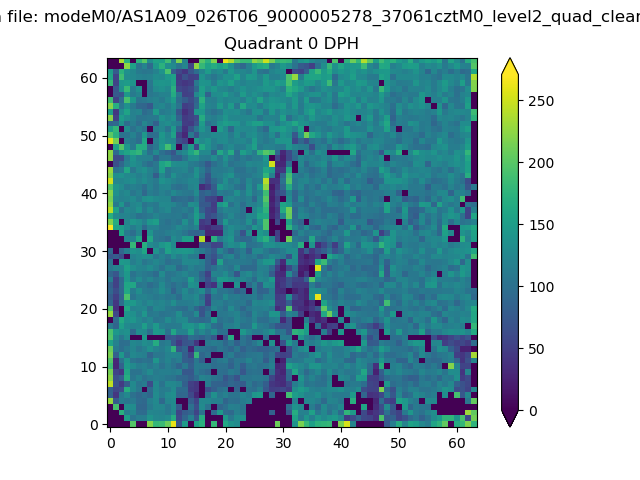 |
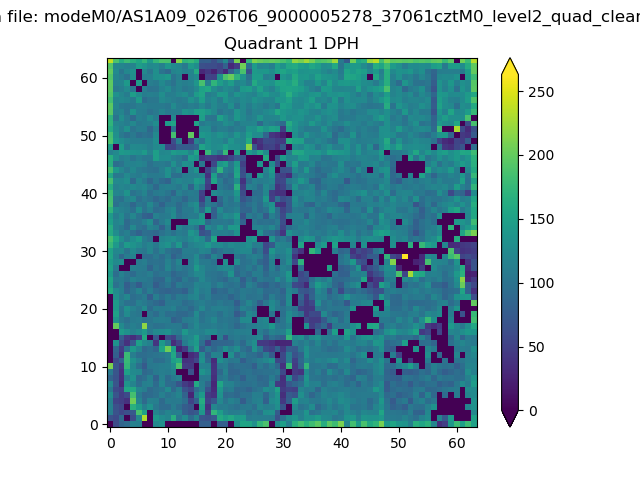 |
Quadrant B |
|---|---|---|---|
| Quadrant D | 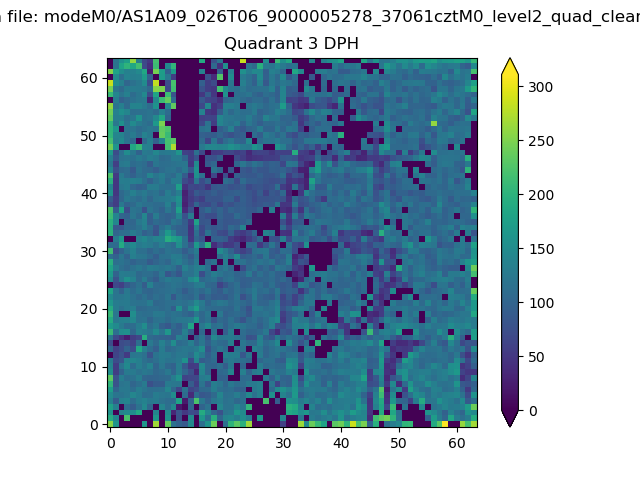 |
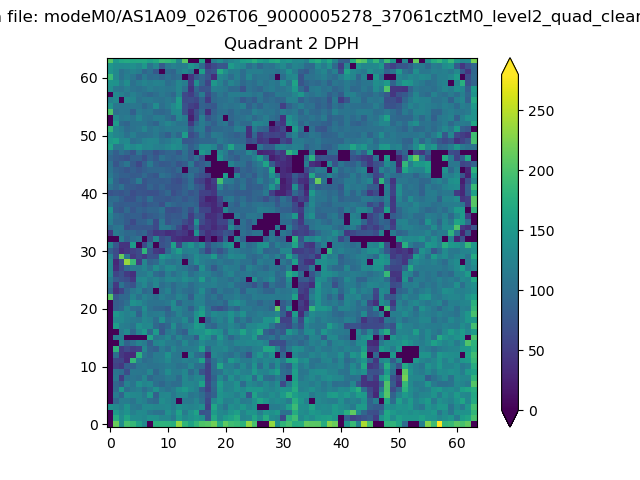 |
Quadrant C |
| Plot type | Count rate plots | Images |
|---|---|---|
| Comparison with Poisson distribution Blue bars denote a histogram of data divided into 1 sec bins. Red curve is a Poisson curve with rate = median count rate of data. |
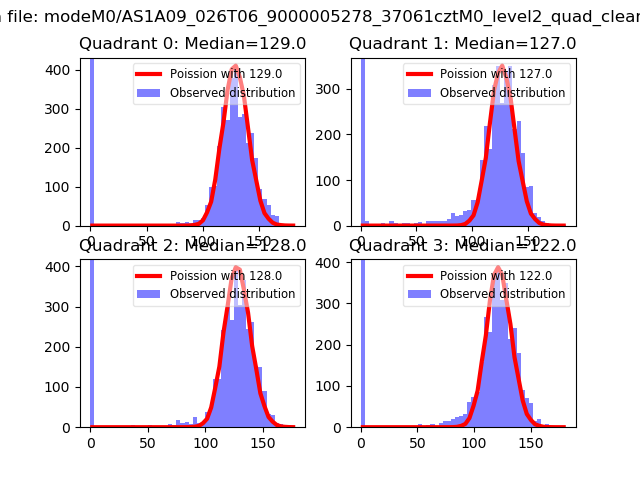 |
 |
| Quadrant-wise count rates Data is divided into 100 sec bins |
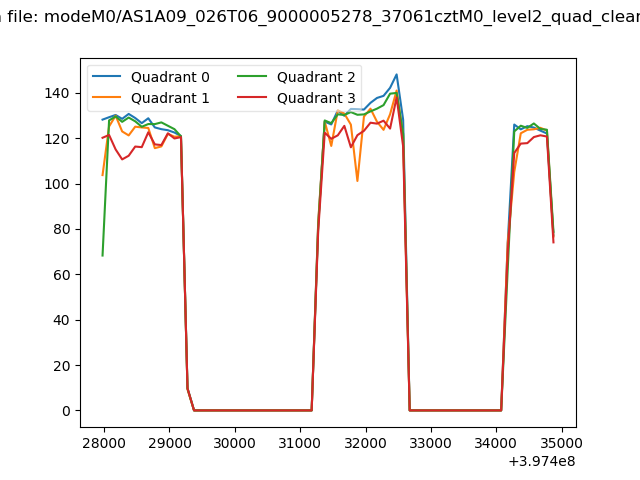 |
|
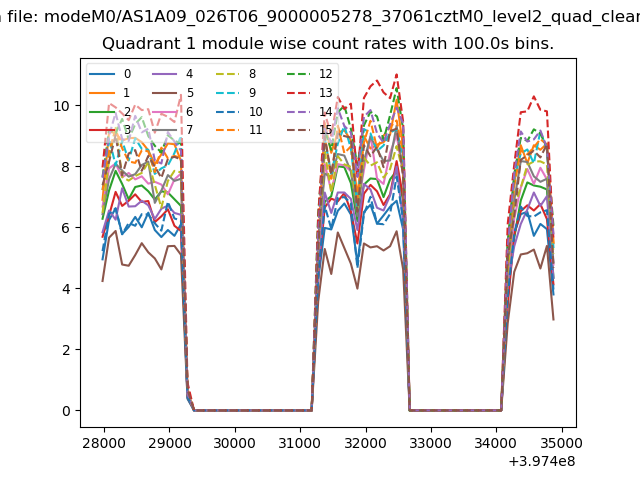
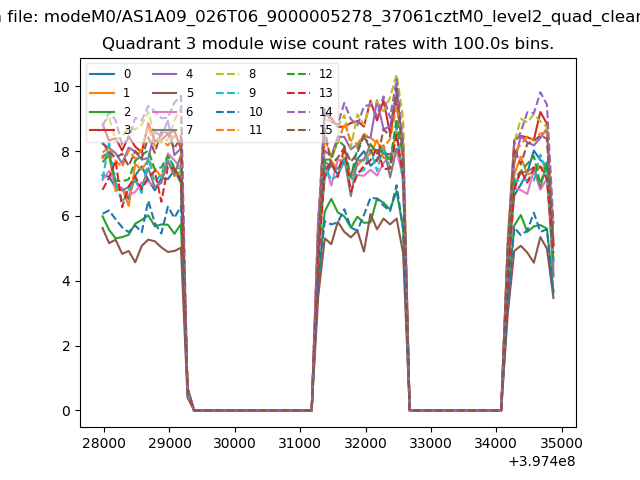
| Module-wise count rates for Quadrant A Data is divided into 100 sec bins |
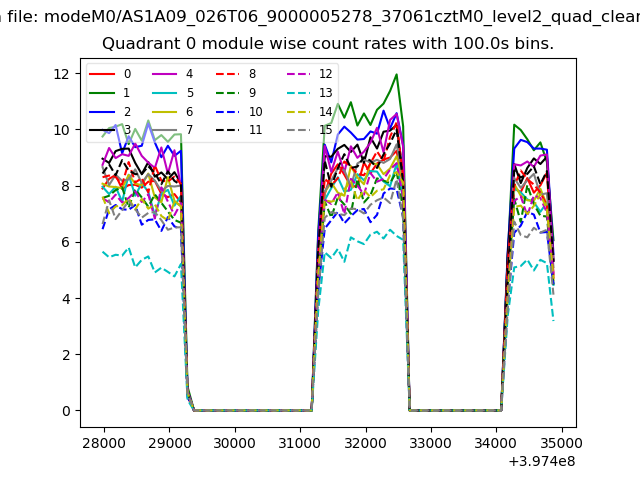 |
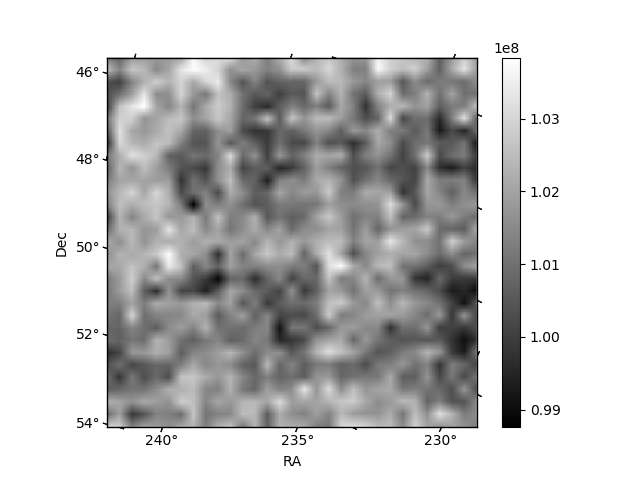 |
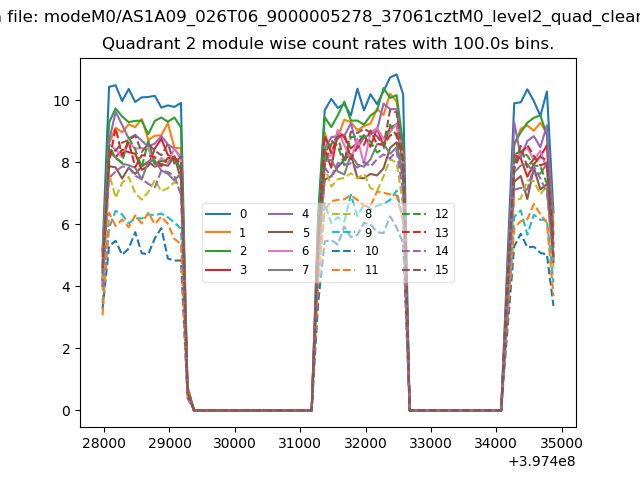
| Module-wise count rates for Quadrant B Data is divided into 100 sec bins |
 |
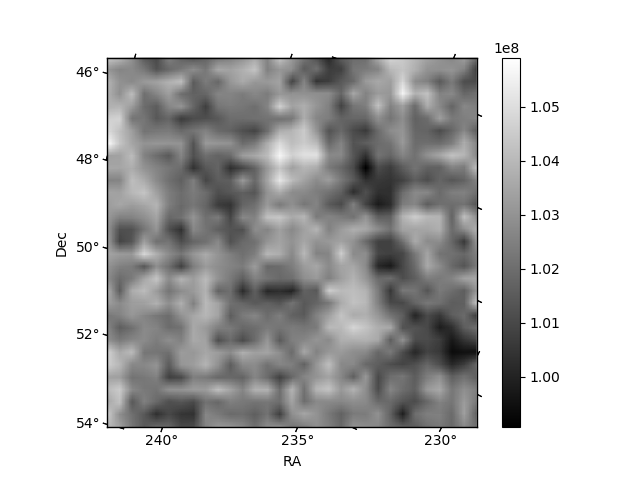 |
| Module-wise count rates for Quadrant C Data is divided into 100 sec bins |
 |
 |
| Module-wise count rates for Quadrant D Data is divided into 100 sec bins |
 |
 |
| Parameter | Plot |
|---|---|
| CZT HV Monitor | 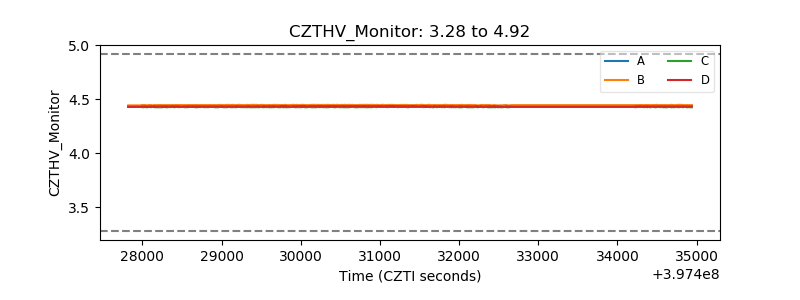 |
| D_VDD | 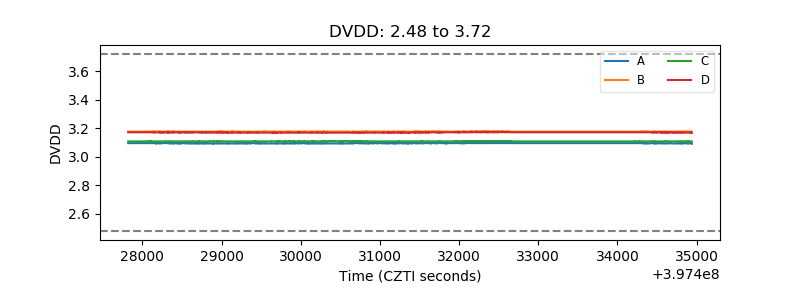 |
| Temperature 1 | 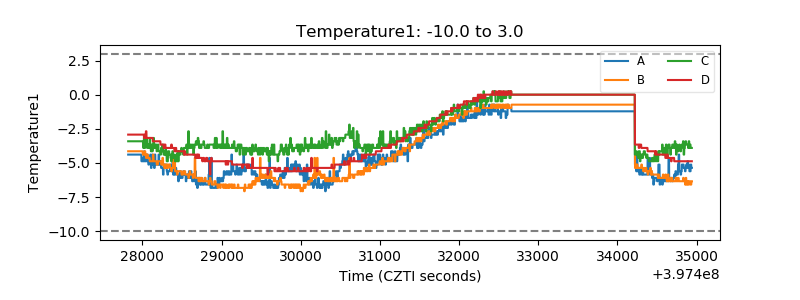 |
| Veto HV Monitor | 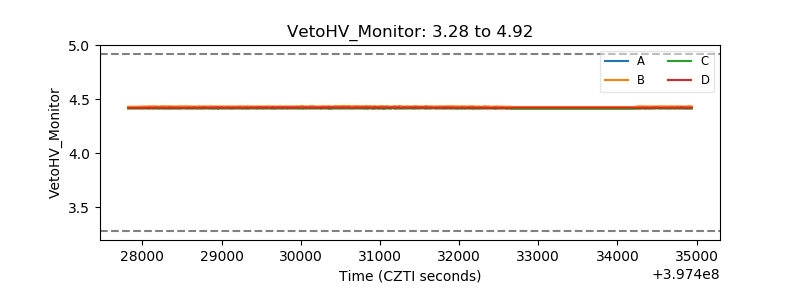 |
| Veto LLD | 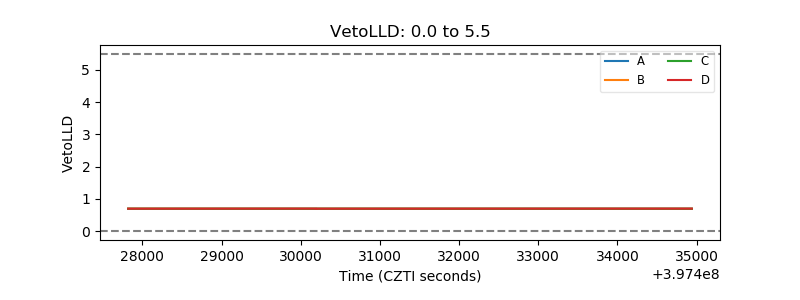 |
| Alpha Counter | 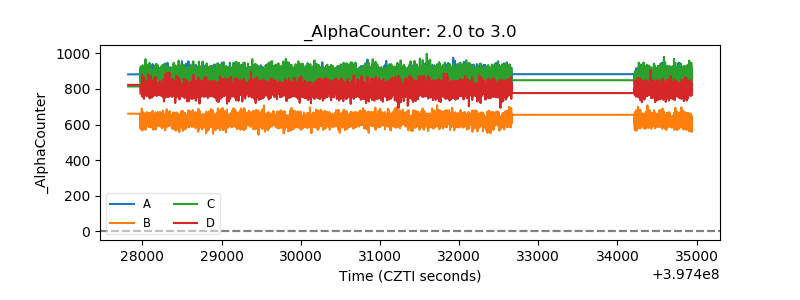 |
| _CPM_Rate | 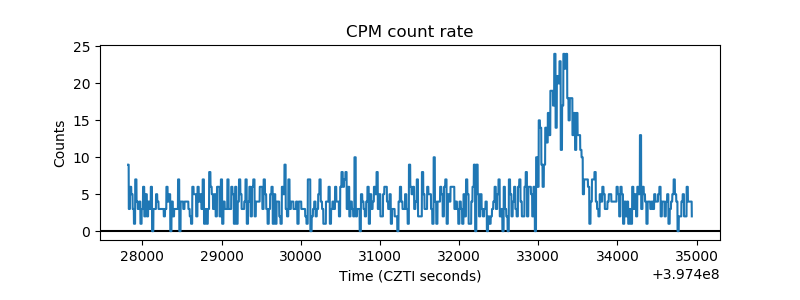 |
| CZT Counter | 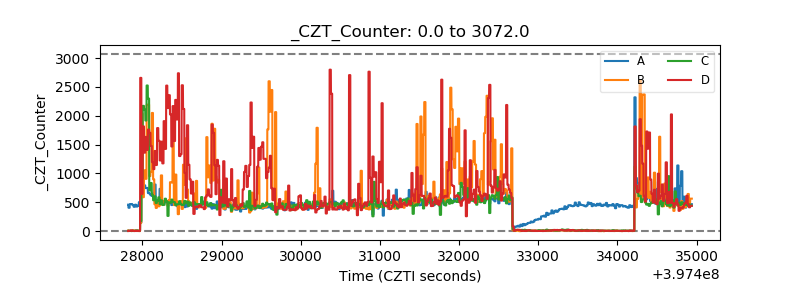 |
| +2.5 Volts monitor | 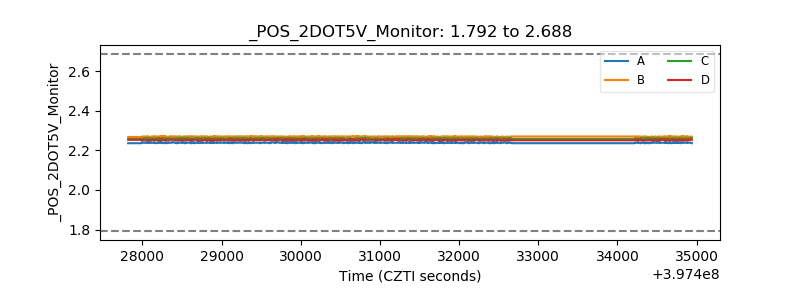 |
| +5 Volts monitor | 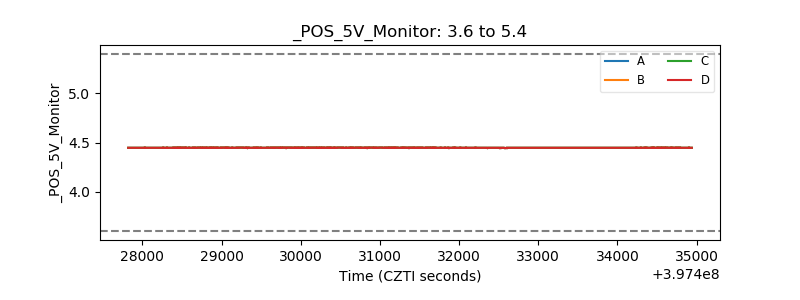 |
| _ROLL_ROT | 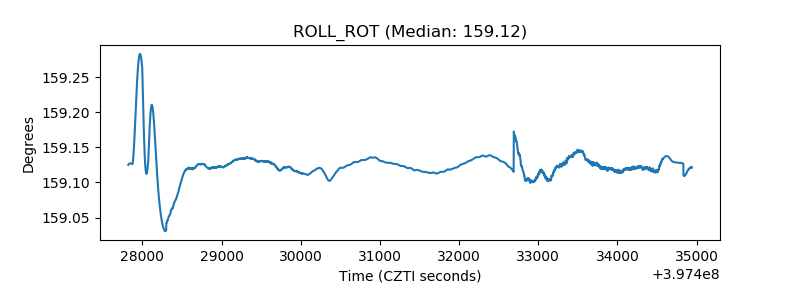 |
| _Roll_DEC | 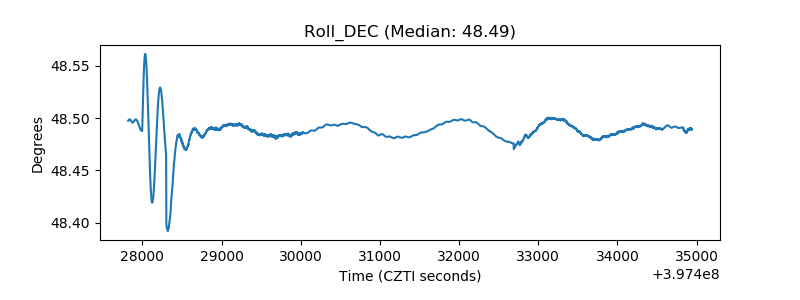 |
| _Roll_RA | 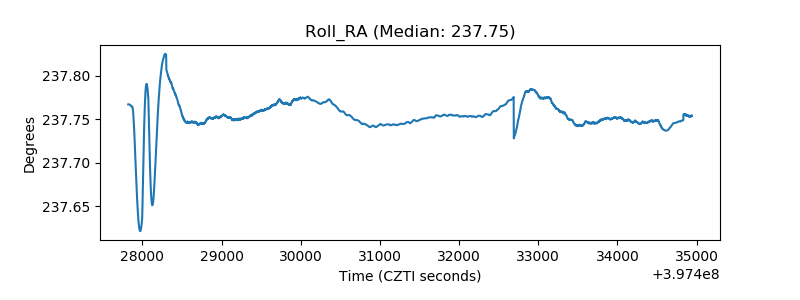 |
| Veto Counter | 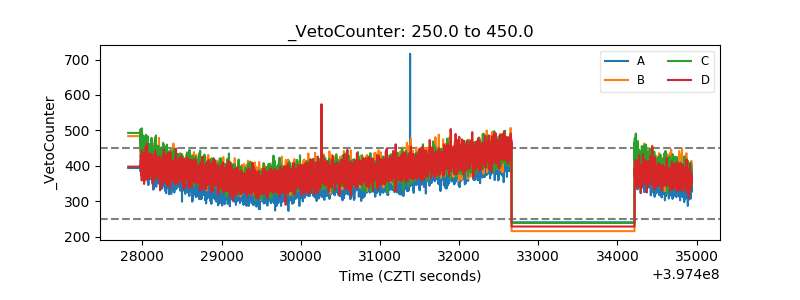 |