| Param | Original file | Final file |
|---|---|---|
| Filename | modeM0/AS1A09_038T01_9000005276cztM0_level2.fits | modeM0/AS1A09_038T01_9000005276cztM0_level2_quad_clean.evt |
| Size (bytes) | 54,014,400 | 57,934,080 |
| Size | 51.5 MB | 55.3 MB |
| Events in quadrant A | 341,178 | 364,450 |
| Events in quadrant B | 305,008 | 355,132 |
| Events in quadrant C | 335,614 | 346,934 |
| Events in quadrant D | 250,984 | 284,800 |
| Mode M9 | |||
|---|---|---|---|
| Quadrant | BADHDUFLAG | Total packets | Discarded packets |
| A | 0 | 24 | 0 |
| B | 0 | 24 | 0 |
| C | 0 | 24 | 0 |
| D | 0 | 24 | 0 |
| Mode M0 | |||
|---|---|---|---|
| Quadrant | BADHDUFLAG | Total packets | Discarded packets |
| A | 0 | 11859 | 0 |
| B | 0 | 17058 | 0 |
| C | 0 | 12238 | 0 |
| D | 0 | 21344 | 0 |
| Mode SS | |||
|---|---|---|---|
| Quadrant | BADHDUFLAG | Total packets | Discarded packets |
| A | 0 | 120 | 0 |
| B | 0 | 120 | 0 |
| C | 0 | 120 | 0 |
| D | 0 | 120 | 0 |
| Quadrant | Total seconds | Saturated seconds | Saturation percentage |
|---|---|---|---|
| A | 5752 | 6 | 0.104312% |
| B | 5752 | 763 | 13.264951% |
| C | 5752 | 47 | 0.817107% |
| D | 5752 | 1293 | 22.479138% |
Noise dominated data is calculated using 1-second bins in cleaned event files. If a bin has >2000 counts, and if more than 50% of those come from <1% of pixels, then it is considered to be noise-dominated and hence unusable.
| Quadrant | # 1 sec bins | Bins with >0 counts | Bins with >2000 counts | High rate bins dominated by noise | Noise dominated (total time) | Noise dominated (detector-on time) | Marked lightcurve |
|---|---|---|---|---|---|---|---|
| A | 7875 | 5752 | 0 | 0 | 0.00% | 0.00% | 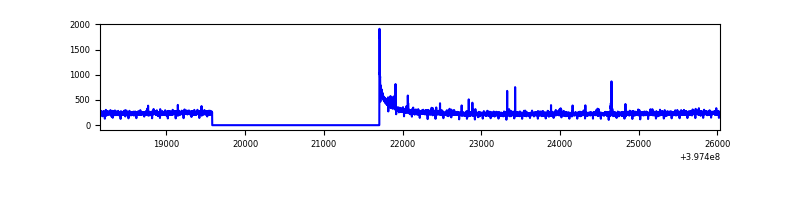 |
| B | 7875 | 5748 | 0 | 0 | 0.00% | 0.00% | 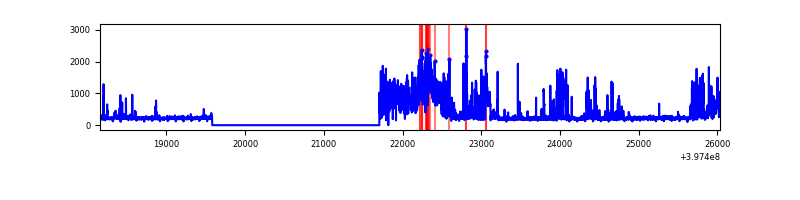 |
| C | 7875 | 5752 | 0 | 0 | 0.00% | 0.00% | 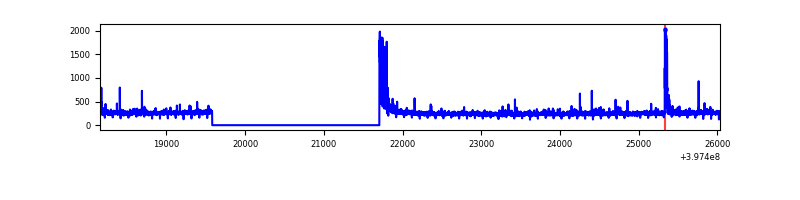 |
| D | 7875 | 5652 | 0 | 0 | 0.00% | 0.00% | 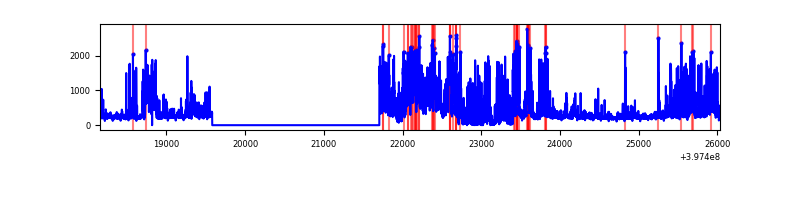 |
Top three noisy pixels from each quadrant. If the there are fewer than three noisy pixels in the level2.evt file, extra rows are filled as -1
| Pixel properties | Quadrant properties | ||||||
|---|---|---|---|---|---|---|---|
| Quadrant | DetID | PixID | Counts | Sigma | Mean | Median | Sigma |
| A | 9 | 19 | 313 | 9.63 | 89 | 84 | 23.8 |
| A | 14 | 79 | 289 | 8.62 | 89 | 84 | 23.8 |
| A | 0 | 29 | 269 | 7.78 | 89 | 84 | 23.8 |
| B | 2 | 9 | 266 | 10.34 | 80 | 77 | 18.3 |
| B | 3 | 80 | 237 | 8.75 | 80 | 77 | 18.3 |
| B | 2 | 8 | 224 | 8.04 | 80 | 77 | 18.3 |
| C | 1 | 81 | 291 | 8.39 | 89 | 83 | 24.8 |
| C | 1 | 80 | 288 | 8.27 | 89 | 83 | 24.8 |
| C | 1 | 65 | 239 | 6.29 | 89 | 83 | 24.8 |
| D | 10 | 113 | 207 | 6.79 | 71 | 65 | 20.8 |
| D | 3 | 14 | 184 | 5.69 | 71 | 65 | 20.8 |
| D | 6 | 8 | 181 | 5.54 | 71 | 65 | 20.8 |
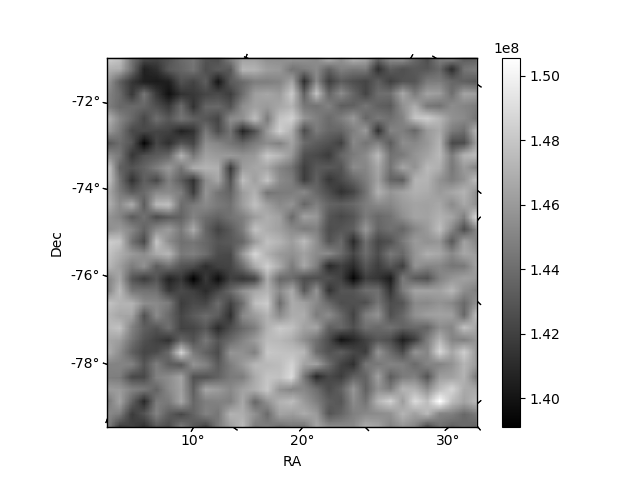
Histogram calculated using DETX and DETY for each event in the final _common_clean file
| Quadrant A | 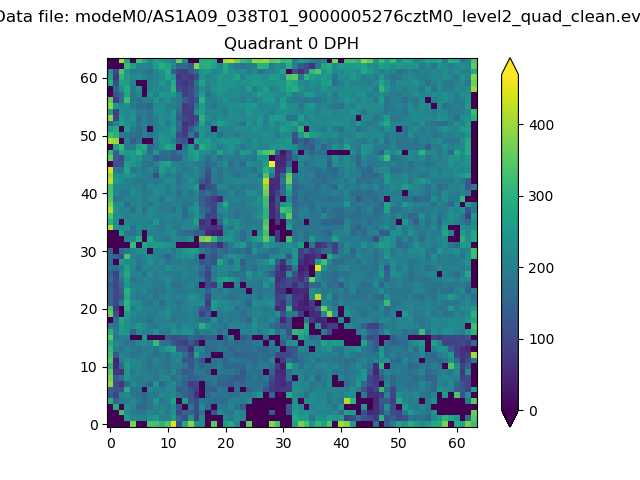 |
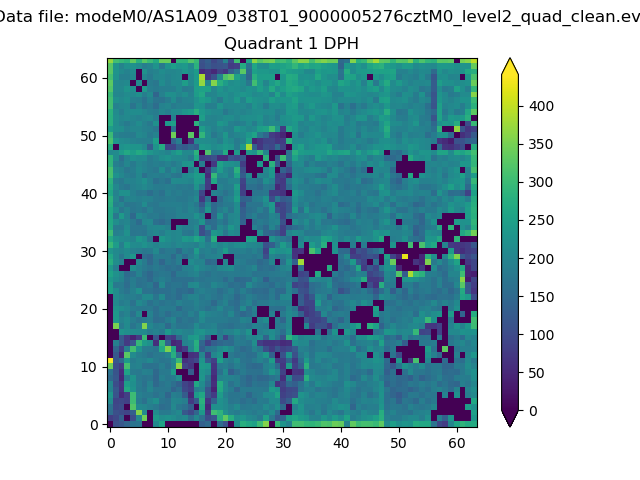 |
Quadrant B |
|---|---|---|---|
| Quadrant D | 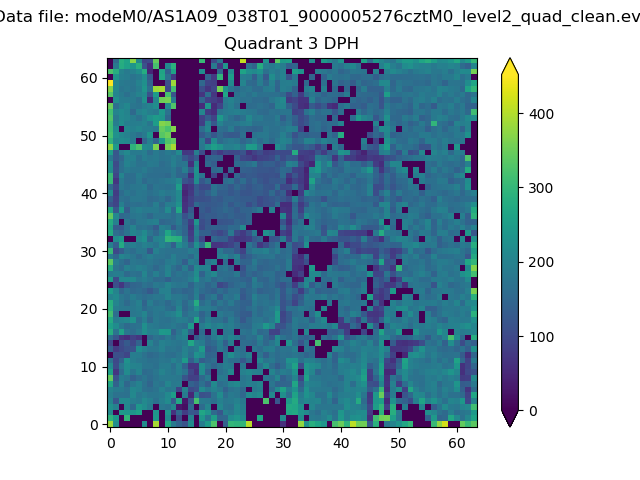 |
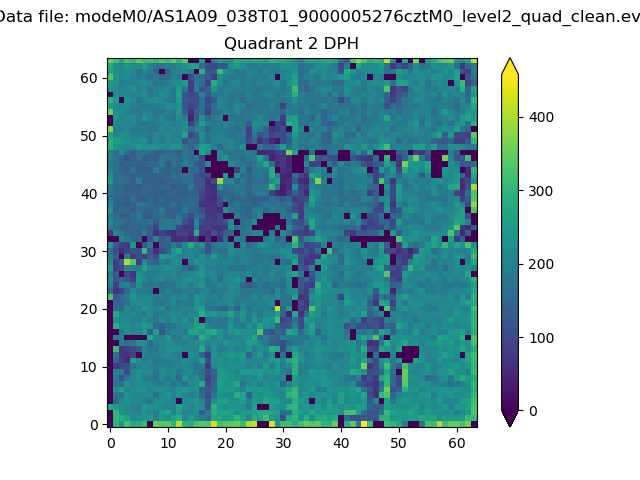 |
Quadrant C |
| Plot type | Count rate plots | Images |
|---|---|---|
| Comparison with Poisson distribution Blue bars denote a histogram of data divided into 1 sec bins. Red curve is a Poisson curve with rate = median count rate of data. |
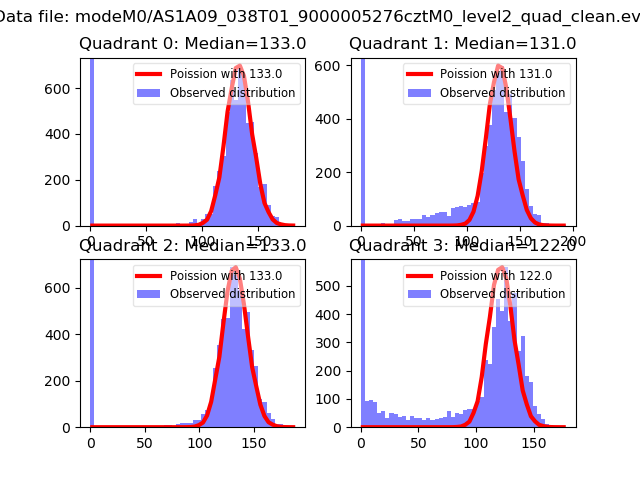 |
 |
| Quadrant-wise count rates Data is divided into 100 sec bins |
 |
|
| Module-wise count rates for Quadrant A Data is divided into 100 sec bins |
 |
 |
| Module-wise count rates for Quadrant B Data is divided into 100 sec bins |
 |
 |
| Module-wise count rates for Quadrant C Data is divided into 100 sec bins |
 |
 |
| Module-wise count rates for Quadrant D Data is divided into 100 sec bins |
 |
 |
| Parameter | Plot |
|---|---|
| CZT HV Monitor |  |
| D_VDD | 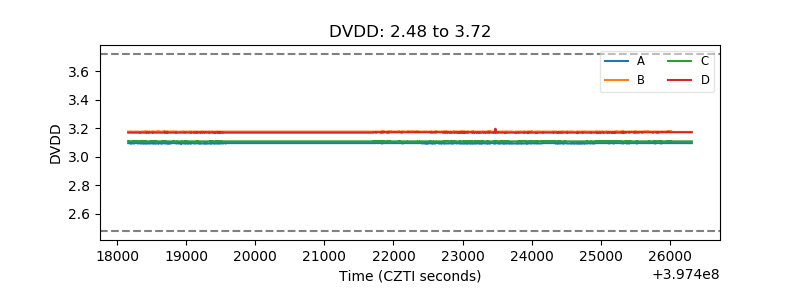 |
| Temperature 1 | 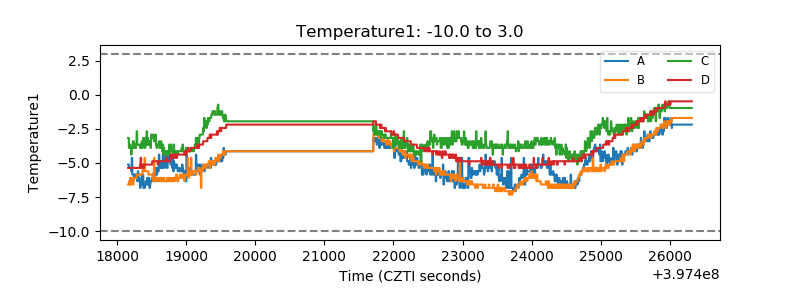 |
| Veto HV Monitor |  |
| Veto LLD | 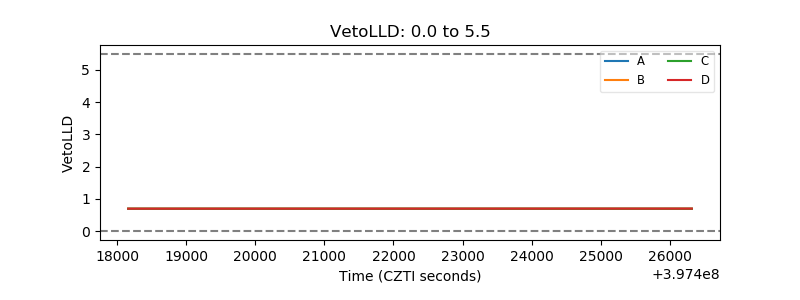 |
| Alpha Counter |  |
| _CPM_Rate | 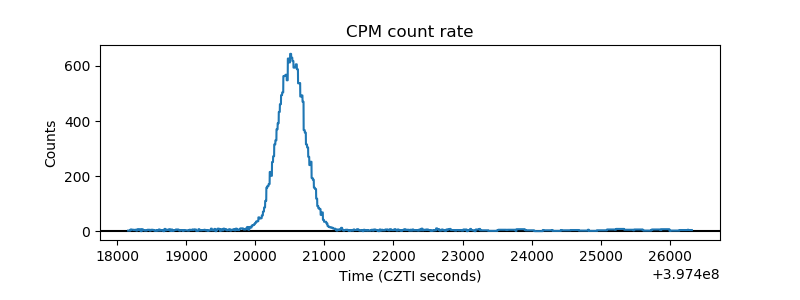 |
| CZT Counter |  |
| +2.5 Volts monitor | 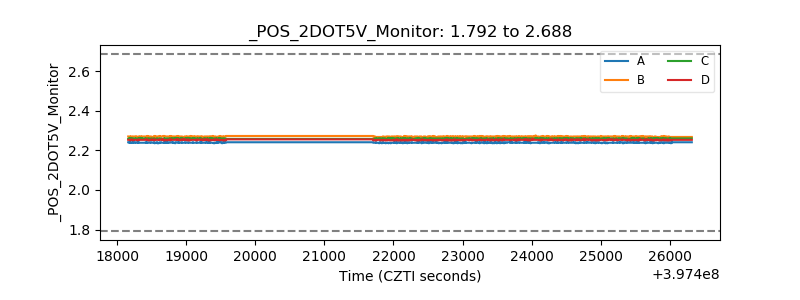 |
| +5 Volts monitor | 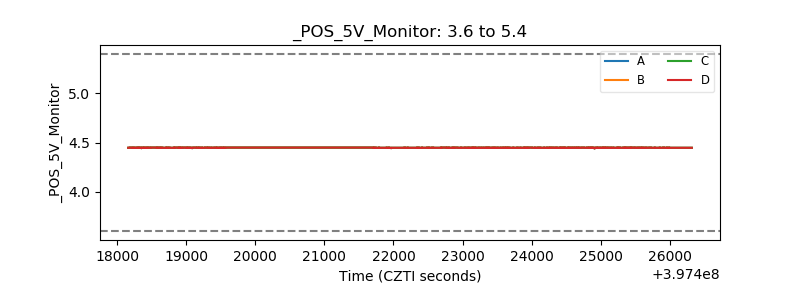 |
| _ROLL_ROT | 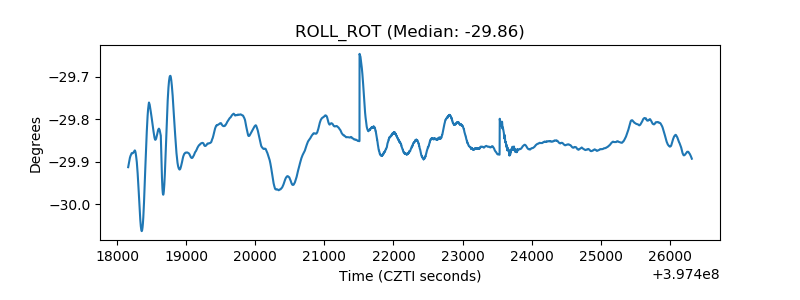 |
| _Roll_DEC | 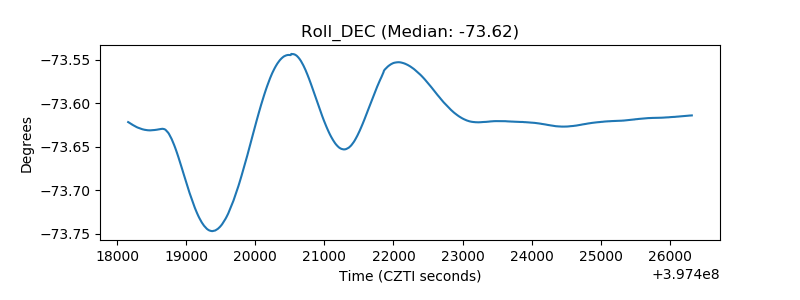 |
| _Roll_RA | 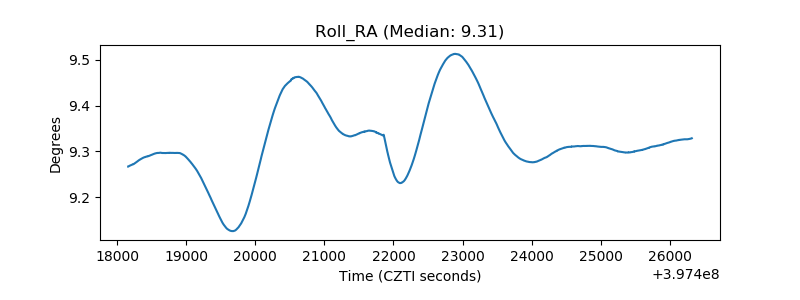 |
| Veto Counter |  |