| Param | Original file | Final file |
|---|---|---|
| Filename | modeM0/AS1A09_038T01_9000005276_37059cztM0_level2.evt | modeM0/AS1A09_038T01_9000005276_37059cztM0_level2_quad_clean.evt |
| Size (bytes) | 236,419,200 | 43,332,480 |
| Size | 225.5 MB | 41.3 MB |
| Events in quadrant A | 1,167,911 | 305,450 |
| Events in quadrant B | 2,276,658 | 272,480 |
| Events in quadrant C | 1,253,337 | 306,217 |
| Events in quadrant D | 2,308,295 | 265,922 |
| Mode M9 | |||
|---|---|---|---|
| Quadrant | BADHDUFLAG | Total packets | Discarded packets |
| A | 0 | 21 | 0 |
| B | 0 | 21 | 0 |
| C | 0 | 21 | 0 |
| D | 0 | 21 | 0 |
| Mode M0 | |||
|---|---|---|---|
| Quadrant | BADHDUFLAG | Total packets | Discarded packets |
| A | 0 | 4777 | 2 |
| B | 0 | 8158 | 1 |
| C | 0 | 4944 | 1 |
| D | 0 | 8331 | 1 |
| Mode SS | |||
|---|---|---|---|
| Quadrant | BADHDUFLAG | Total packets | Discarded packets |
| A | 0 | 46 | 0 |
| B | 0 | 46 | 0 |
| C | 0 | 46 | 0 |
| D | 0 | 46 | 0 |
| Quadrant | Total seconds | Saturated seconds | Saturation percentage |
|---|---|---|---|
| A | 2237 | 5 | 0.223514% |
| B | 2237 | 607 | 27.134555% |
| C | 2237 | 31 | 1.385785% |
| D | 2237 | 392 | 17.523469% |
Noise dominated data is calculated using 1-second bins in cleaned event files. If a bin has >2000 counts, and if more than 50% of those come from <1% of pixels, then it is considered to be noise-dominated and hence unusable.
| Quadrant | # 1 sec bins | Bins with >0 counts | Bins with >2000 counts | High rate bins dominated by noise | Noise dominated (total time) | Noise dominated (detector-on time) | Marked lightcurve |
|---|---|---|---|---|---|---|---|
| A | 4360 | 2238 | 3 | 3 | 0.07% | 0.13% | 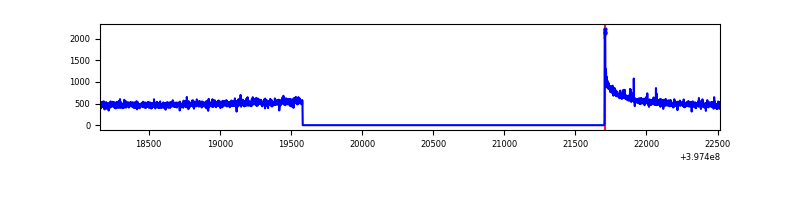 |
| B | 4360 | 2238 | 436 | 436 | 10.00% | 19.48% | 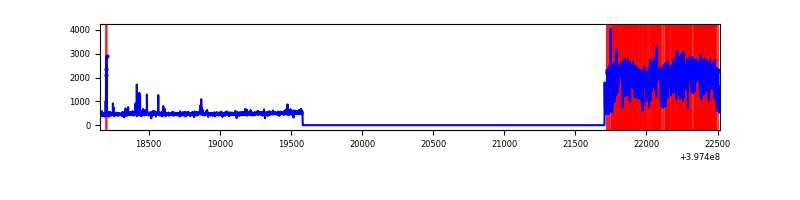 |
| C | 4360 | 2238 | 27 | 27 | 0.62% | 1.21% | 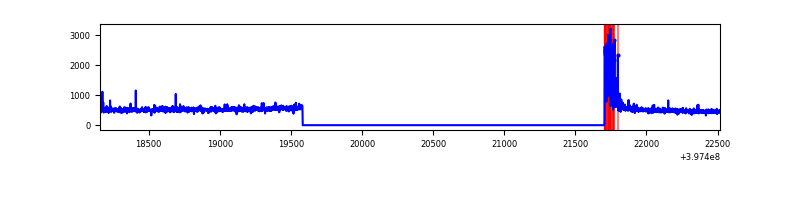 |
| D | 4360 | 2238 | 307 | 307 | 7.04% | 13.72% | 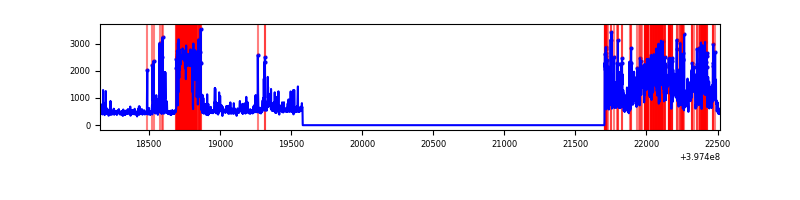 |
Top three noisy pixels from each quadrant. If the there are fewer than three noisy pixels in the level2.evt file, extra rows are filled as -1
| Pixel properties | Quadrant properties | ||||||
|---|---|---|---|---|---|---|---|
| Quadrant | DetID | PixID | Counts | Sigma | Mean | Median | Sigma |
| A | 10 | 83 | 122547 | 2204.7 | 267 | 262 | 55.5 |
| A | 13 | 6 | 3765 | 63.16 | 267 | 262 | 55.5 |
| A | 13 | 254 | 3258 | 54.02 | 267 | 262 | 55.5 |
| B | 5 | 184 | 1124272 | 23730.37 | 238 | 231 | 47.4 |
| B | 5 | 172 | 139521 | 2940.64 | 238 | 231 | 47.4 |
| B | 4 | 141 | 21138 | 441.38 | 238 | 231 | 47.4 |
| C | 0 | 10 | 108738 | 1748.64 | 264 | 266 | 62.0 |
| C | 15 | 214 | 94501 | 1519.13 | 264 | 266 | 62.0 |
| C | 1 | 23 | 5066 | 77.38 | 264 | 266 | 62.0 |
| D | 2 | 250 | 418147 | 6880.78 | 243 | 236 | 60.7 |
| D | 6 | 112 | 377057 | 6204.25 | 243 | 236 | 60.7 |
| D | 12 | 17 | 230566 | 3792.32 | 243 | 236 | 60.7 |
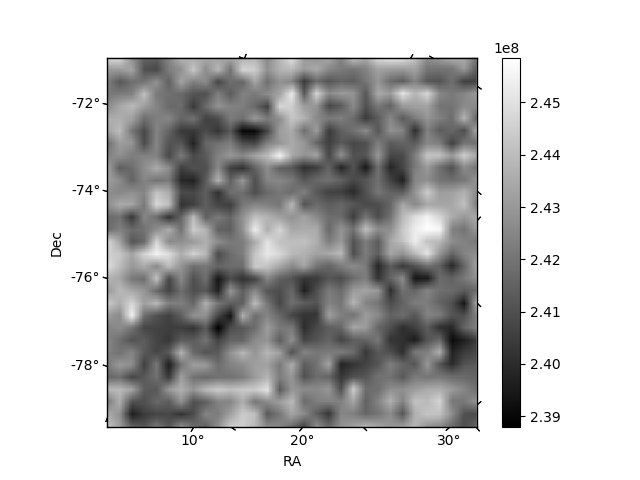
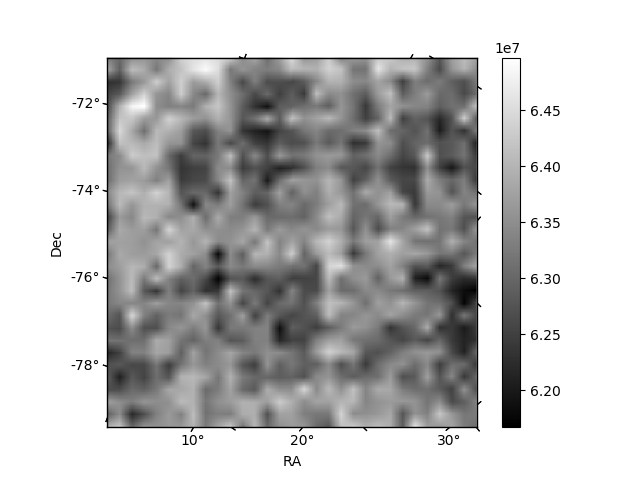
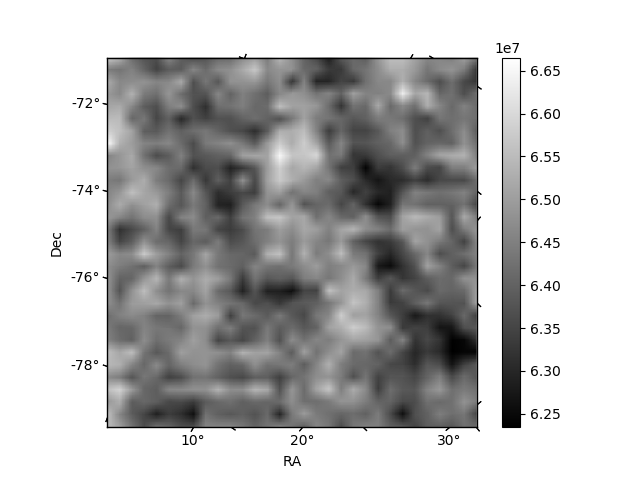
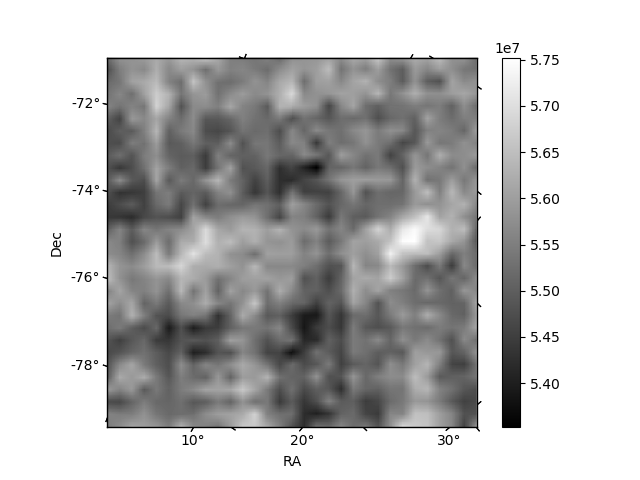
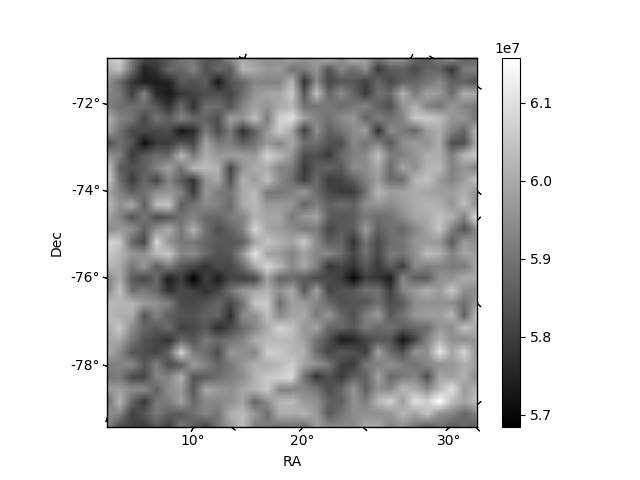
Histogram calculated using DETX and DETY for each event in the final _common_clean file
| Quadrant A | 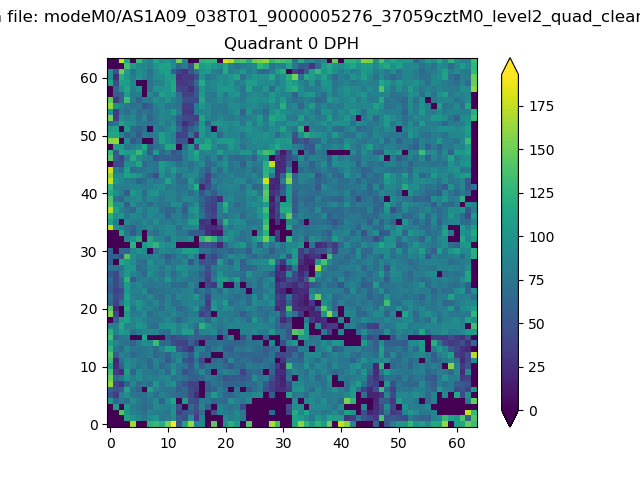 |
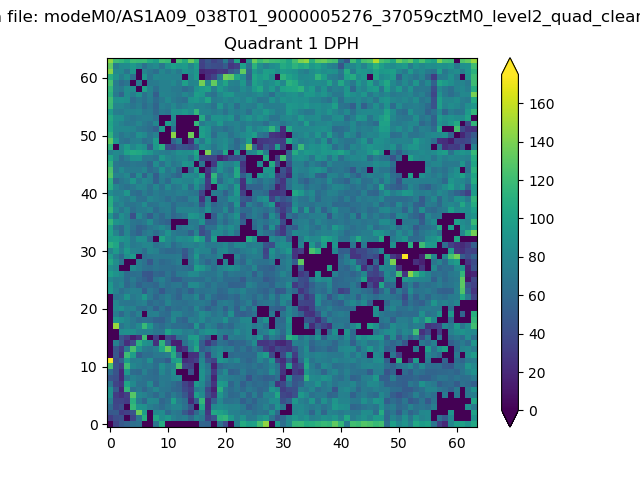 |
Quadrant B |
|---|---|---|---|
| Quadrant D | 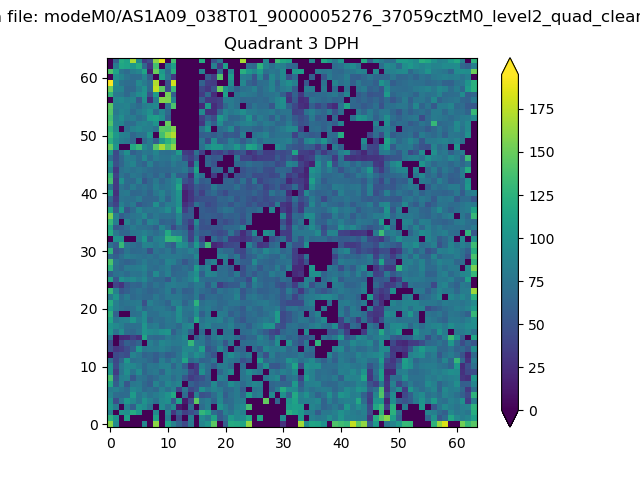 |
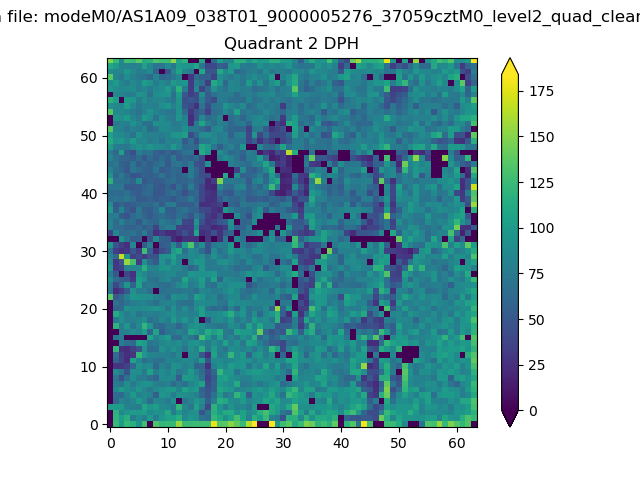 |
Quadrant C |
| Plot type | Count rate plots | Images |
|---|---|---|
| Comparison with Poisson distribution Blue bars denote a histogram of data divided into 1 sec bins. Red curve is a Poisson curve with rate = median count rate of data. |
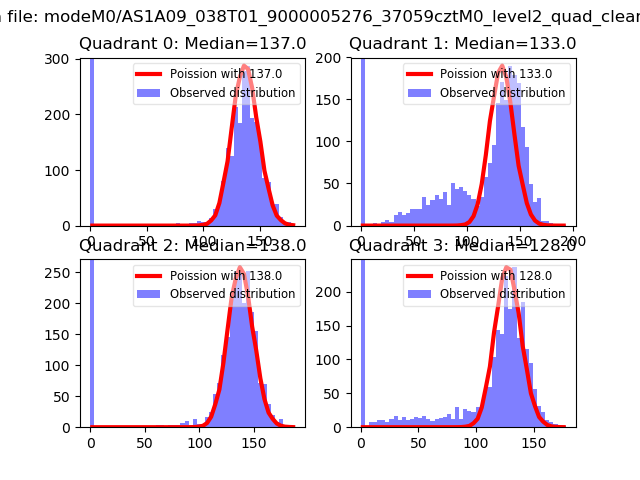 |
 |
| Quadrant-wise count rates Data is divided into 100 sec bins |
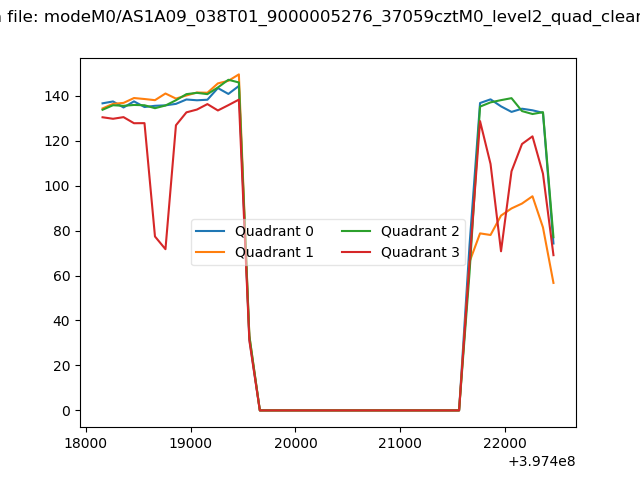 |
|
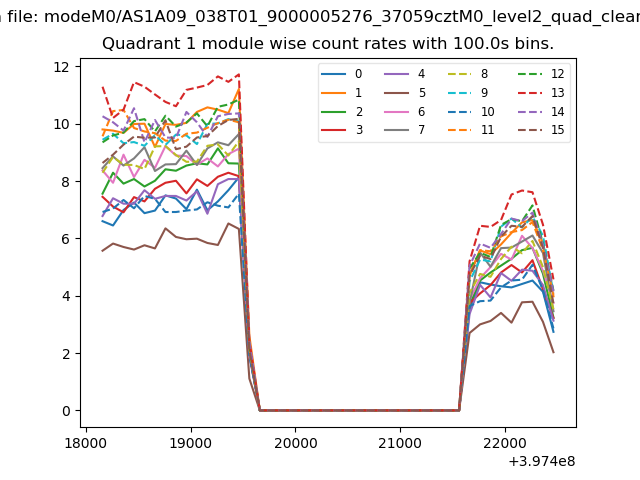
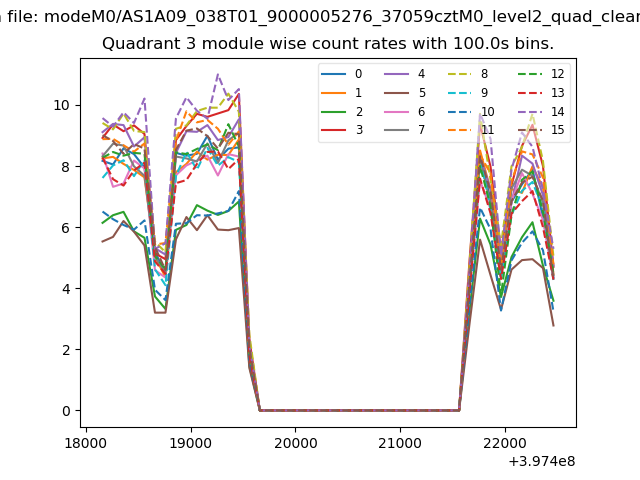
| Module-wise count rates for Quadrant A Data is divided into 100 sec bins |
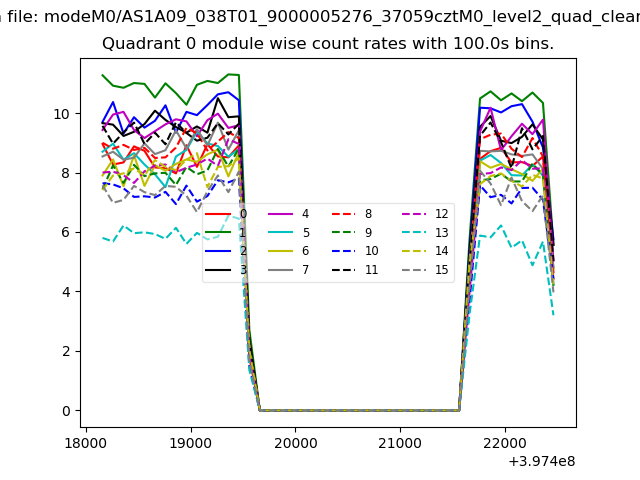 |
 |
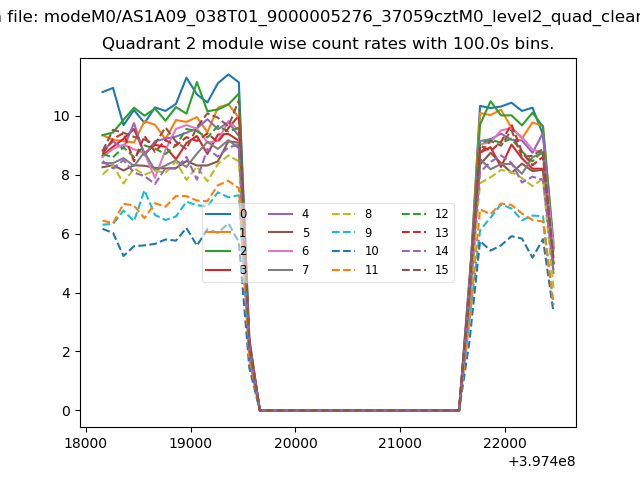
| Module-wise count rates for Quadrant B Data is divided into 100 sec bins |
 |
 |
| Module-wise count rates for Quadrant C Data is divided into 100 sec bins |
 |
 |
| Module-wise count rates for Quadrant D Data is divided into 100 sec bins |
 |
 |
| Parameter | Plot |
|---|---|
| CZT HV Monitor | 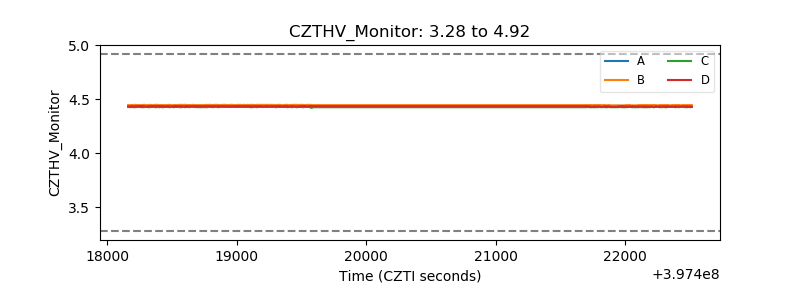 |
| D_VDD | 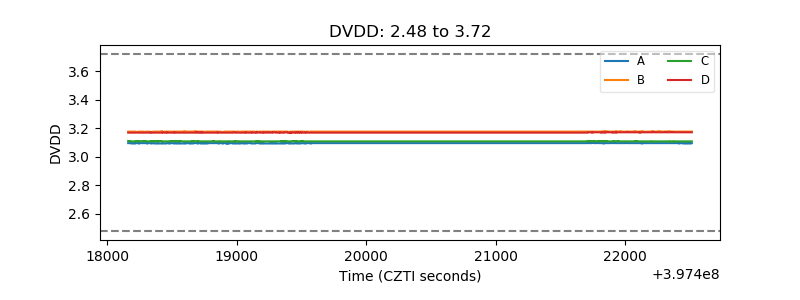 |
| Temperature 1 | 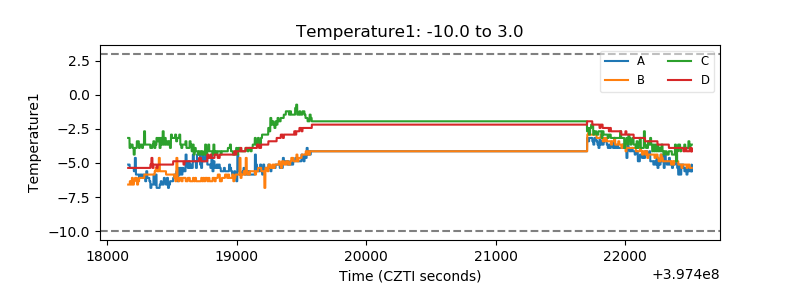 |
| Veto HV Monitor | 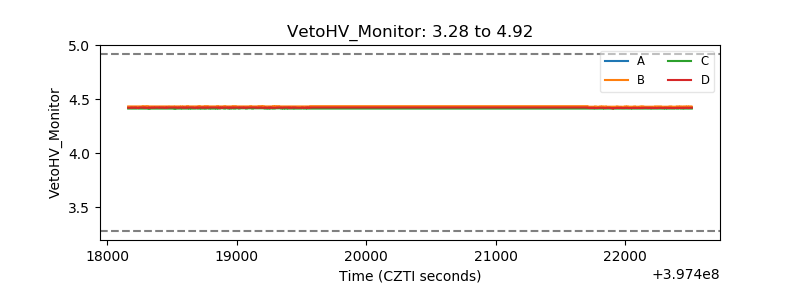 |
| Veto LLD | 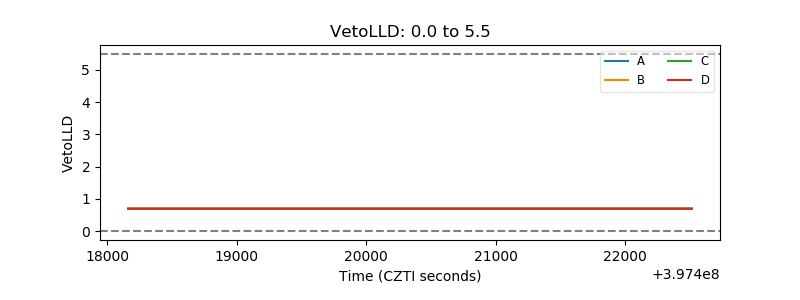 |
| Alpha Counter | 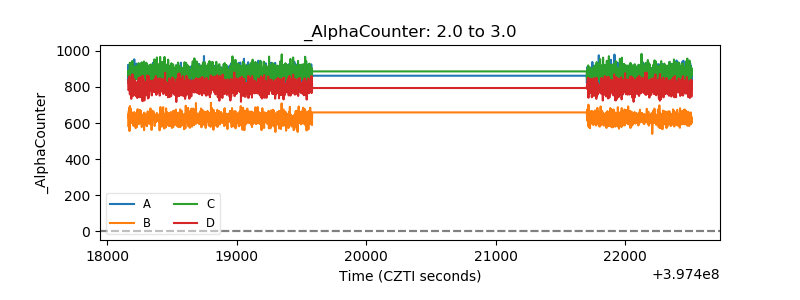 |
| _CPM_Rate | 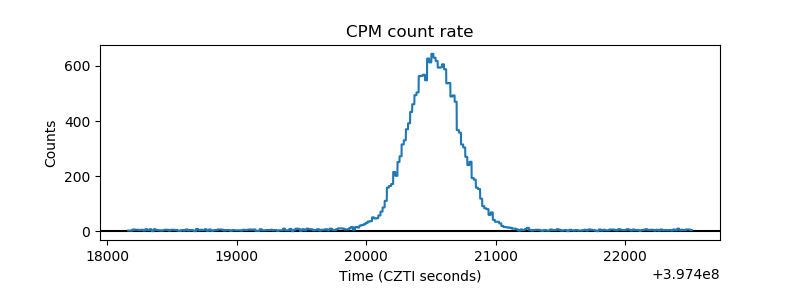 |
| CZT Counter | 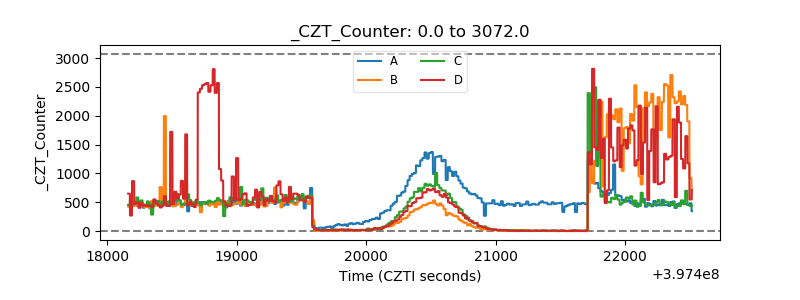 |
| +2.5 Volts monitor | 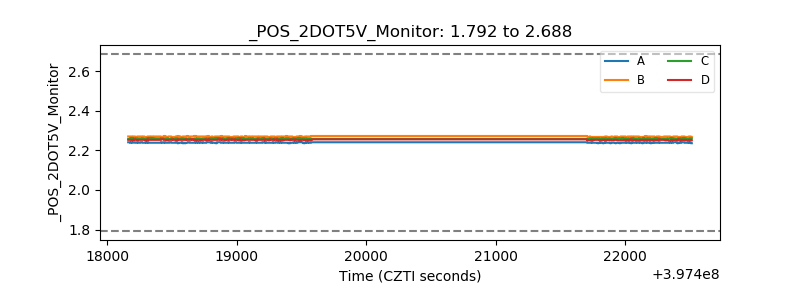 |
| +5 Volts monitor | 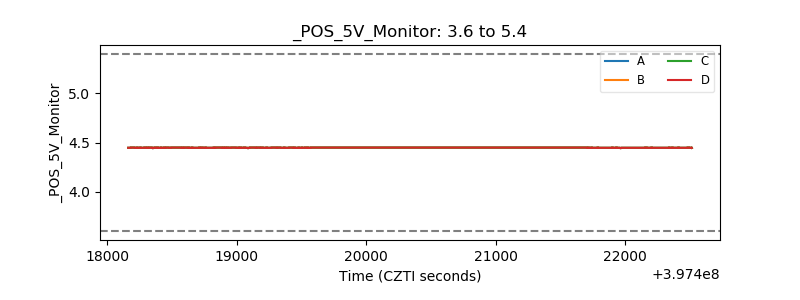 |
| _ROLL_ROT | 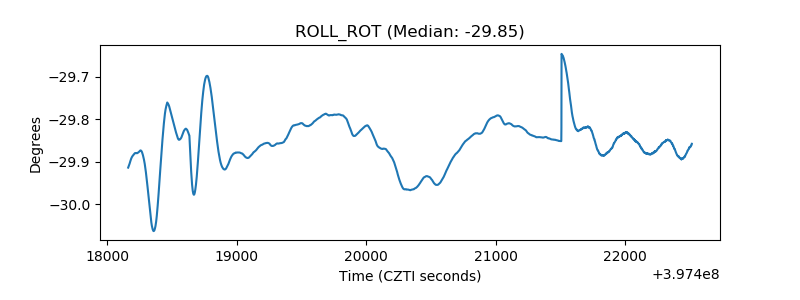 |
| _Roll_DEC | 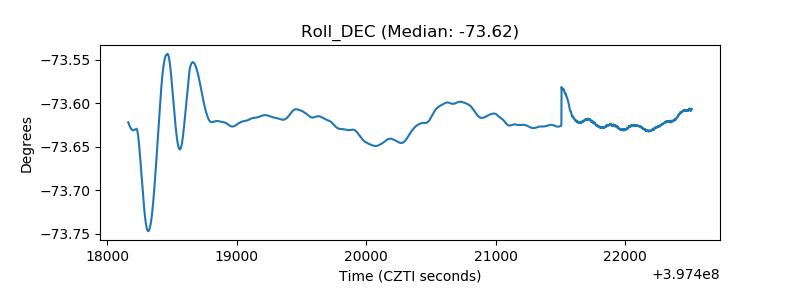 |
| _Roll_RA | 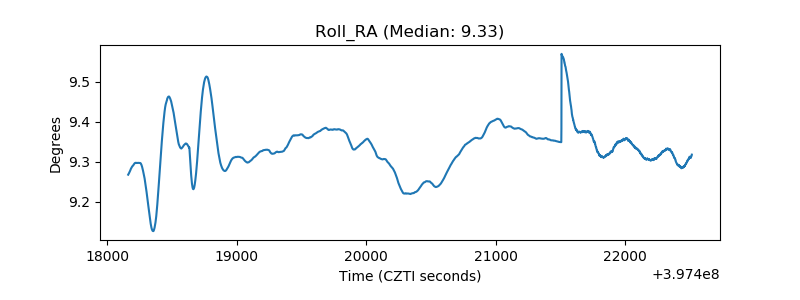 |
| Veto Counter | 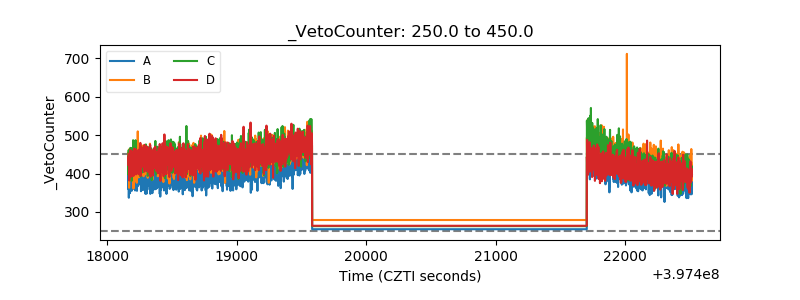 |