| Param | Original file | Final file |
|---|---|---|
| Filename | modeM0/AS1A09_038T01_9000005276_37060cztM0_level2.evt | modeM0/AS1A09_038T01_9000005276_37060cztM0_level2_quad_clean.evt |
| Size (bytes) | 435,349,440 | 79,464,960 |
| Size | 415.2 MB | 75.8 MB |
| Events in quadrant A | 2,089,709 | 566,298 |
| Events in quadrant B | 3,776,354 | 522,706 |
| Events in quadrant C | 2,252,796 | 565,721 |
| Events in quadrant D | 4,770,877 | 446,017 |
| Mode M9 | |||
|---|---|---|---|
| Quadrant | BADHDUFLAG | Total packets | Discarded packets |
| A | 0 | 8 | 0 |
| B | 0 | 8 | 0 |
| C | 0 | 8 | 0 |
| D | 0 | 9 | 0 |
| Mode M0 | |||
|---|---|---|---|
| Quadrant | BADHDUFLAG | Total packets | Discarded packets |
| A | 0 | 8969 | 1 |
| B | 0 | 14114 | 1 |
| C | 0 | 9267 | 1 |
| D | 0 | 17075 | 1 |
| Mode SS | |||
|---|---|---|---|
| Quadrant | BADHDUFLAG | Total packets | Discarded packets |
| A | 0 | 90 | 0 |
| B | 0 | 90 | 0 |
| C | 0 | 90 | 0 |
| D | 0 | 90 | 0 |
| Quadrant | Total seconds | Saturated seconds | Saturation percentage |
|---|---|---|---|
| A | 4327 | 5 | 0.115554% |
| B | 4327 | 760 | 17.564132% |
| C | 4327 | 47 | 1.086203% |
| D | 4327 | 1142 | 26.392420% |
Noise dominated data is calculated using 1-second bins in cleaned event files. If a bin has >2000 counts, and if more than 50% of those come from <1% of pixels, then it is considered to be noise-dominated and hence unusable.
| Quadrant | # 1 sec bins | Bins with >0 counts | Bins with >2000 counts | High rate bins dominated by noise | Noise dominated (total time) | Noise dominated (detector-on time) | Marked lightcurve |
|---|---|---|---|---|---|---|---|
| A | 4327 | 4327 | 3 | 3 | 0.07% | 0.07% | 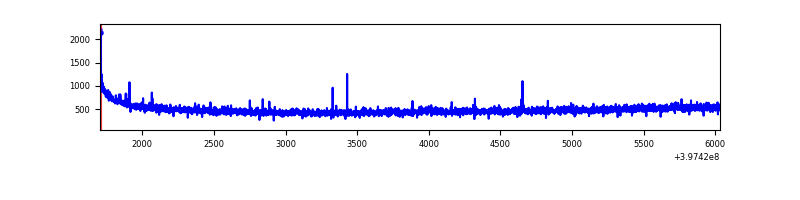 |
| B | 4327 | 4327 | 548 | 548 | 12.66% | 12.66% | 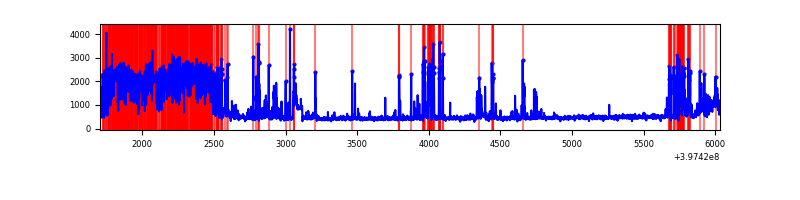 |
| C | 4327 | 4327 | 41 | 41 | 0.95% | 0.95% | 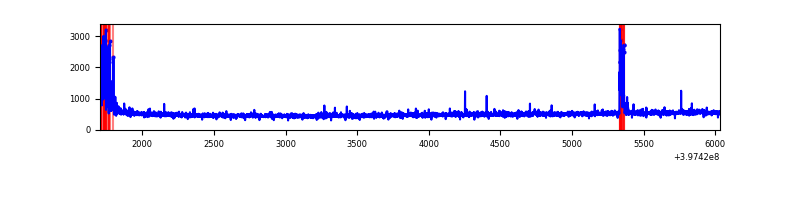 |
| D | 4327 | 4327 | 718 | 718 | 16.59% | 16.59% | 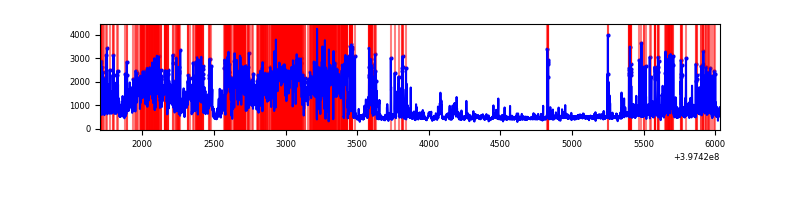 |
Top three noisy pixels from each quadrant. If the there are fewer than three noisy pixels in the level2.evt file, extra rows are filled as -1
| Pixel properties | Quadrant properties | ||||||
|---|---|---|---|---|---|---|---|
| Quadrant | DetID | PixID | Counts | Sigma | Mean | Median | Sigma |
| A | 10 | 83 | 175724 | 1771.29 | 490 | 481 | 98.9 |
| A | 9 | 143 | 6736 | 63.22 | 490 | 481 | 98.9 |
| A | 13 | 254 | 6179 | 57.59 | 490 | 481 | 98.9 |
| B | 5 | 184 | 1224761 | 14238.63 | 455 | 444 | 86.0 |
| B | 5 | 172 | 495955 | 5762.72 | 455 | 444 | 86.0 |
| B | 5 | 200 | 79979 | 924.98 | 455 | 444 | 86.0 |
| C | 15 | 214 | 179356 | 1614.57 | 483 | 488 | 110.8 |
| C | 0 | 10 | 114483 | 1028.99 | 483 | 488 | 110.8 |
| C | 10 | 20 | 54171 | 484.58 | 483 | 488 | 110.8 |
| D | 12 | 17 | 1851254 | 18303.43 | 412 | 399 | 101.1 |
| D | 6 | 112 | 502697 | 4967.31 | 412 | 399 | 101.1 |
| D | 1 | 52 | 336555 | 3324.31 | 412 | 399 | 101.1 |
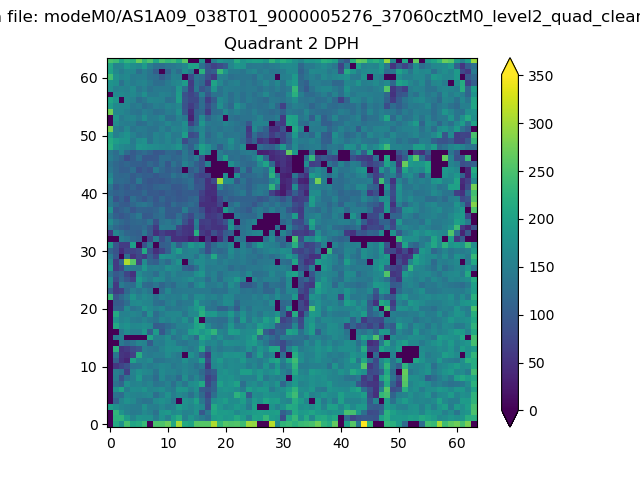
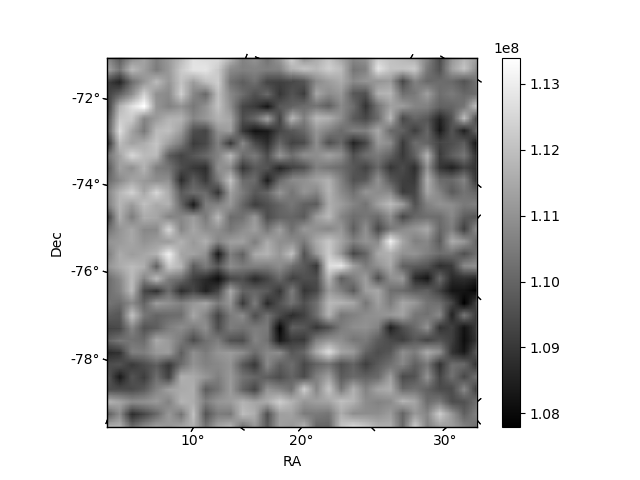
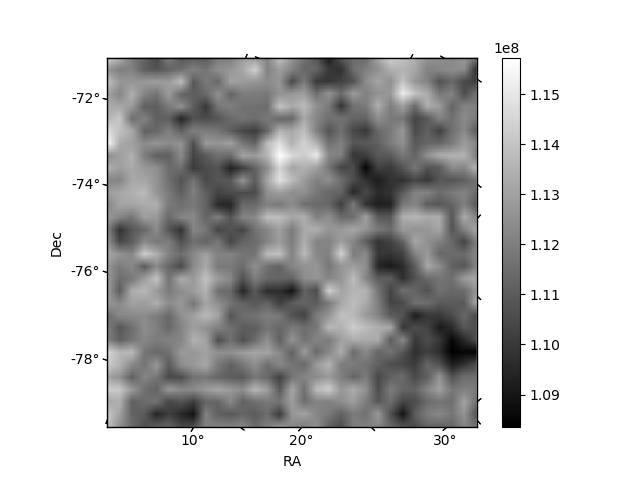
Histogram calculated using DETX and DETY for each event in the final _common_clean file
| Quadrant A | 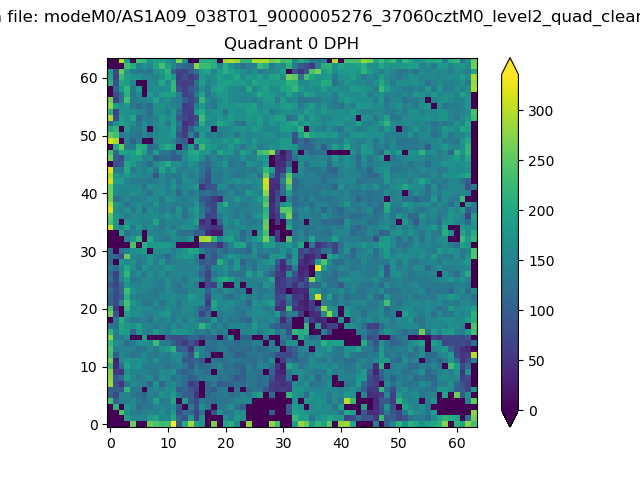 |
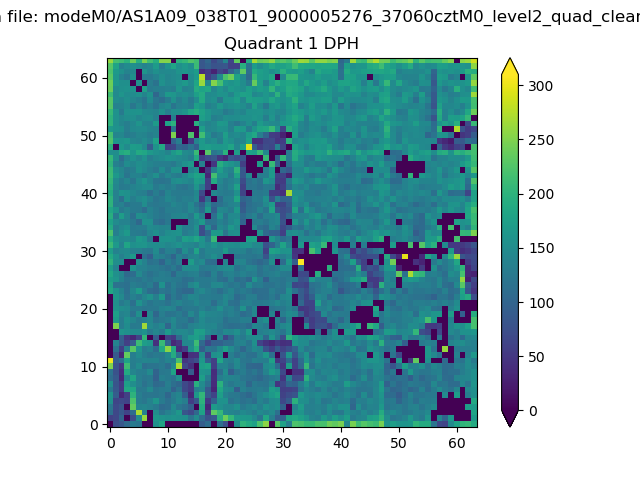 |
Quadrant B |
|---|---|---|---|
| Quadrant D | 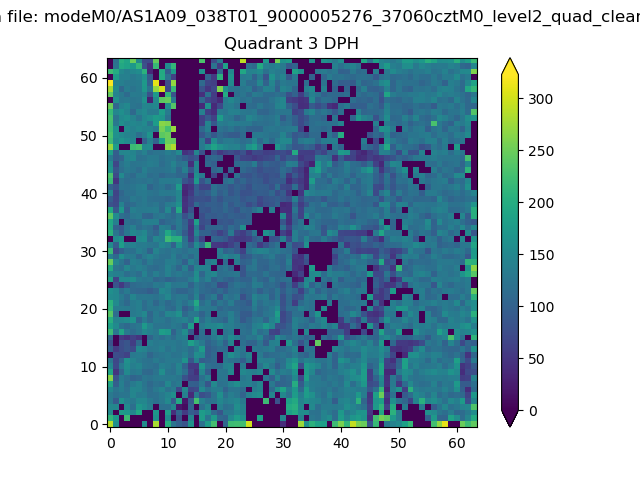 |
 |
Quadrant C |
| Plot type | Count rate plots | Images |
|---|---|---|
| Comparison with Poisson distribution Blue bars denote a histogram of data divided into 1 sec bins. Red curve is a Poisson curve with rate = median count rate of data. |
 |
 |
| Quadrant-wise count rates Data is divided into 100 sec bins |
 |
|
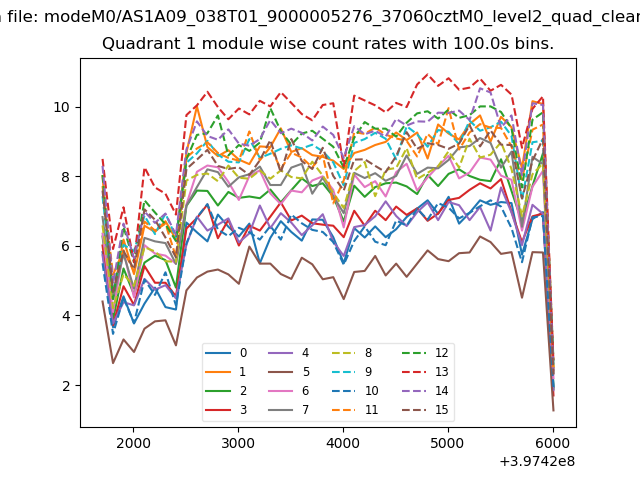
| Module-wise count rates for Quadrant A Data is divided into 100 sec bins |
 |
 |
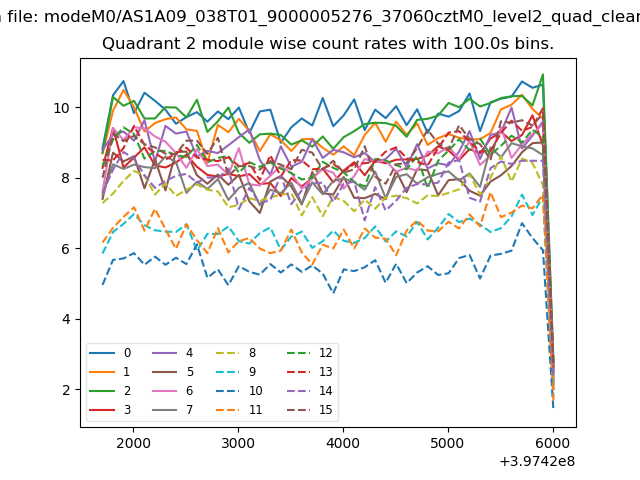
| Module-wise count rates for Quadrant B Data is divided into 100 sec bins |
 |
 |
| Module-wise count rates for Quadrant C Data is divided into 100 sec bins |
 |
 |
| Module-wise count rates for Quadrant D Data is divided into 100 sec bins |
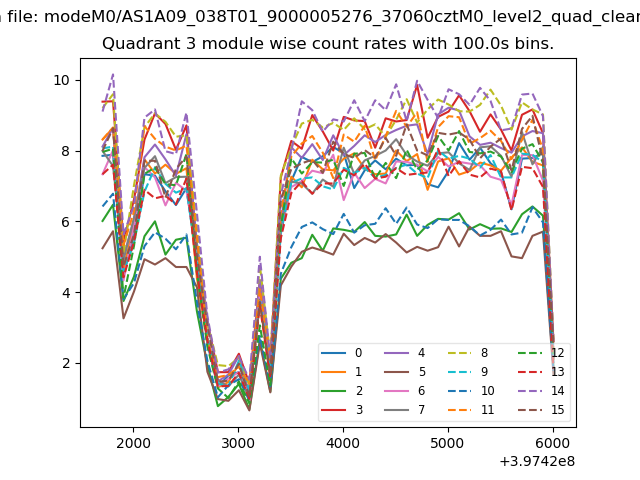 |
 |
| Parameter | Plot |
|---|---|
| CZT HV Monitor | 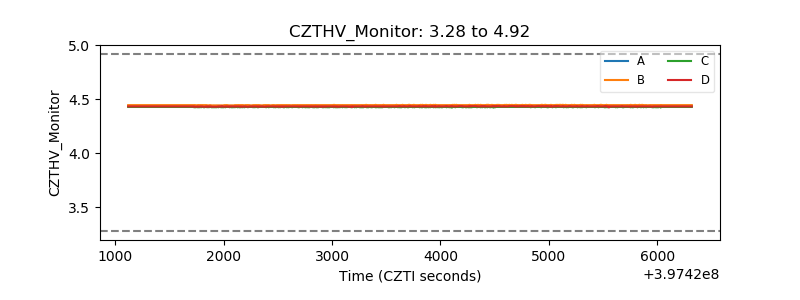 |
| D_VDD | 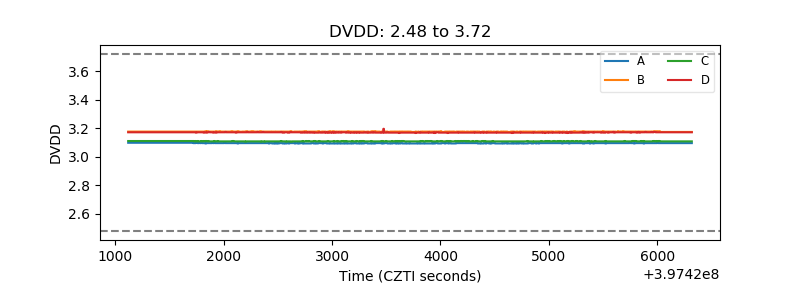 |
| Temperature 1 | 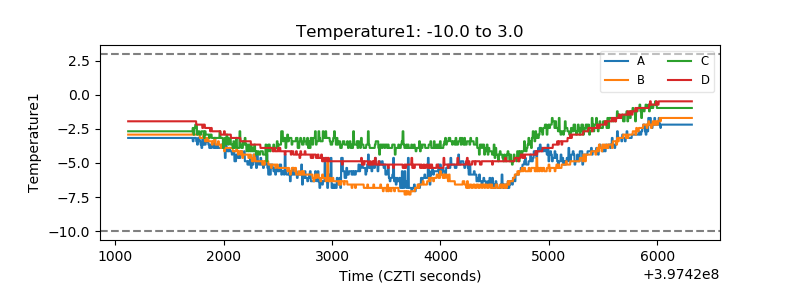 |
| Veto HV Monitor | 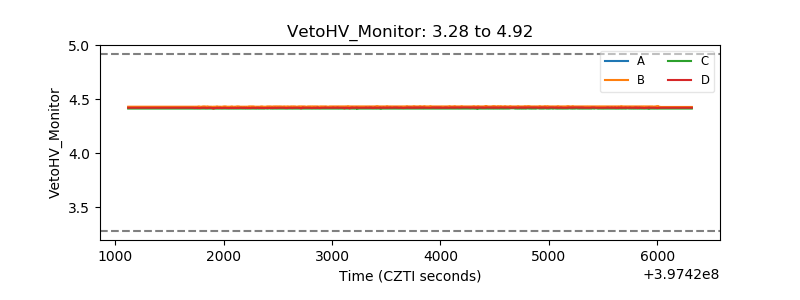 |
| Veto LLD | 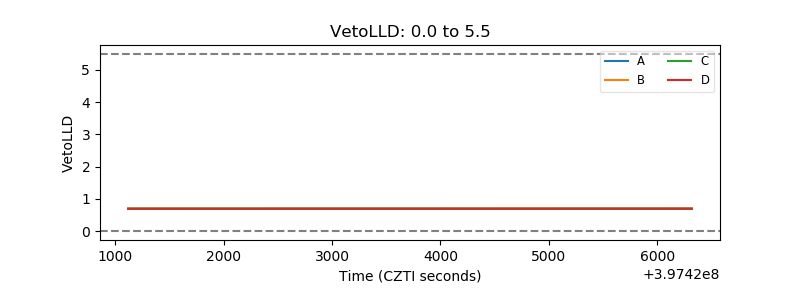 |
| Alpha Counter | 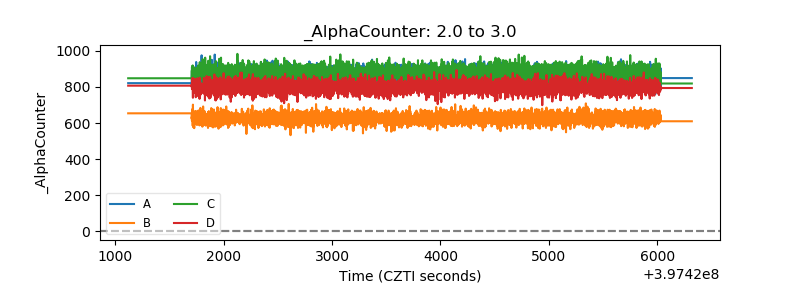 |
| _CPM_Rate | 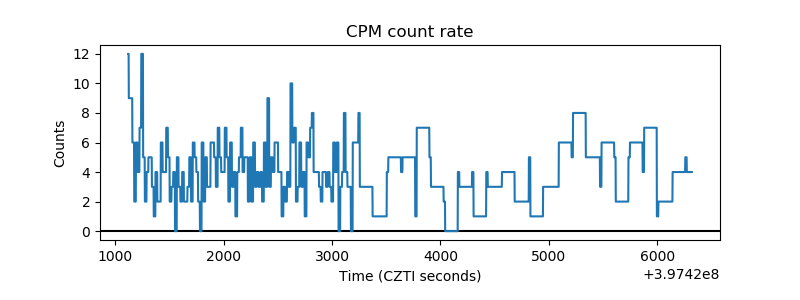 |
| CZT Counter | 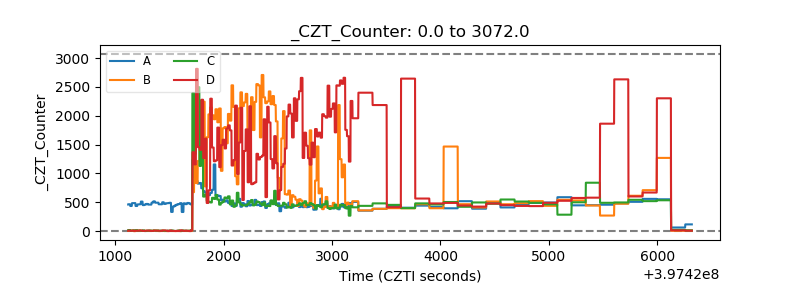 |
| +2.5 Volts monitor |  |
| +5 Volts monitor | 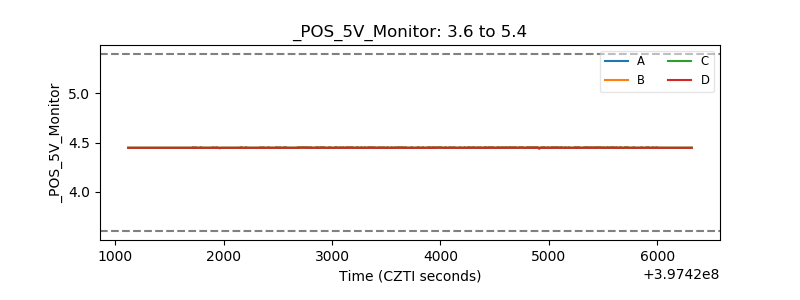 |
| _ROLL_ROT | 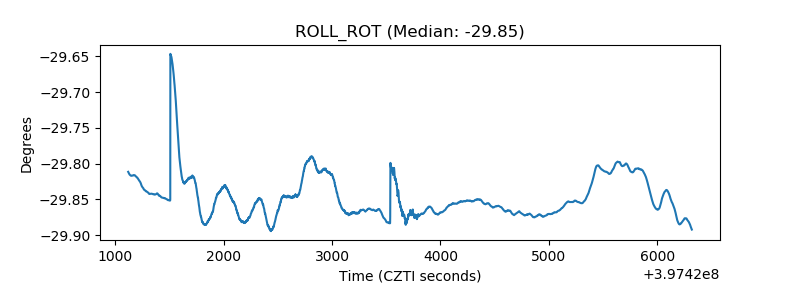 |
| _Roll_DEC | 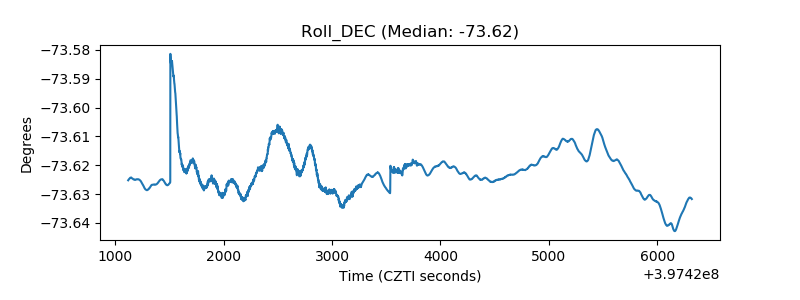 |
| _Roll_RA | 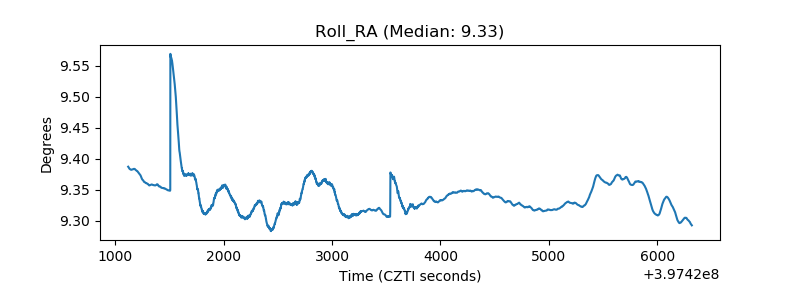 |
| Veto Counter | 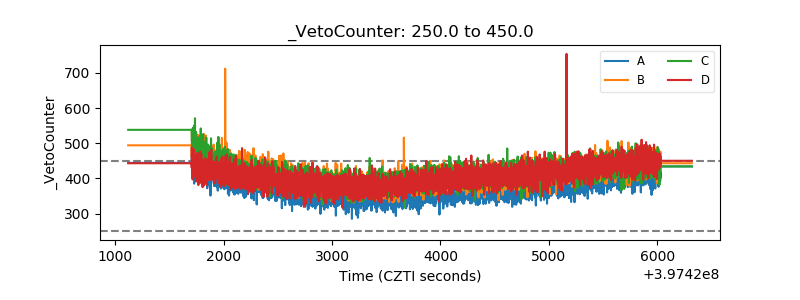 |