| Param | Original file | Final file |
|---|---|---|
| Filename | modeM0/AS1A09_026T03_9000005280cztM0_level2.fits | modeM0/AS1A09_026T03_9000005280cztM0_level2_quad_clean.evt |
| Size (bytes) | 112,714,560 | 115,773,120 |
| Size | 107.5 MB | 110.4 MB |
| Events in quadrant A | 702,678 | 773,595 |
| Events in quadrant B | 644,714 | 700,758 |
| Events in quadrant C | 685,536 | 715,994 |
| Events in quadrant D | 490,832 | 426,864 |
| Mode M9 | |||
|---|---|---|---|
| Quadrant | BADHDUFLAG | Total packets | Discarded packets |
| A | 0 | 39 | 0 |
| B | 0 | 39 | 0 |
| C | 0 | 39 | 0 |
| D | 0 | 39 | 0 |
| Mode SS | |||
|---|---|---|---|
| Quadrant | BADHDUFLAG | Total packets | Discarded packets |
| A | 0 | 262 | 0 |
| B | 0 | 262 | 0 |
| C | 0 | 262 | 0 |
| D | 0 | 262 | 0 |
| Mode M0 | |||
|---|---|---|---|
| Quadrant | BADHDUFLAG | Total packets | Discarded packets |
| A | 0 | 26992 | 0 |
| B | 0 | 38228 | 0 |
| C | 0 | 28683 | 0 |
| D | 0 | 55380 | 0 |
| Quadrant | Total seconds | Saturated seconds | Saturation percentage |
|---|---|---|---|
| A | 12846 | 41 | 0.319165% |
| B | 12846 | 1044 | 8.127043% |
| C | 12846 | 166 | 1.292231% |
| D | 12846 | 3135 | 24.404484% |
Noise dominated data is calculated using 1-second bins in cleaned event files. If a bin has >2000 counts, and if more than 50% of those come from <1% of pixels, then it is considered to be noise-dominated and hence unusable.
| Quadrant | # 1 sec bins | Bins with >0 counts | Bins with >2000 counts | High rate bins dominated by noise | Noise dominated (total time) | Noise dominated (detector-on time) | Marked lightcurve |
|---|---|---|---|---|---|---|---|
| A | 15801 | 12845 | 0 | 0 | 0.00% | 0.00% |  |
| B | 15801 | 12843 | 0 | 0 | 0.00% | 0.00% |  |
| C | 15801 | 12840 | 0 | 0 | 0.00% | 0.00% |  |
| D | 15801 | 12678 | 0 | 0 | 0.00% | 0.00% |  |
Top three noisy pixels from each quadrant. If the there are fewer than three noisy pixels in the level2.evt file, extra rows are filled as -1
| Pixel properties | Quadrant properties | ||||||
|---|---|---|---|---|---|---|---|
| Quadrant | DetID | PixID | Counts | Sigma | Mean | Median | Sigma |
| A | 9 | 19 | 606 | 9.07 | 183 | 172 | 47.8 |
| A | 7 | 110 | 595 | 8.84 | 183 | 172 | 47.8 |
| A | 0 | 29 | 524 | 7.36 | 183 | 172 | 47.8 |
| B | 2 | 9 | 595 | 12.3 | 171 | 163 | 35.1 |
| B | 3 | 80 | 518 | 10.11 | 171 | 163 | 35.1 |
| B | 5 | 128 | 461 | 8.49 | 171 | 163 | 35.1 |
| C | 3 | 203 | 544 | 7.75 | 181 | 170 | 48.2 |
| C | 3 | 202 | 536 | 7.59 | 181 | 170 | 48.2 |
| C | 3 | 234 | 511 | 7.07 | 181 | 170 | 48.2 |
| D | 7 | 3 | 364 | 6.05 | 140 | 128 | 39.0 |
| D | 10 | 113 | 361 | 5.97 | 140 | 128 | 39.0 |
| D | 4 | 160 | 356 | 5.84 | 140 | 128 | 39.0 |
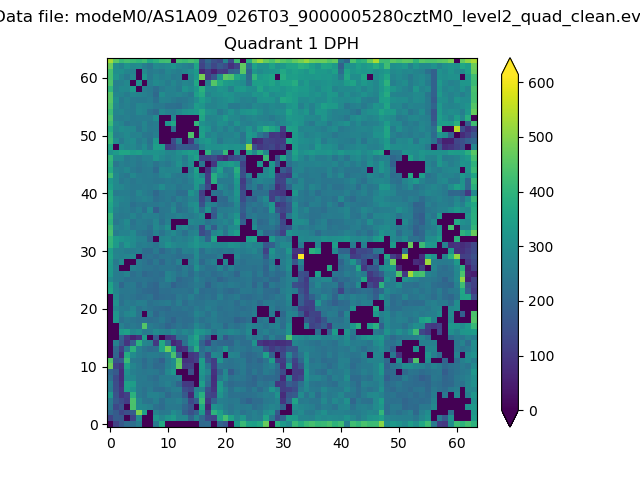
Histogram calculated using DETX and DETY for each event in the final _common_clean file
| Quadrant A |  |
 |
Quadrant B |
|---|---|---|---|
| Quadrant D |  |
 |
Quadrant C |
| Plot type | Count rate plots | Images |
|---|---|---|
| Comparison with Poisson distribution Blue bars denote a histogram of data divided into 1 sec bins. Red curve is a Poisson curve with rate = median count rate of data. |
 |
 |
| Quadrant-wise count rates Data is divided into 100 sec bins |
 |
|
| Module-wise count rates for Quadrant A Data is divided into 100 sec bins |
 |
 |
| Module-wise count rates for Quadrant B Data is divided into 100 sec bins |
 |
 |
| Module-wise count rates for Quadrant C Data is divided into 100 sec bins |
 |
 |
| Module-wise count rates for Quadrant D Data is divided into 100 sec bins |
 |
 |
| Parameter | Plot |
|---|---|
| CZT HV Monitor |  |
| D_VDD |  |
| Temperature 1 |  |
| Veto HV Monitor |  |
| Veto LLD |  |
| Alpha Counter |  |
| _CPM_Rate |  |
| CZT Counter |  |
| +2.5 Volts monitor |  |
| +5 Volts monitor |  |
| _ROLL_ROT |  |
| _Roll_DEC |  |
| _Roll_RA |  |
| Veto Counter |  |