| Param | Original file | Final file |
|---|---|---|
| Filename | modeM0/AS1A09_026T03_9000005280_37065cztM0_level2.evt | modeM0/AS1A09_026T03_9000005280_37065cztM0_level2_quad_clean.evt |
| Size (bytes) | 496,857,600 | 61,781,760 |
| Size | 473.8 MB | 58.9 MB |
| Events in quadrant A | 2,996,961 | 379,991 |
| Events in quadrant B | 3,724,680 | 368,263 |
| Events in quadrant C | 3,150,899 | 369,709 |
| Events in quadrant D | 4,779,309 | 344,581 |
| Mode M9 | |||
|---|---|---|---|
| Quadrant | BADHDUFLAG | Total packets | Discarded packets |
| A | 0 | 24 | 0 |
| B | 0 | 24 | 0 |
| C | 0 | 24 | 0 |
| D | 0 | 24 | 0 |
| Mode SS | |||
|---|---|---|---|
| Quadrant | BADHDUFLAG | Total packets | Discarded packets |
| A | 0 | 118 | 0 |
| B | 0 | 118 | 0 |
| C | 0 | 118 | 0 |
| D | 0 | 118 | 0 |
| Mode M0 | |||
|---|---|---|---|
| Quadrant | BADHDUFLAG | Total packets | Discarded packets |
| A | 0 | 12407 | 3 |
| B | 0 | 14856 | 2 |
| C | 0 | 12779 | 2 |
| D | 0 | 18392 | 2 |
| Quadrant | Total seconds | Saturated seconds | Saturation percentage |
|---|---|---|---|
| A | 5836 | 14 | 0.239890% |
| B | 5836 | 276 | 4.729267% |
| C | 5836 | 45 | 0.771076% |
| D | 5836 | 269 | 4.609321% |
Noise dominated data is calculated using 1-second bins in cleaned event files. If a bin has >2000 counts, and if more than 50% of those come from <1% of pixels, then it is considered to be noise-dominated and hence unusable.
| Quadrant | # 1 sec bins | Bins with >0 counts | Bins with >2000 counts | High rate bins dominated by noise | Noise dominated (total time) | Noise dominated (detector-on time) | Marked lightcurve |
|---|---|---|---|---|---|---|---|
| A | 7269 | 5837 | 10 | 10 | 0.14% | 0.17% | 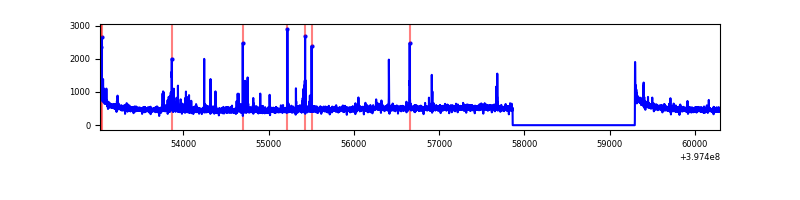 |
| B | 7269 | 5836 | 205 | 205 | 2.82% | 3.51% | 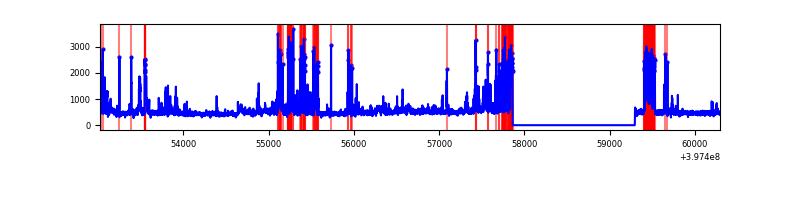 |
| C | 7269 | 5837 | 38 | 38 | 0.52% | 0.65% | 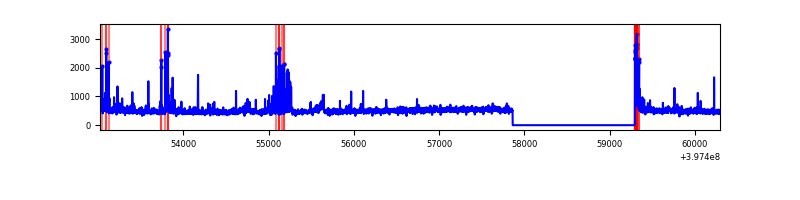 |
| D | 7269 | 5837 | 246 | 246 | 3.38% | 4.21% | 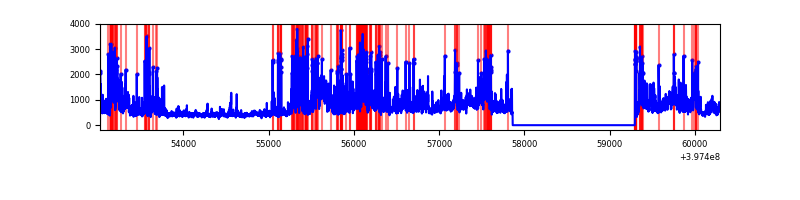 |
Top three noisy pixels from each quadrant. If the there are fewer than three noisy pixels in the level2.evt file, extra rows are filled as -1
| Pixel properties | Quadrant properties | ||||||
|---|---|---|---|---|---|---|---|
| Quadrant | DetID | PixID | Counts | Sigma | Mean | Median | Sigma |
| A | 10 | 83 | 278592 | 2056.38 | 666 | 650 | 135.2 |
| A | 9 | 143 | 102733 | 755.27 | 666 | 650 | 135.2 |
| A | 7 | 3 | 18037 | 128.64 | 666 | 650 | 135.2 |
| B | 5 | 184 | 633951 | 5053.35 | 651 | 633 | 125.3 |
| B | 5 | 172 | 222690 | 1771.83 | 651 | 633 | 125.3 |
| B | 0 | 229 | 188388 | 1498.13 | 651 | 633 | 125.3 |
| C | 15 | 214 | 253046 | 1668.66 | 646 | 651 | 151.3 |
| C | 14 | 254 | 156934 | 1033.23 | 646 | 651 | 151.3 |
| C | 0 | 10 | 120529 | 792.55 | 646 | 651 | 151.3 |
| D | 12 | 235 | 497140 | 3165.51 | 636 | 616 | 156.9 |
| D | 1 | 47 | 456748 | 2907.99 | 636 | 616 | 156.9 |
| D | 6 | 112 | 419794 | 2672.4 | 636 | 616 | 156.9 |
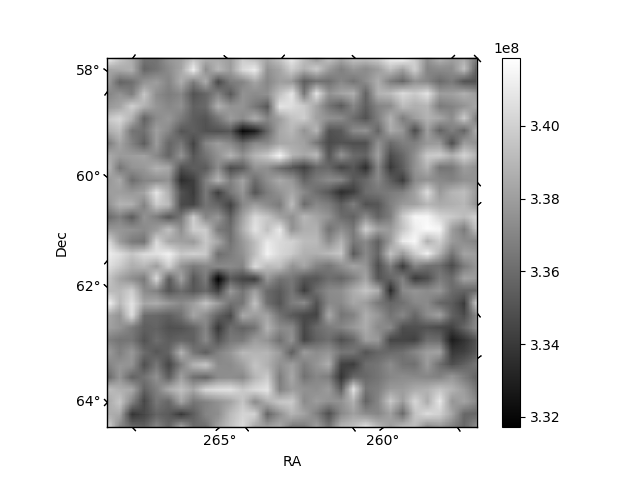
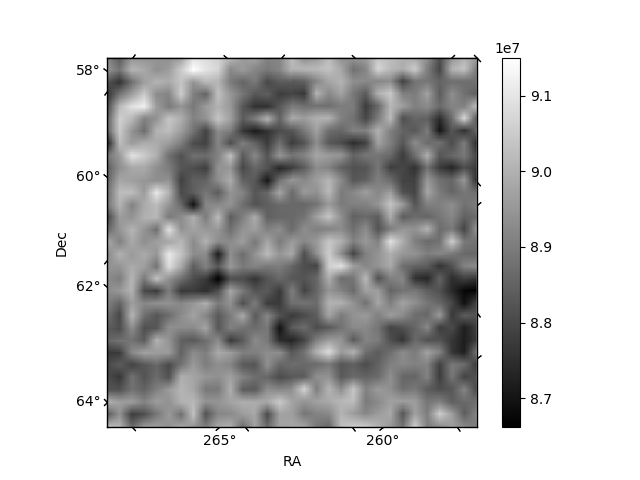
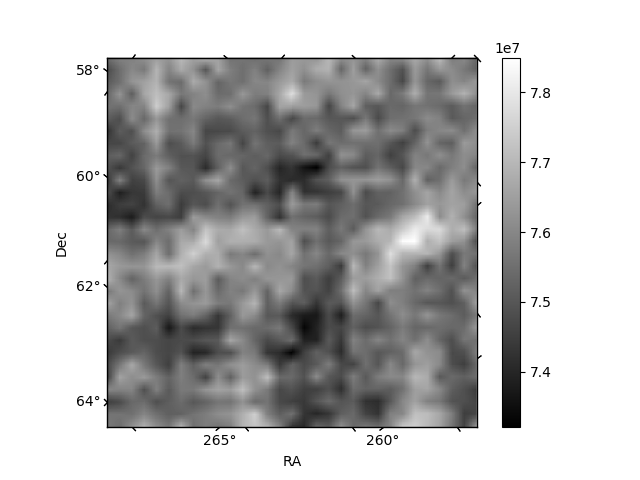
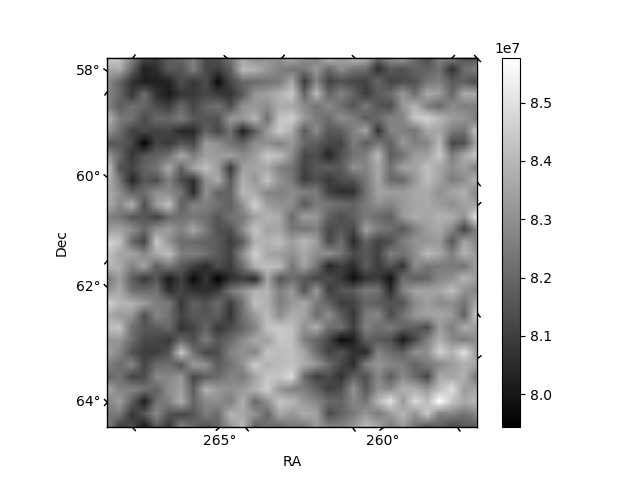
Histogram calculated using DETX and DETY for each event in the final _common_clean file
| Quadrant A | 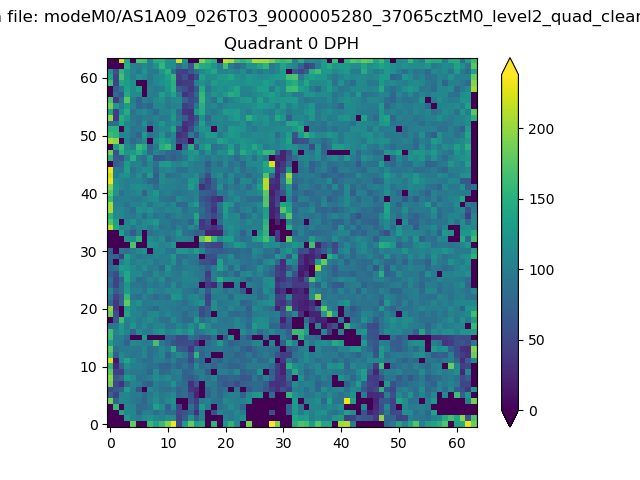 |
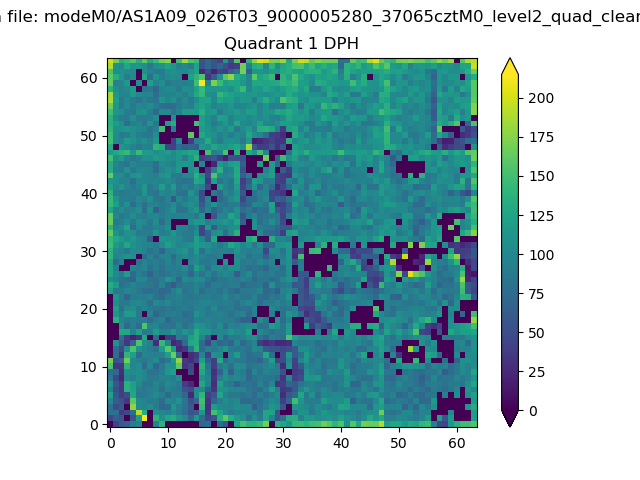 |
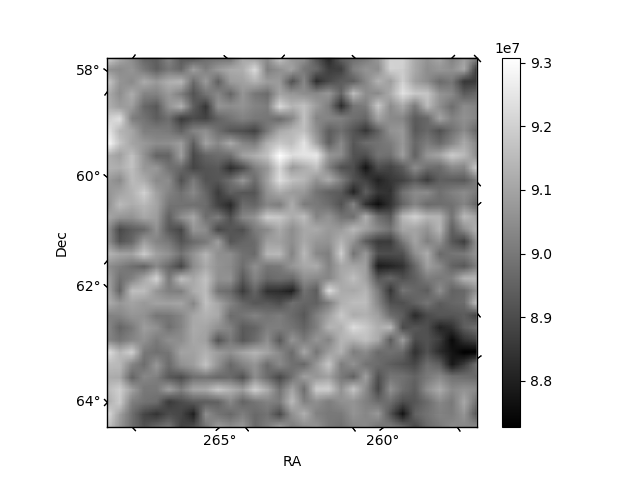
Quadrant B |
|---|---|---|---|
| Quadrant D | 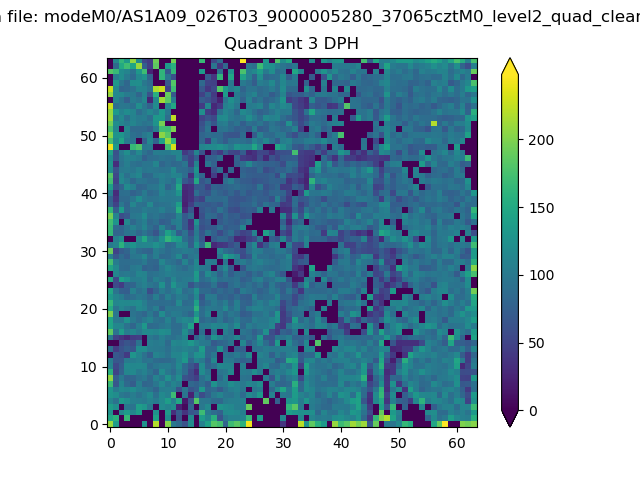 |
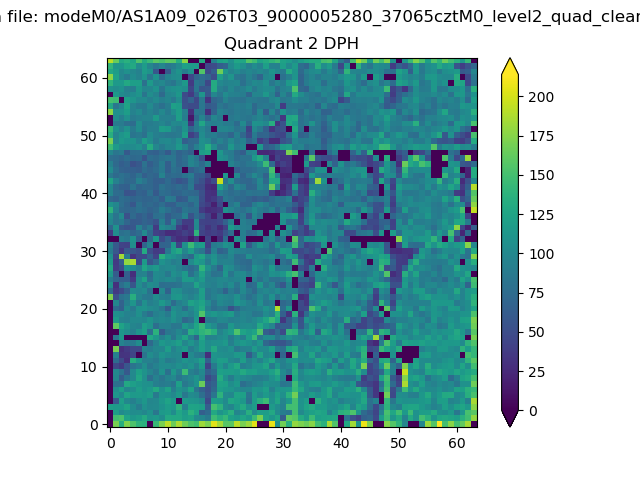 |
Quadrant C |
| Plot type | Count rate plots | Images |
|---|---|---|
| Comparison with Poisson distribution Blue bars denote a histogram of data divided into 1 sec bins. Red curve is a Poisson curve with rate = median count rate of data. |
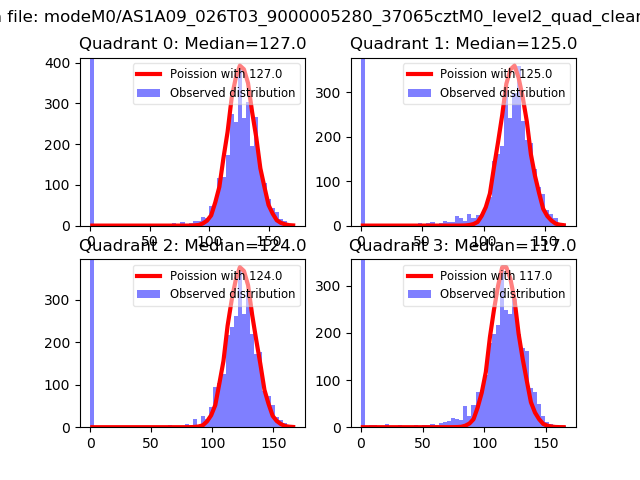 |
 |
| Quadrant-wise count rates Data is divided into 100 sec bins |
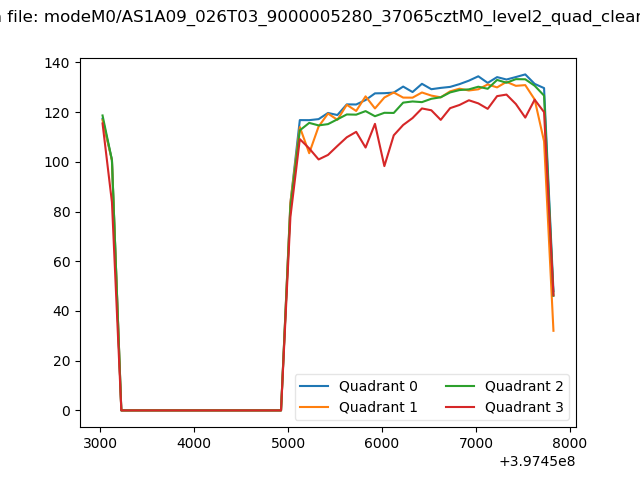 |
|
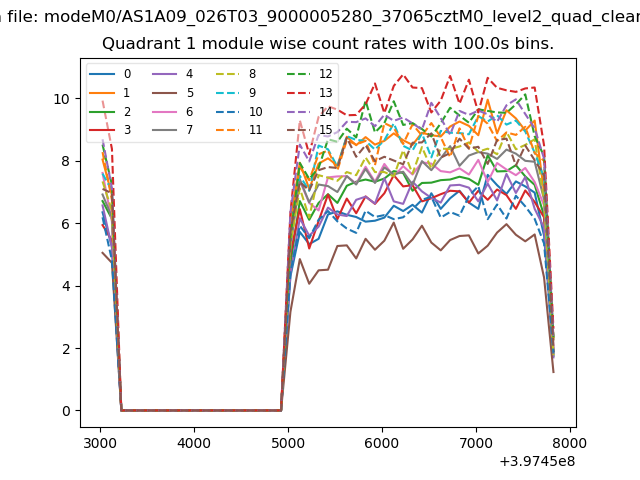
| Module-wise count rates for Quadrant A Data is divided into 100 sec bins |
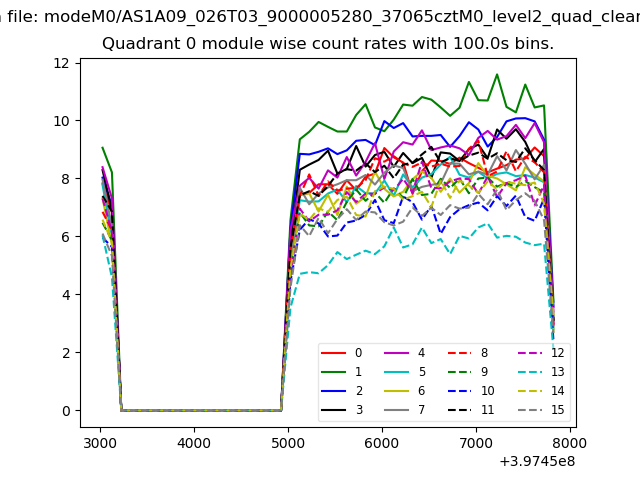 |
 |
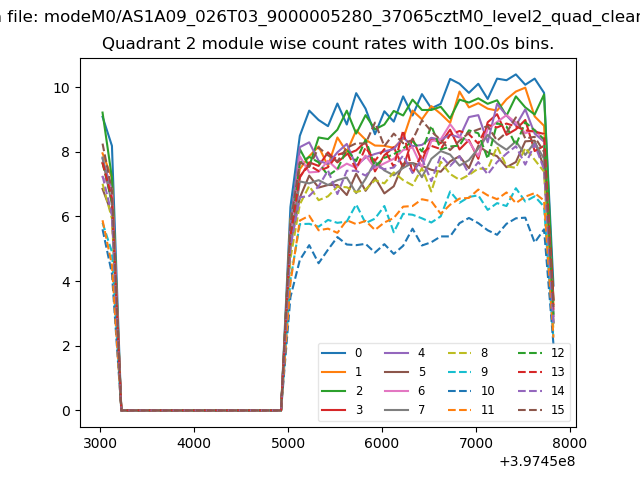
| Module-wise count rates for Quadrant B Data is divided into 100 sec bins |
 |
 |
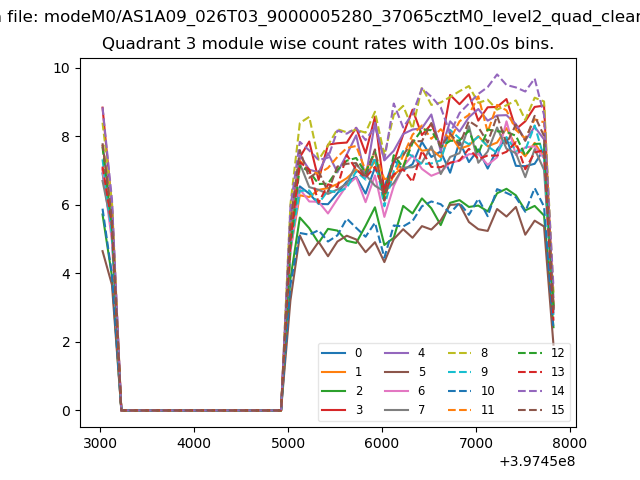
| Module-wise count rates for Quadrant C Data is divided into 100 sec bins |
 |
 |
| Module-wise count rates for Quadrant D Data is divided into 100 sec bins |
 |
 |
| Parameter | Plot |
|---|---|
| CZT HV Monitor | 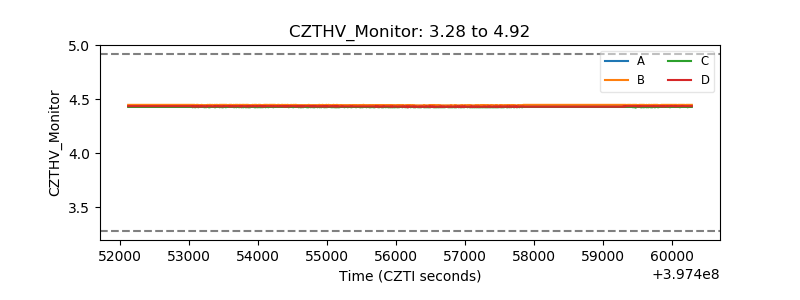 |
| D_VDD | 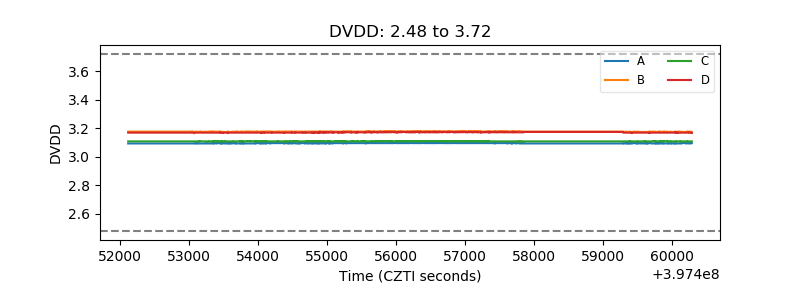 |
| Temperature 1 |  |
| Veto HV Monitor | 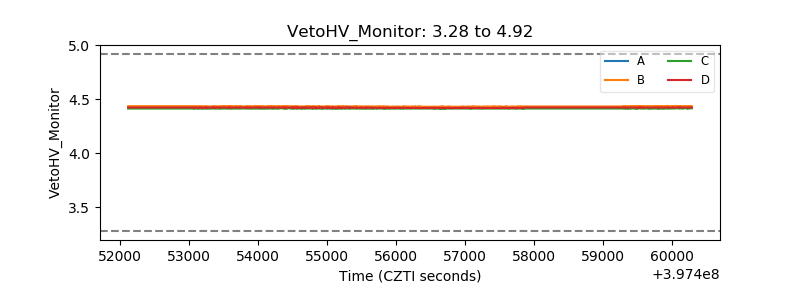 |
| Veto LLD | 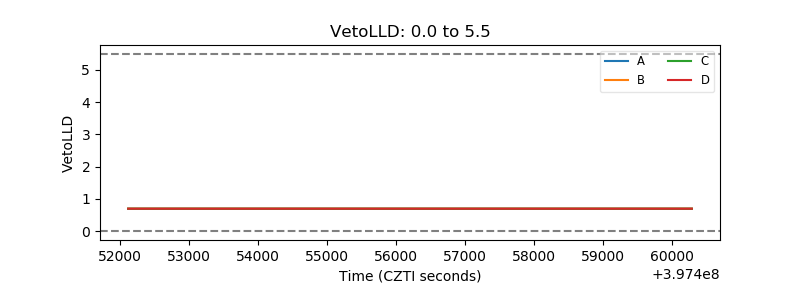 |
| Alpha Counter | 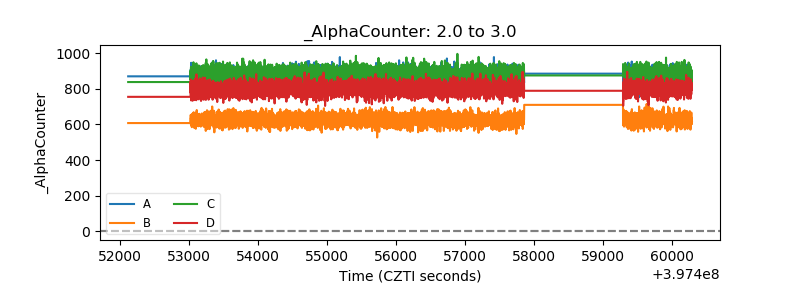 |
| _CPM_Rate | 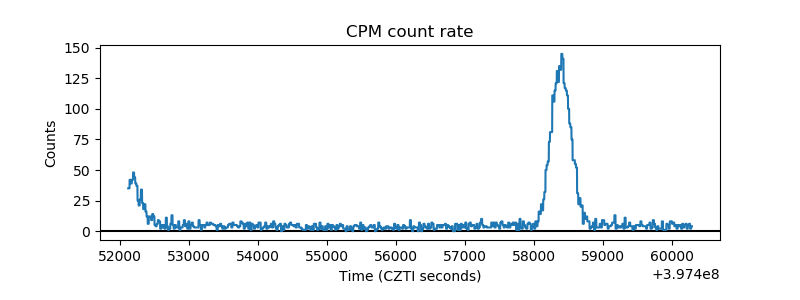 |
| CZT Counter | 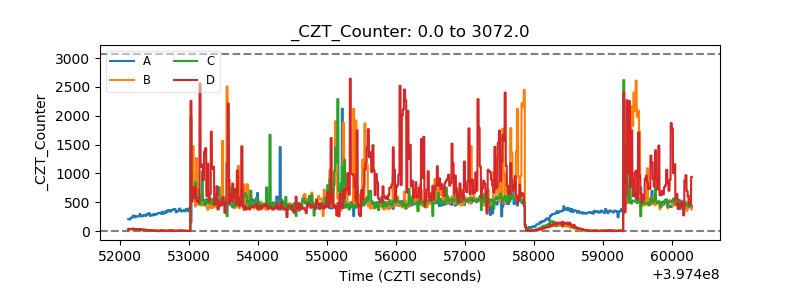 |
| +2.5 Volts monitor | 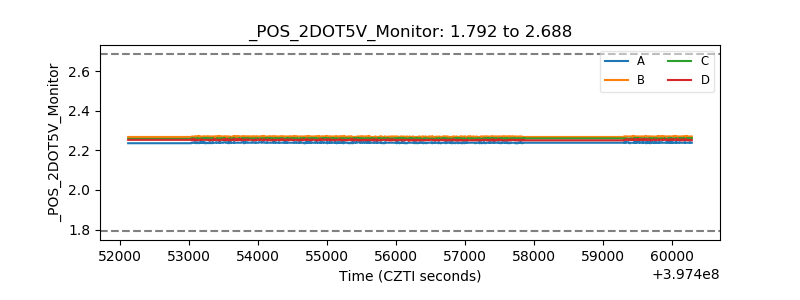 |
| +5 Volts monitor | 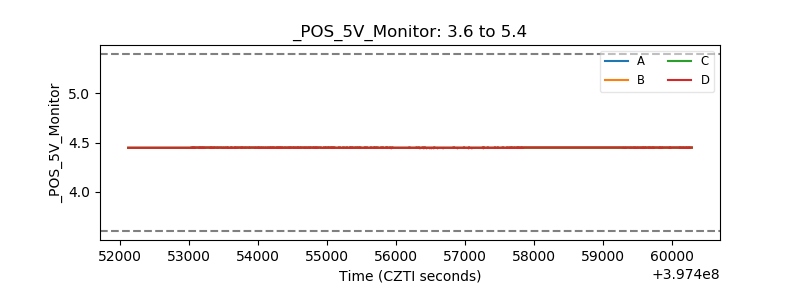 |
| _ROLL_ROT | 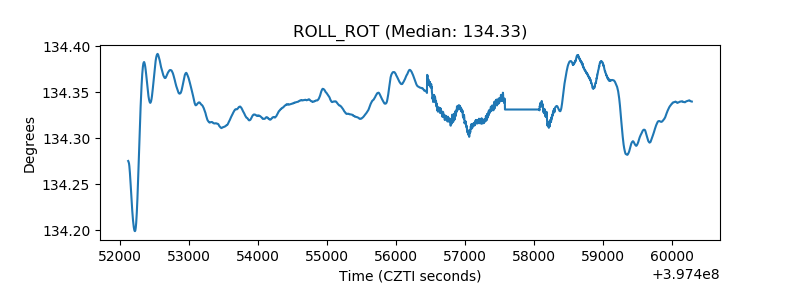 |
| _Roll_DEC | 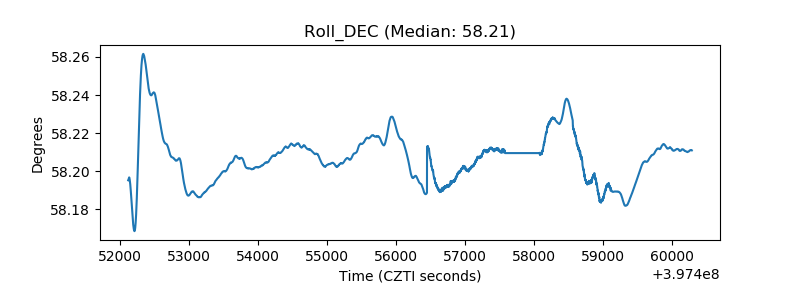 |
| _Roll_RA | 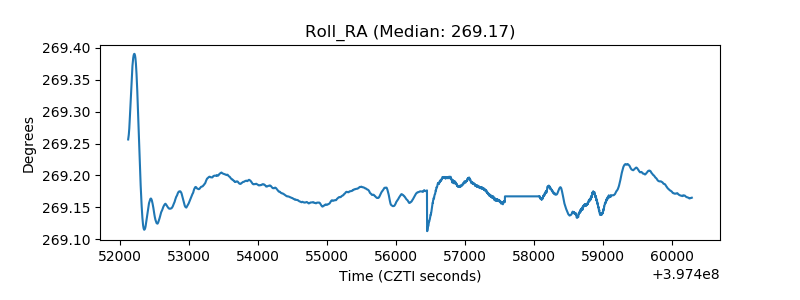 |
| Veto Counter | 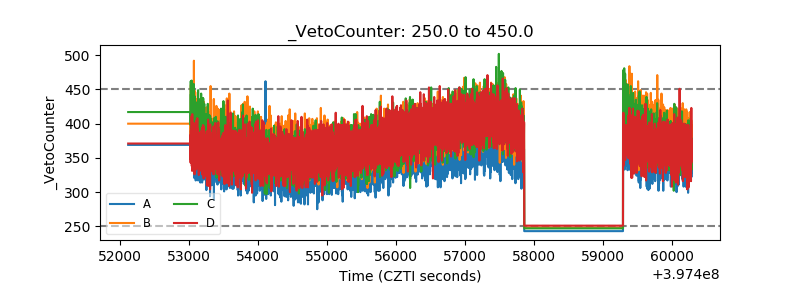 |