| Param | Original file | Final file |
|---|---|---|
| Filename | modeM0/AS1A09_026T03_9000005280_37066cztM0_level2.evt | modeM0/AS1A09_026T03_9000005280_37066cztM0_level2_quad_clean.evt |
| Size (bytes) | 751,135,680 | 69,940,800 |
| Size | 716.3 MB | 66.7 MB |
| Events in quadrant A | 3,300,967 | 488,403 |
| Events in quadrant B | 5,436,353 | 457,852 |
| Events in quadrant C | 3,698,638 | 477,494 |
| Events in quadrant D | 9,877,261 | 243,614 |
| Mode M9 | |||
|---|---|---|---|
| Quadrant | BADHDUFLAG | Total packets | Discarded packets |
| A | 0 | 29 | 0 |
| B | 0 | 29 | 0 |
| C | 0 | 29 | 0 |
| D | 0 | 29 | 0 |
| Mode SS | |||
|---|---|---|---|
| Quadrant | BADHDUFLAG | Total packets | Discarded packets |
| A | 0 | 134 | 0 |
| B | 0 | 134 | 0 |
| C | 0 | 134 | 0 |
| D | 0 | 134 | 0 |
| Mode M0 | |||
|---|---|---|---|
| Quadrant | BADHDUFLAG | Total packets | Discarded packets |
| A | 0 | 13661 | 3 |
| B | 0 | 20497 | 2 |
| C | 0 | 14726 | 2 |
| D | 0 | 33729 | 2 |
| Quadrant | Total seconds | Saturated seconds | Saturation percentage |
|---|---|---|---|
| A | 6430 | 25 | 0.388802% |
| B | 6430 | 700 | 10.886470% |
| C | 6430 | 137 | 2.130638% |
| D | 6430 | 2733 | 42.503888% |
Noise dominated data is calculated using 1-second bins in cleaned event files. If a bin has >2000 counts, and if more than 50% of those come from <1% of pixels, then it is considered to be noise-dominated and hence unusable.
| Quadrant | # 1 sec bins | Bins with >0 counts | Bins with >2000 counts | High rate bins dominated by noise | Noise dominated (total time) | Noise dominated (detector-on time) | Marked lightcurve |
|---|---|---|---|---|---|---|---|
| A | 9386 | 6432 | 18 | 18 | 0.19% | 0.28% | 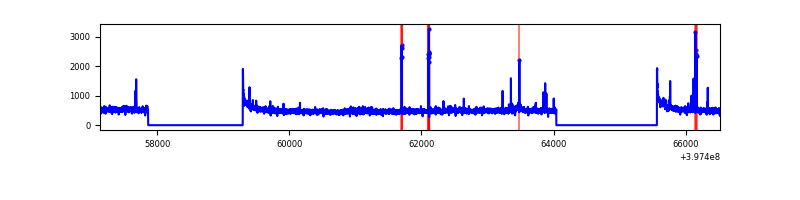 |
| B | 9386 | 6431 | 514 | 514 | 5.48% | 7.99% | 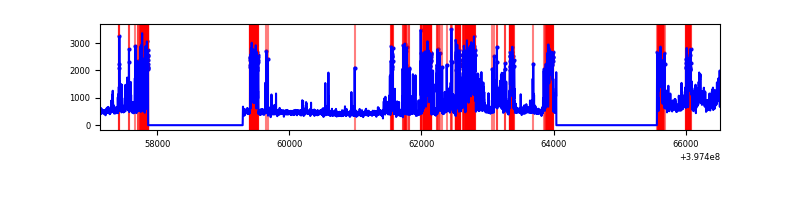 |
| C | 9386 | 6432 | 132 | 132 | 1.41% | 2.05% | 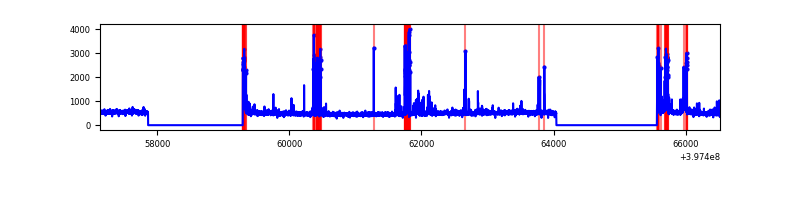 |
| D | 9385 | 6431 | 2644 | 2644 | 28.17% | 41.11% | 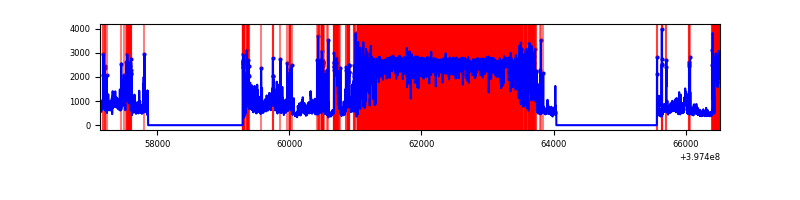 |
Top three noisy pixels from each quadrant. If the there are fewer than three noisy pixels in the level2.evt file, extra rows are filled as -1
| Pixel properties | Quadrant properties | ||||||
|---|---|---|---|---|---|---|---|
| Quadrant | DetID | PixID | Counts | Sigma | Mean | Median | Sigma |
| A | 10 | 83 | 293247 | 1928.86 | 746 | 728 | 151.7 |
| A | 9 | 143 | 75500 | 493.04 | 746 | 728 | 151.7 |
| A | 7 | 3 | 20512 | 130.46 | 746 | 728 | 151.7 |
| B | 5 | 184 | 2313688 | 16931.08 | 713 | 696 | 136.6 |
| B | 0 | 229 | 214871 | 1567.76 | 713 | 696 | 136.6 |
| B | 5 | 255 | 22000 | 155.95 | 713 | 696 | 136.6 |
| C | 0 | 10 | 318675 | 1883.94 | 720 | 724 | 168.8 |
| C | 15 | 214 | 273601 | 1616.87 | 720 | 724 | 168.8 |
| C | 1 | 23 | 142075 | 837.54 | 720 | 724 | 168.8 |
| D | 12 | 17 | 6413052 | 48779.77 | 528 | 513 | 131.5 |
| D | 6 | 112 | 364135 | 2766.05 | 528 | 513 | 131.5 |
| D | 12 | 235 | 351499 | 2669.93 | 528 | 513 | 131.5 |
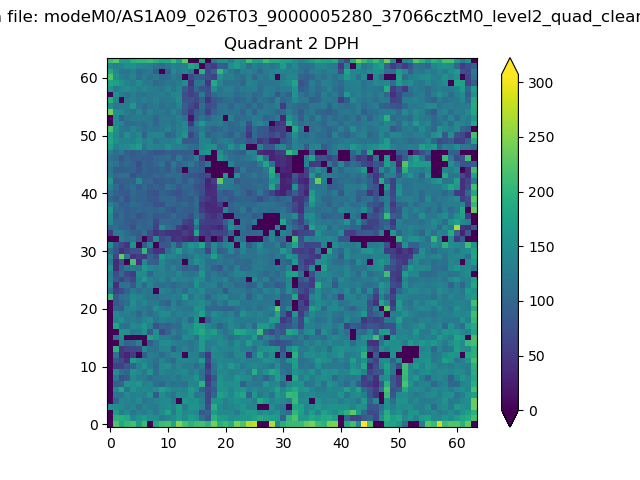
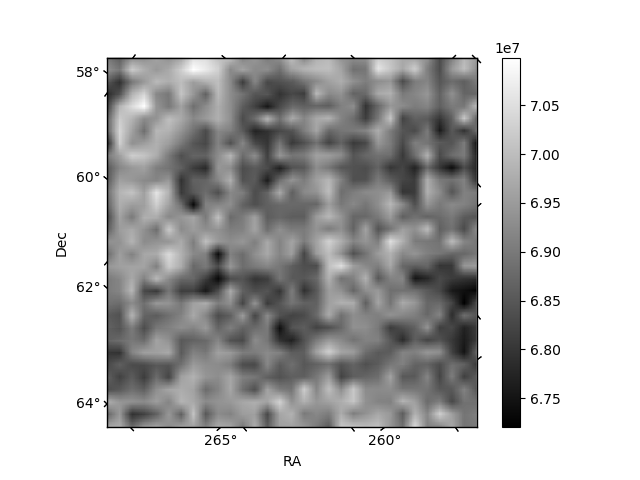
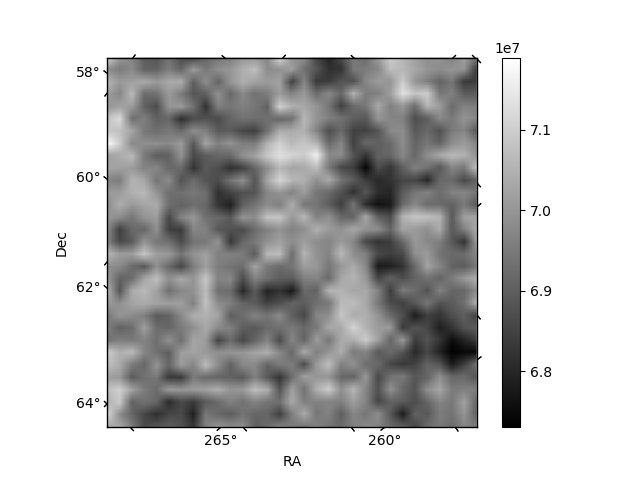
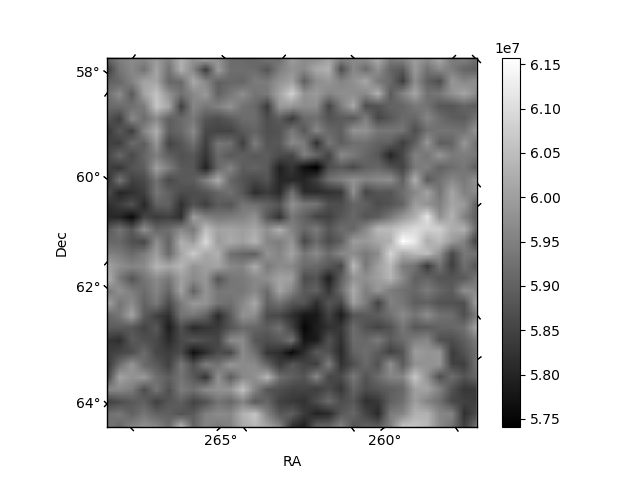
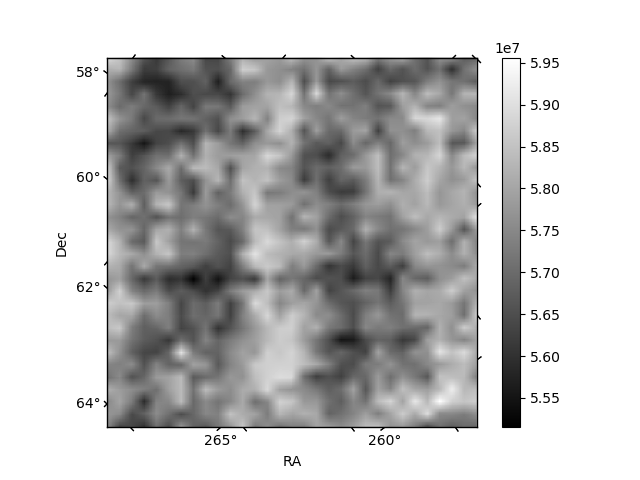
Histogram calculated using DETX and DETY for each event in the final _common_clean file
| Quadrant A | 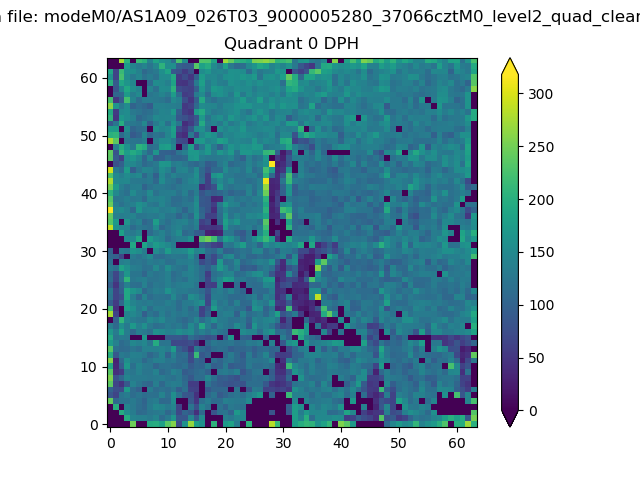 |
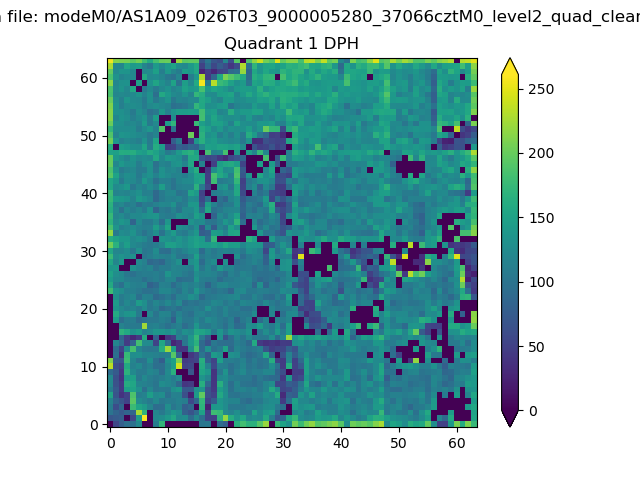 |
Quadrant B |
|---|---|---|---|
| Quadrant D | 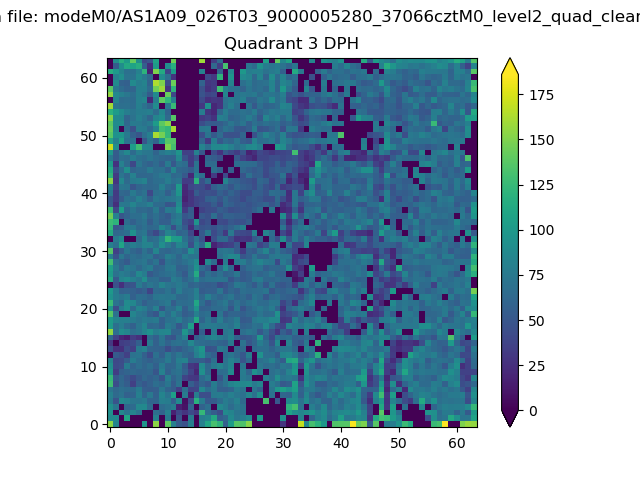 |
 |
Quadrant C |
| Plot type | Count rate plots | Images |
|---|---|---|
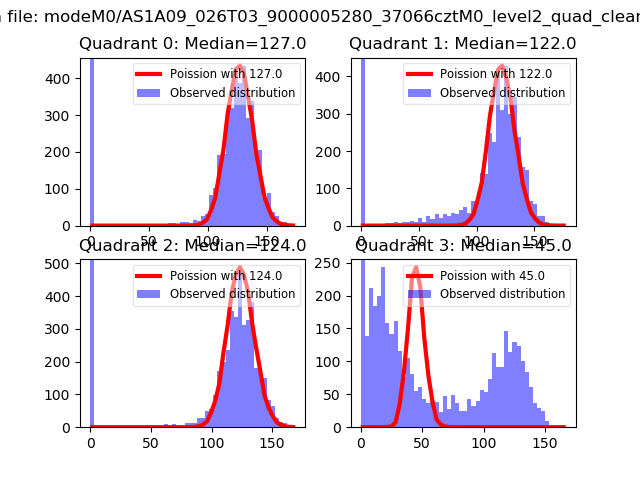
| Comparison with Poisson distribution Blue bars denote a histogram of data divided into 1 sec bins. Red curve is a Poisson curve with rate = median count rate of data. |
 |
 |
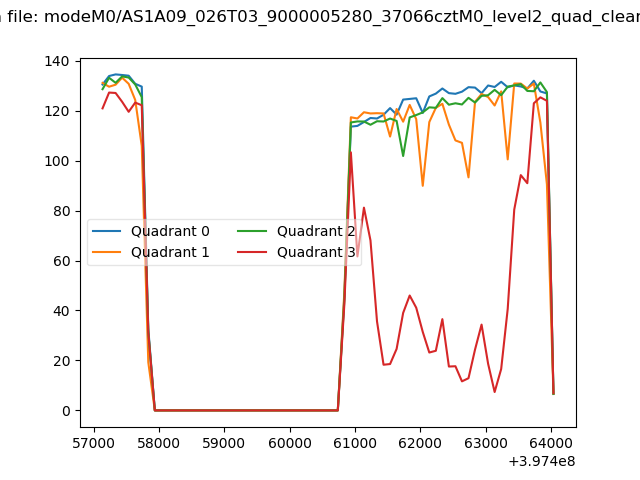
| Quadrant-wise count rates Data is divided into 100 sec bins |
 |
|
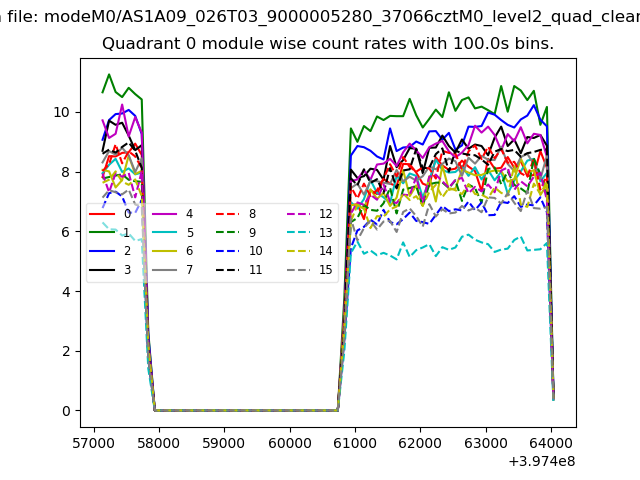
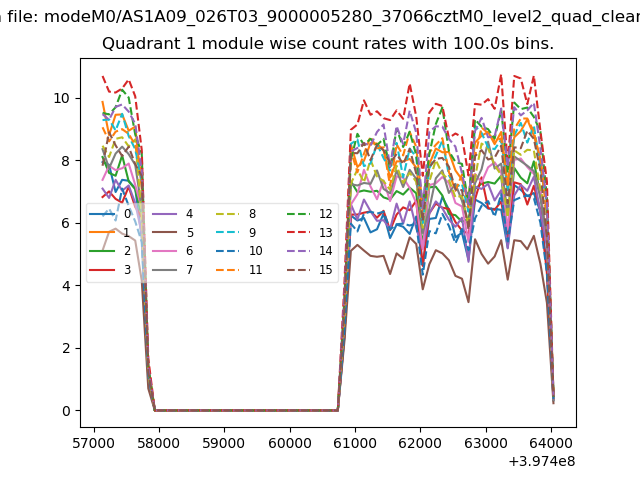
| Module-wise count rates for Quadrant A Data is divided into 100 sec bins |
 |
 |
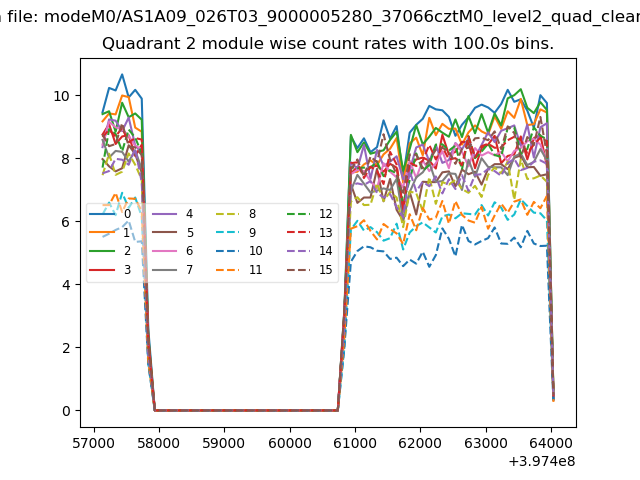
| Module-wise count rates for Quadrant B Data is divided into 100 sec bins |
 |
 |
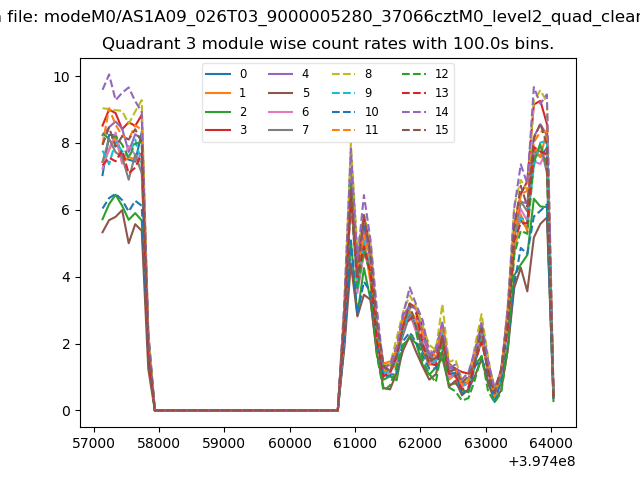
| Module-wise count rates for Quadrant C Data is divided into 100 sec bins |
 |
 |
| Module-wise count rates for Quadrant D Data is divided into 100 sec bins |
 |
 |
| Parameter | Plot |
|---|---|
| CZT HV Monitor | 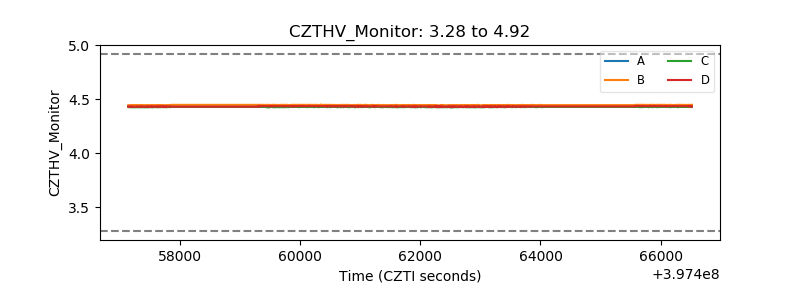 |
| D_VDD | 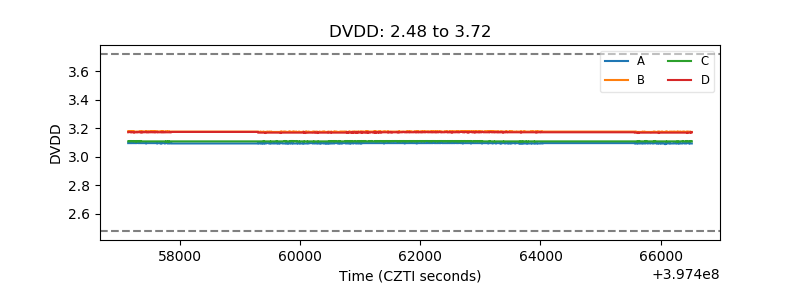 |
| Temperature 1 | 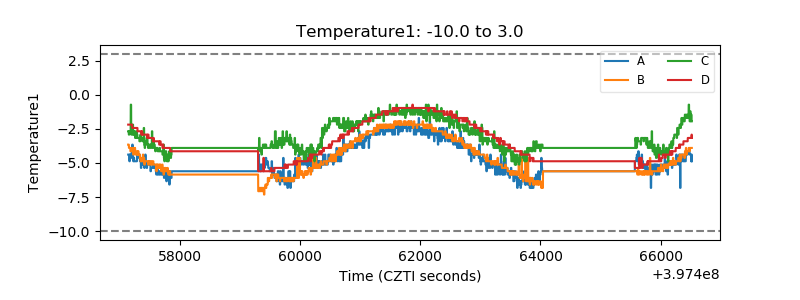 |
| Veto HV Monitor | 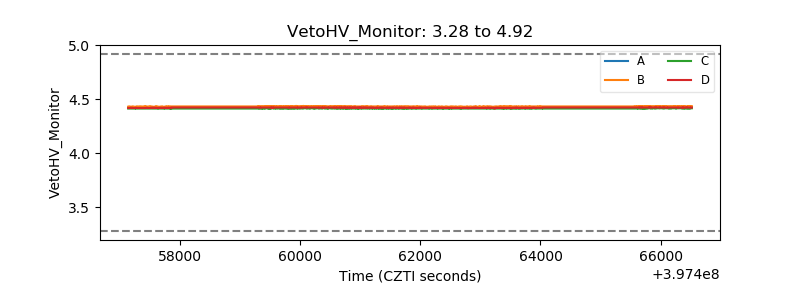 |
| Veto LLD | 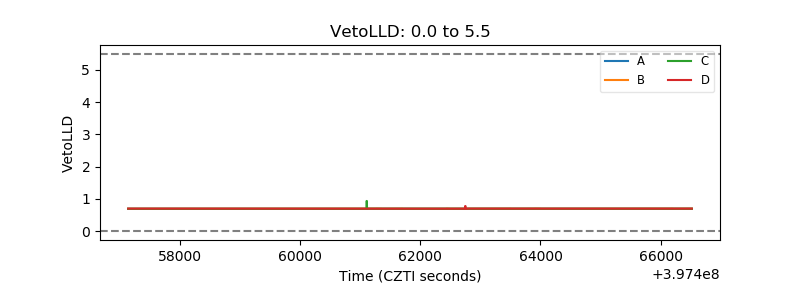 |
| Alpha Counter | 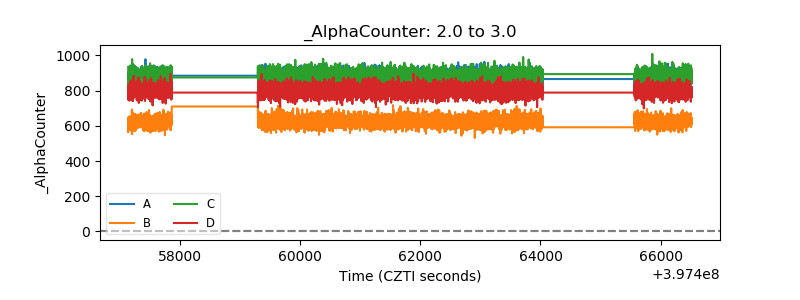 |
| _CPM_Rate | 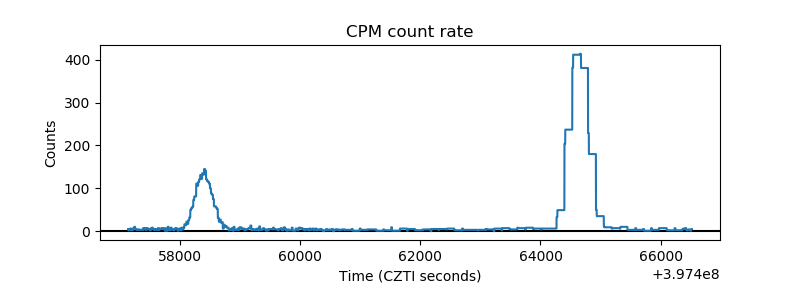 |
| CZT Counter | 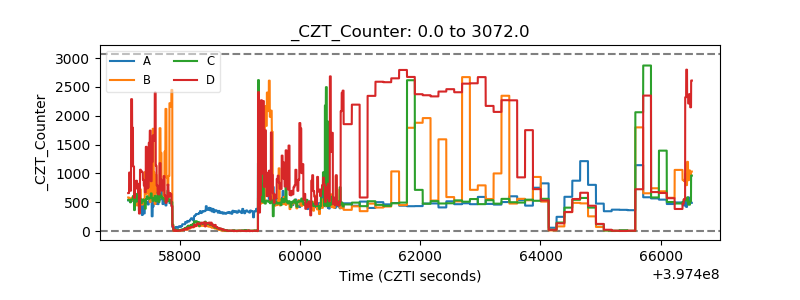 |
| +2.5 Volts monitor | 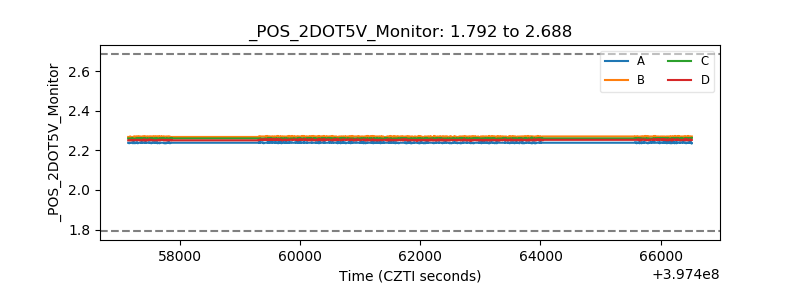 |
| +5 Volts monitor | 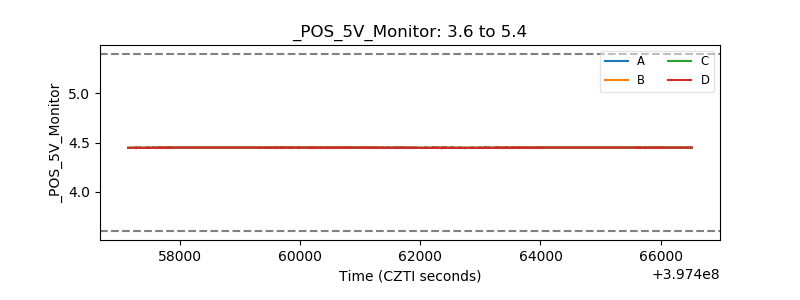 |
| _ROLL_ROT | 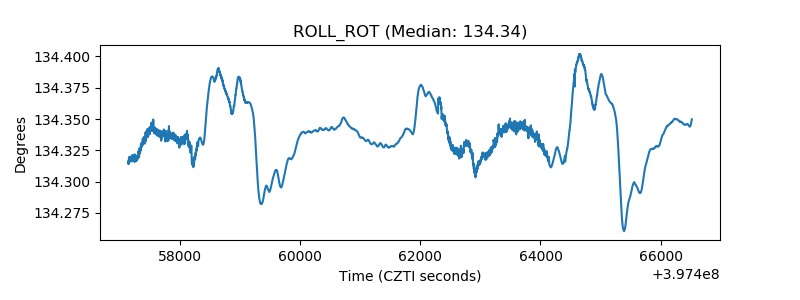 |
| _Roll_DEC | 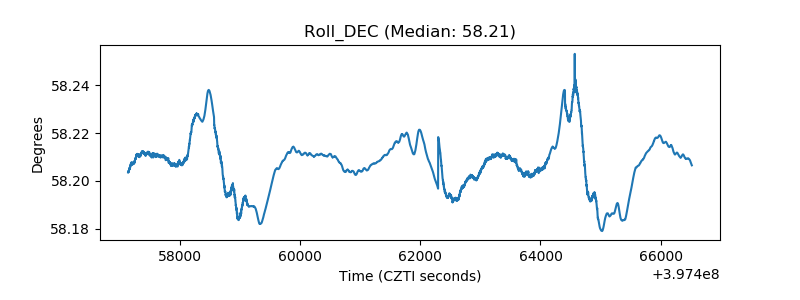 |
| _Roll_RA | 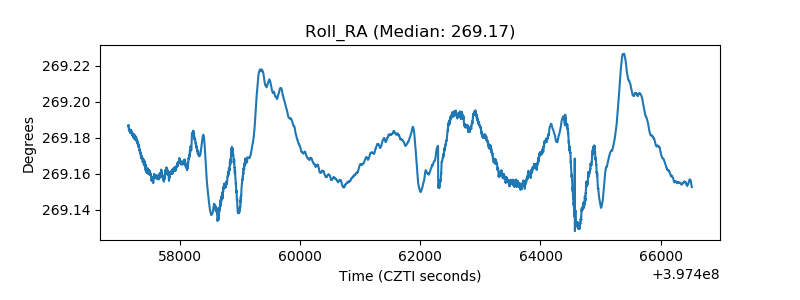 |
| Veto Counter | 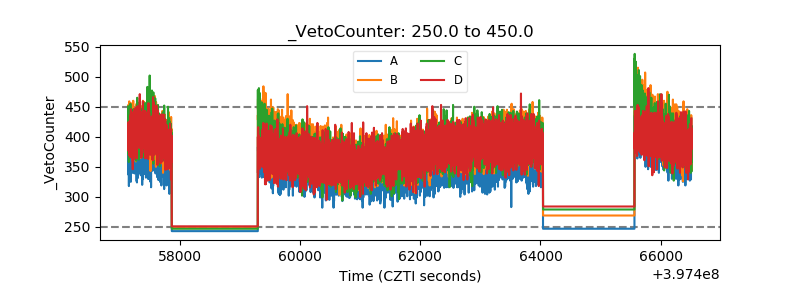 |