| Param | Original file | Final file |
|---|---|---|
| Filename | modeM0/AS1A09_026T03_9000005280_37067cztM0_level2.evt | modeM0/AS1A09_026T03_9000005280_37067cztM0_level2_quad_clean.evt |
| Size (bytes) | 338,437,440 | 40,178,880 |
| Size | 322.8 MB | 38.3 MB |
| Events in quadrant A | 1,639,139 | 257,990 |
| Events in quadrant B | 3,138,468 | 247,850 |
| Events in quadrant C | 1,869,705 | 249,267 |
| Events in quadrant D | 3,380,213 | 229,108 |
| Mode M9 | |||
|---|---|---|---|
| Quadrant | BADHDUFLAG | Total packets | Discarded packets |
| A | 0 | 12 | 0 |
| B | 0 | 12 | 0 |
| C | 0 | 12 | 0 |
| D | 0 | 13 | 0 |
| Mode SS | |||
|---|---|---|---|
| Quadrant | BADHDUFLAG | Total packets | Discarded packets |
| A | 0 | 66 | 0 |
| B | 0 | 66 | 0 |
| C | 0 | 66 | 0 |
| D | 0 | 66 | 0 |
| Mode M0 | |||
|---|---|---|---|
| Quadrant | BADHDUFLAG | Total packets | Discarded packets |
| A | 0 | 6875 | 1 |
| B | 0 | 11547 | 1 |
| C | 0 | 7536 | 1 |
| D | 0 | 12332 | 1 |
| Quadrant | Total seconds | Saturated seconds | Saturation percentage |
|---|---|---|---|
| A | 3261 | 10 | 0.306654% |
| B | 3261 | 364 | 11.162220% |
| C | 3261 | 60 | 1.839926% |
| D | 3261 | 306 | 9.383625% |
Noise dominated data is calculated using 1-second bins in cleaned event files. If a bin has >2000 counts, and if more than 50% of those come from <1% of pixels, then it is considered to be noise-dominated and hence unusable.
| Quadrant | # 1 sec bins | Bins with >0 counts | Bins with >2000 counts | High rate bins dominated by noise | Noise dominated (total time) | Noise dominated (detector-on time) | Marked lightcurve |
|---|---|---|---|---|---|---|---|
| A | 3261 | 3261 | 5 | 5 | 0.15% | 0.15% | 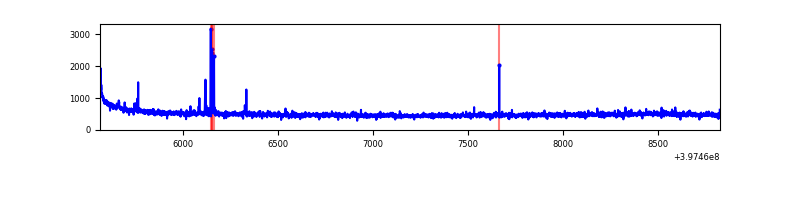 |
| B | 3261 | 3261 | 263 | 263 | 8.07% | 8.07% | 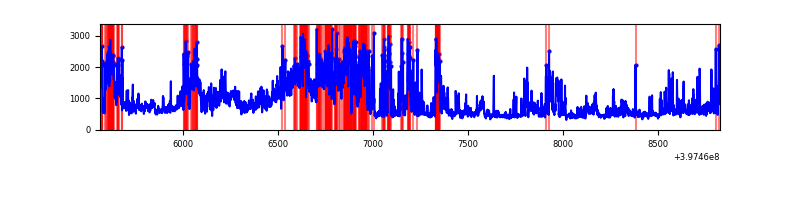 |
| C | 3261 | 3261 | 51 | 51 | 1.56% | 1.56% | 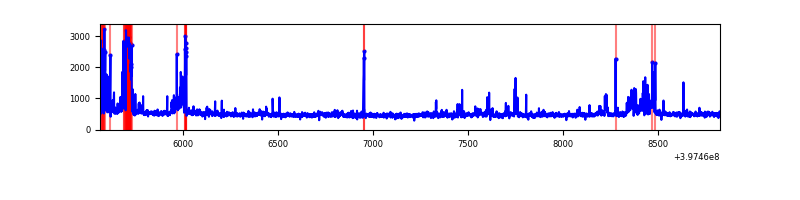 |
| D | 3261 | 3261 | 291 | 291 | 8.92% | 8.92% | 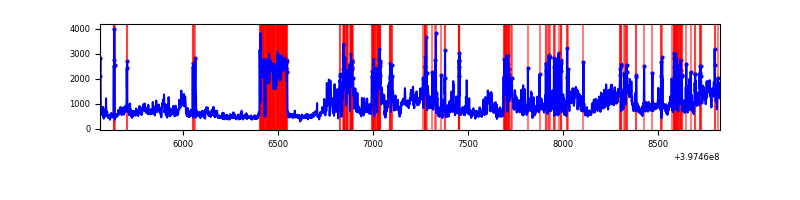 |
Top three noisy pixels from each quadrant. If the there are fewer than three noisy pixels in the level2.evt file, extra rows are filled as -1
| Pixel properties | Quadrant properties | ||||||
|---|---|---|---|---|---|---|---|
| Quadrant | DetID | PixID | Counts | Sigma | Mean | Median | Sigma |
| A | 10 | 83 | 149489 | 1957.75 | 373 | 366 | 76.2 |
| A | 9 | 143 | 26257 | 339.91 | 373 | 366 | 76.2 |
| A | 12 | 189 | 10988 | 139.45 | 373 | 366 | 76.2 |
| B | 5 | 184 | 1625763 | 23057.76 | 357 | 348 | 70.5 |
| B | 0 | 229 | 27678 | 387.7 | 357 | 348 | 70.5 |
| B | 4 | 81 | 18934 | 263.66 | 357 | 348 | 70.5 |
| C | 1 | 23 | 205292 | 2442.45 | 355 | 357 | 83.9 |
| C | 15 | 214 | 139115 | 1653.74 | 355 | 357 | 83.9 |
| C | 0 | 10 | 99938 | 1186.83 | 355 | 357 | 83.9 |
| D | 6 | 112 | 667037 | 7685.54 | 348 | 338 | 86.7 |
| D | 12 | 17 | 649703 | 7485.72 | 348 | 338 | 86.7 |
| D | 12 | 235 | 295045 | 3397.31 | 348 | 338 | 86.7 |
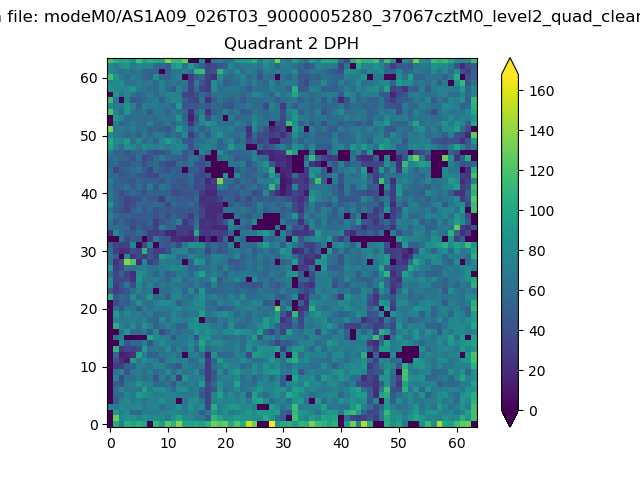
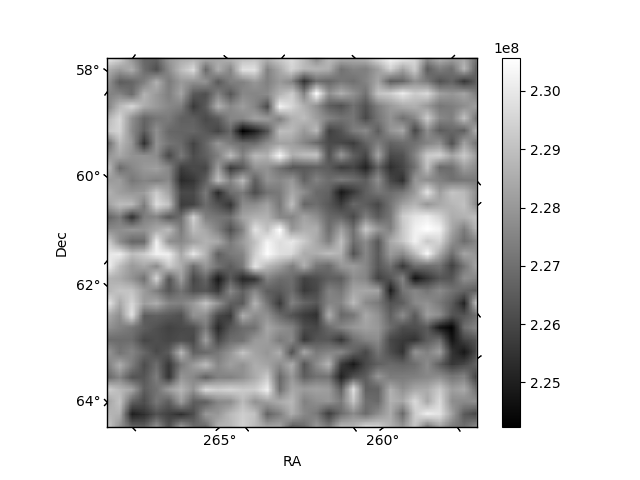
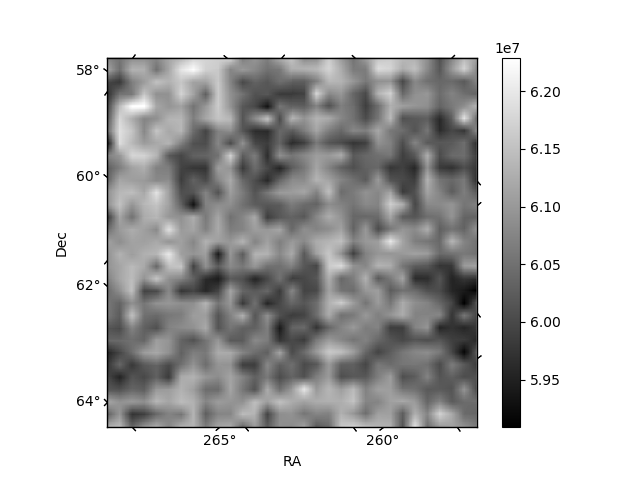
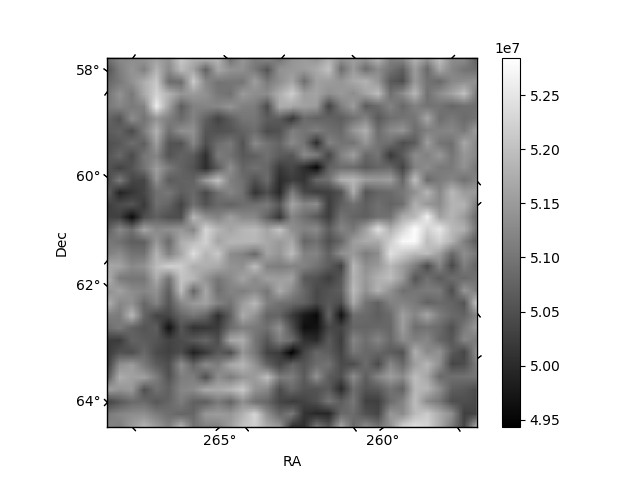
Histogram calculated using DETX and DETY for each event in the final _common_clean file
| Quadrant A | 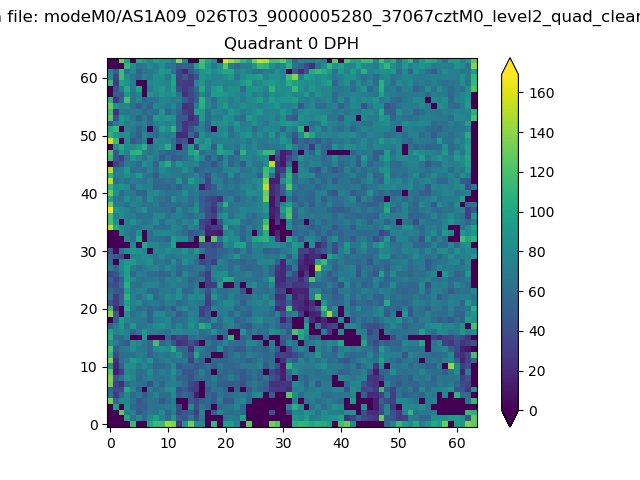 |
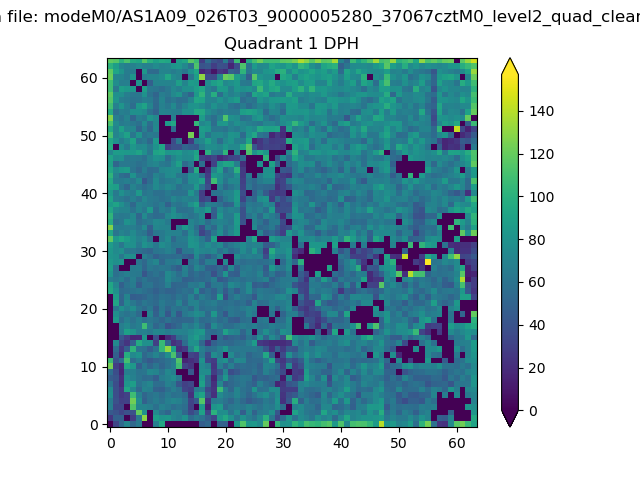 |
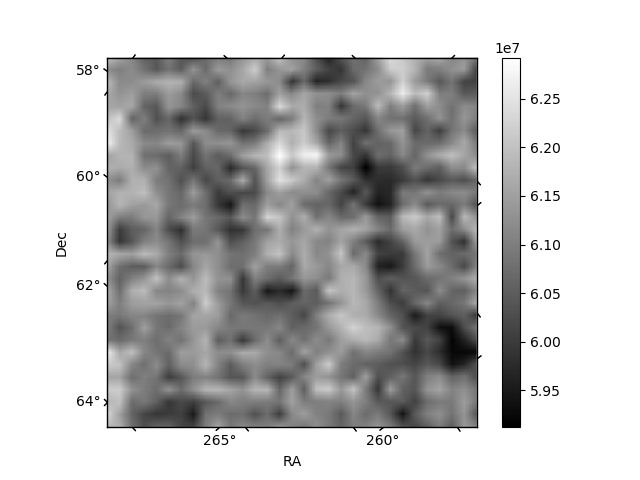
Quadrant B |
|---|---|---|---|
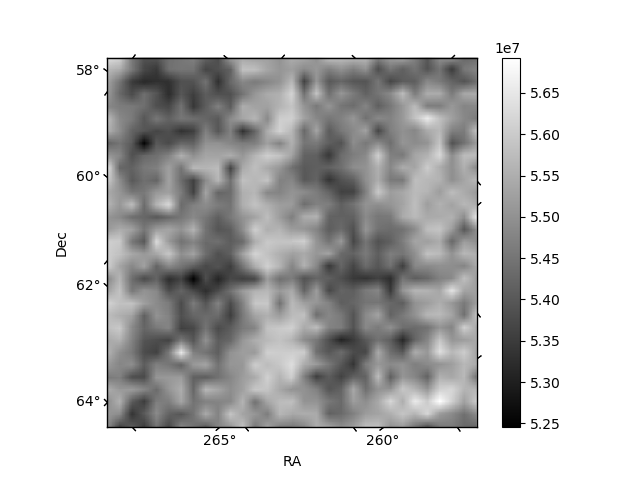
| Quadrant D | 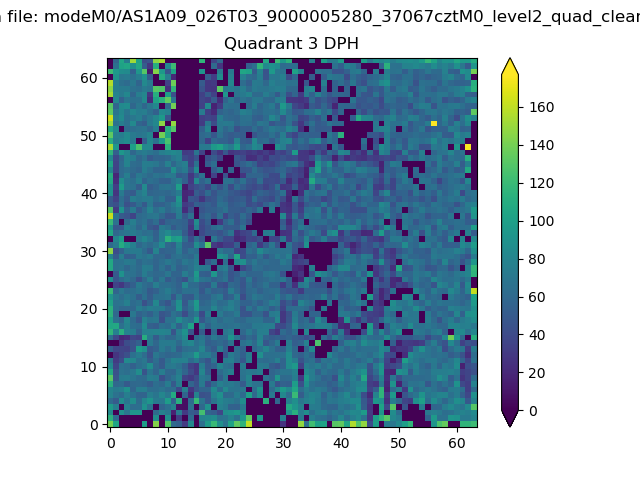 |
 |
Quadrant C |
| Plot type | Count rate plots | Images |
|---|---|---|
| Comparison with Poisson distribution Blue bars denote a histogram of data divided into 1 sec bins. Red curve is a Poisson curve with rate = median count rate of data. |
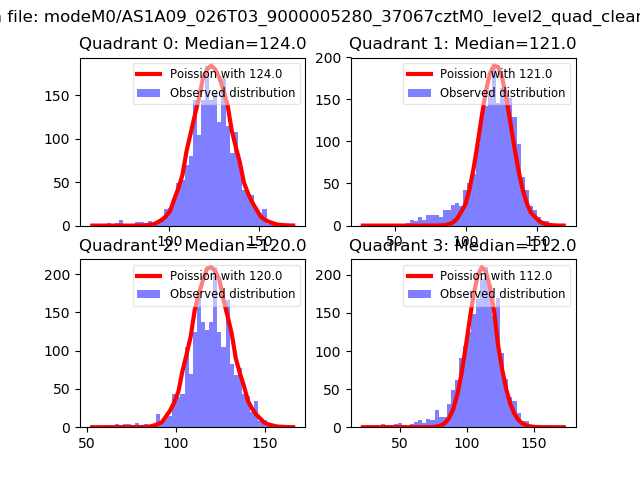 |
 |
| Quadrant-wise count rates Data is divided into 100 sec bins |
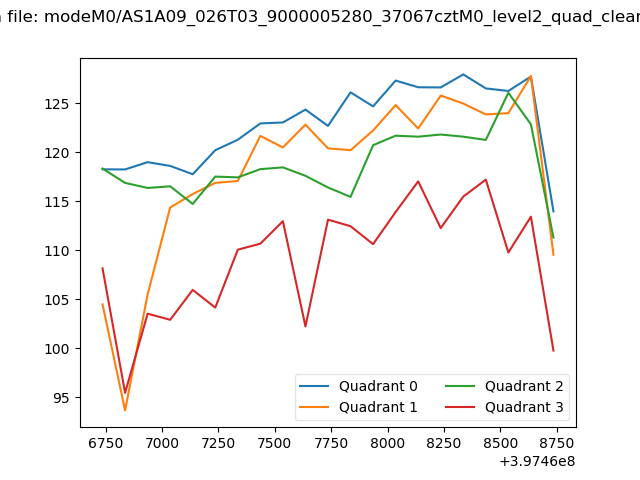 |
|
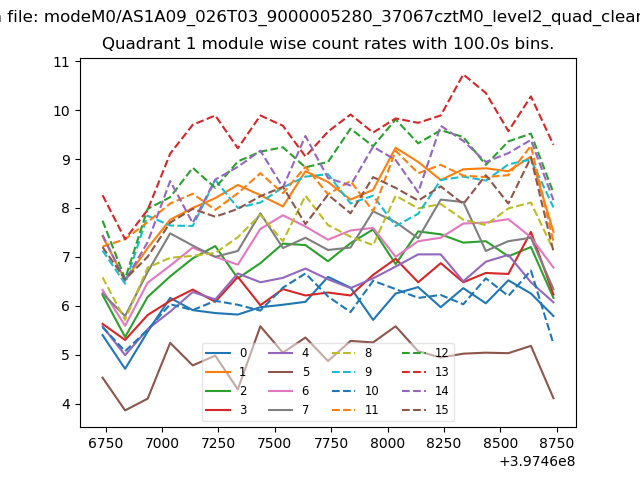
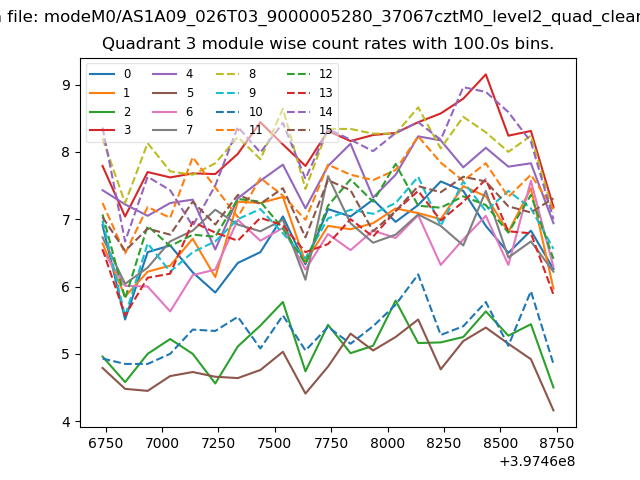
| Module-wise count rates for Quadrant A Data is divided into 100 sec bins |
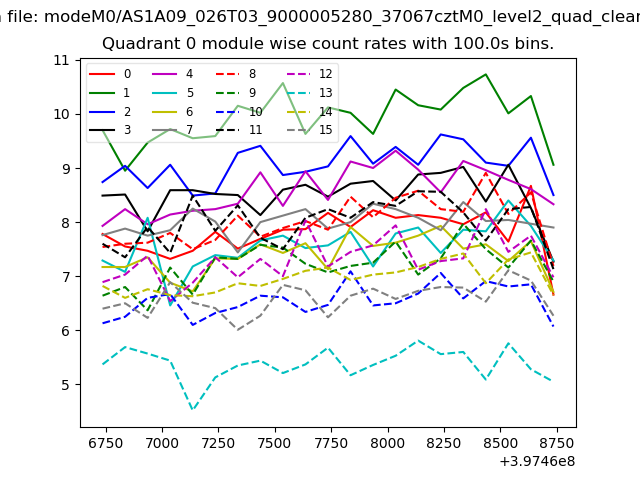 |
 |
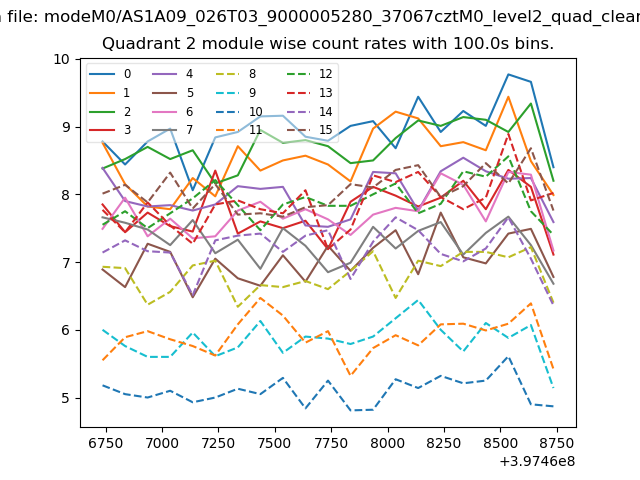
| Module-wise count rates for Quadrant B Data is divided into 100 sec bins |
 |
 |
| Module-wise count rates for Quadrant C Data is divided into 100 sec bins |
 |
 |
| Module-wise count rates for Quadrant D Data is divided into 100 sec bins |
 |
 |
| Parameter | Plot |
|---|---|
| CZT HV Monitor | 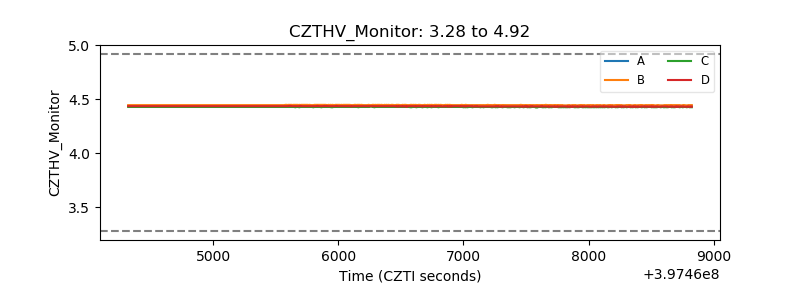 |
| D_VDD | 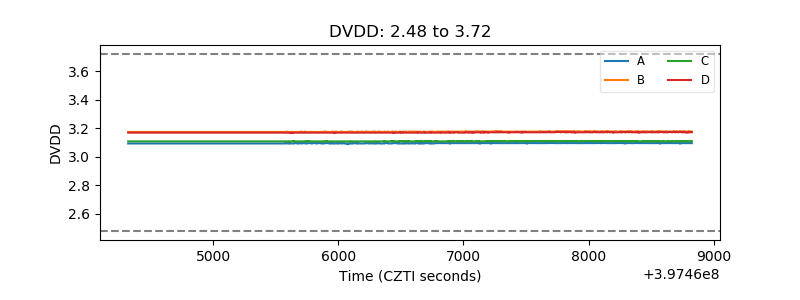 |
| Temperature 1 |  |
| Veto HV Monitor | 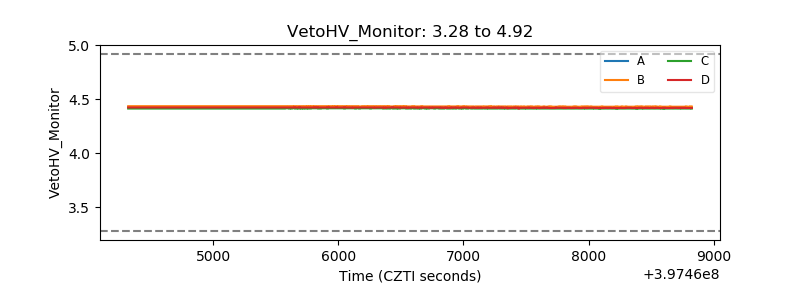 |
| Veto LLD | 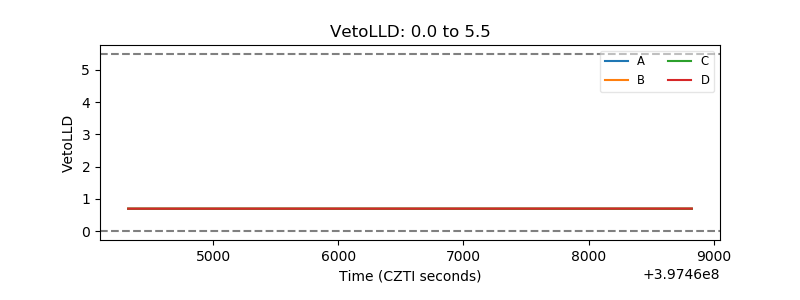 |
| Alpha Counter | 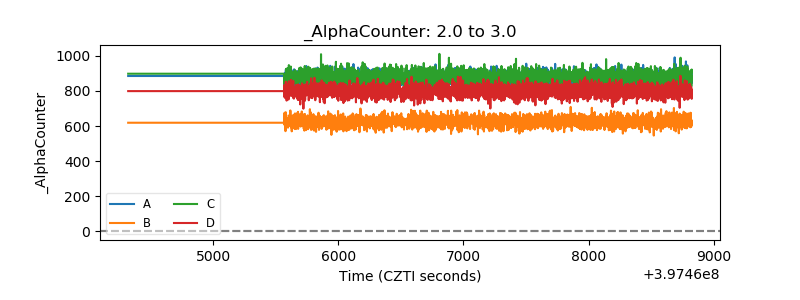 |
| _CPM_Rate | 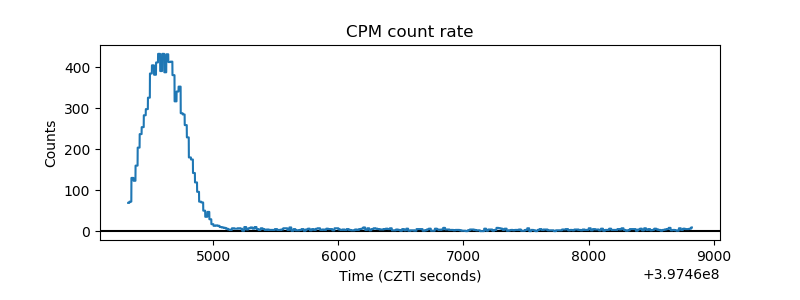 |
| CZT Counter | 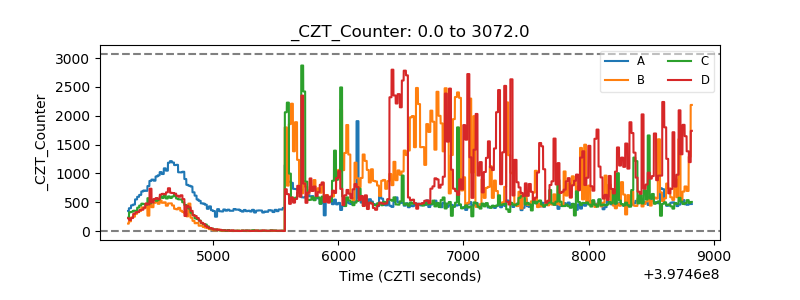 |
| +2.5 Volts monitor | 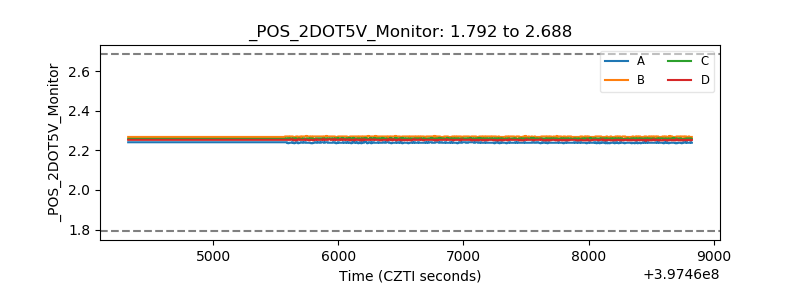 |
| +5 Volts monitor | 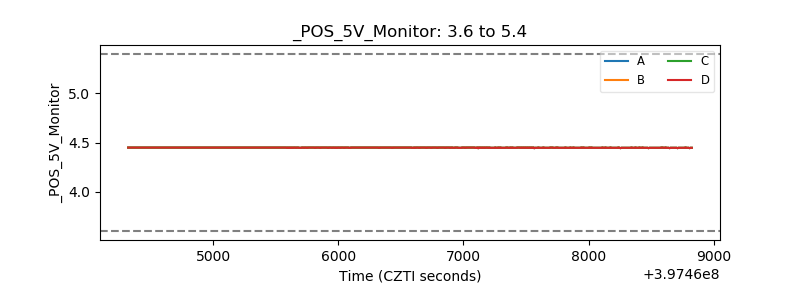 |
| _ROLL_ROT | 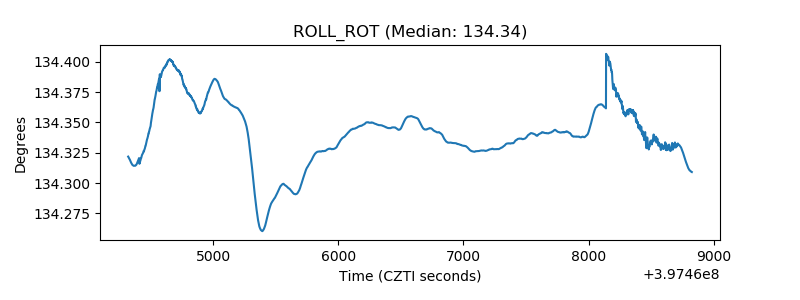 |
| _Roll_DEC | 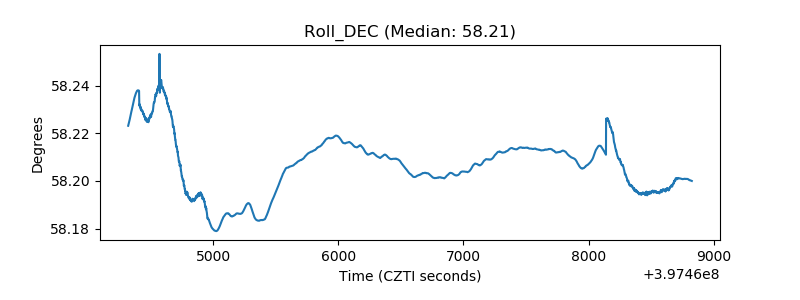 |
| _Roll_RA | 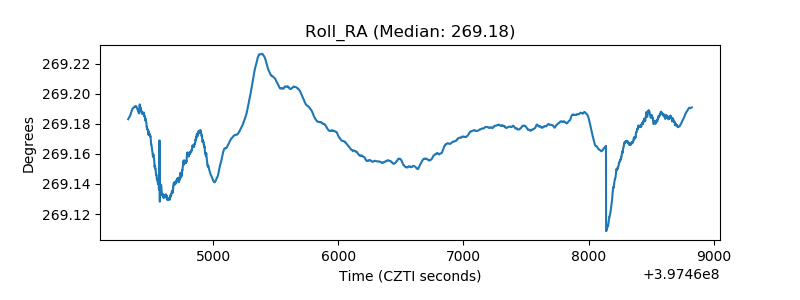 |
| Veto Counter | 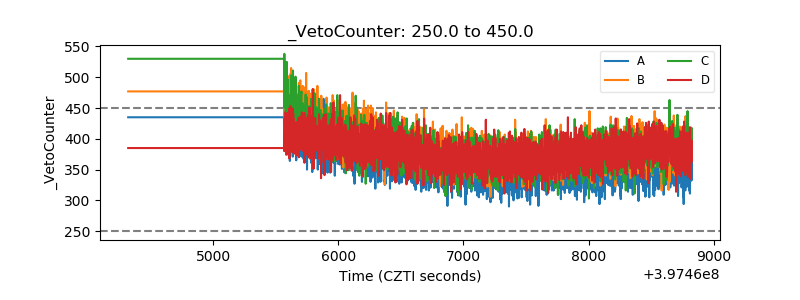 |