| Param | Original file | Final file |
|---|---|---|
| Filename | modeM0/AS1A09_138T04_9000005282cztM0_level2.fits | modeM0/AS1A09_138T04_9000005282cztM0_level2_quad_clean.evt |
| Size (bytes) | 2,194,761,600 | 2,116,440,000 |
| Size | 2.0 GB | 2.0 GB |
| Events in quadrant A | 13,700,572 | 12,897,913 |
| Events in quadrant B | 12,659,020 | 12,538,620 |
| Events in quadrant C | 13,094,886 | 12,023,205 |
| Events in quadrant D | 11,246,258 | 10,875,687 |
| Mode SS | |||
|---|---|---|---|
| Quadrant | BADHDUFLAG | Total packets | Discarded packets |
| A | 0 | 4708 | 0 |
| B | 0 | 4708 | 0 |
| C | 0 | 4708 | 0 |
| D | 0 | 4708 | 0 |
| Mode M0 | |||
|---|---|---|---|
| Quadrant | BADHDUFLAG | Total packets | Discarded packets |
| A | 0 | 498515 | 0 |
| B | 0 | 558597 | 0 |
| C | 0 | 495020 | 0 |
| D | 0 | 641525 | 0 |
| Mode M9 | |||
|---|---|---|---|
| Quadrant | BADHDUFLAG | Total packets | Discarded packets |
| A | 0 | 880 | 0 |
| B | 0 | 880 | 0 |
| C | 0 | 880 | 0 |
| D | 0 | 880 | 0 |
| Quadrant | Total seconds | Saturated seconds | Saturation percentage |
|---|---|---|---|
| A | 230114 | 1448 | 0.629253% |
| B | 230113 | 8829 | 3.836811% |
| C | 230114 | 1543 | 0.670537% |
| D | 230114 | 11045 | 4.799795% |
Noise dominated data is calculated using 1-second bins in cleaned event files. If a bin has >2000 counts, and if more than 50% of those come from <1% of pixels, then it is considered to be noise-dominated and hence unusable.
| Quadrant | # 1 sec bins | Bins with >0 counts | Bins with >2000 counts | High rate bins dominated by noise | Noise dominated (total time) | Noise dominated (detector-on time) | Marked lightcurve |
|---|---|---|---|---|---|---|---|
| A | 316858 | 230001 | 0 | 0 | 0.00% | 0.00% | 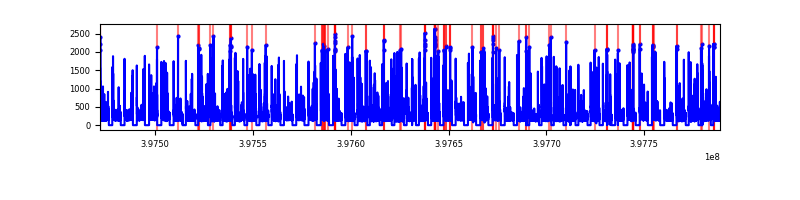 |
| B | 316858 | 229298 | 0 | 0 | 0.00% | 0.00% |  |
| C | 316858 | 230075 | 0 | 0 | 0.00% | 0.00% |  |
| D | 316858 | 229800 | 0 | 0 | 0.00% | 0.00% |  |
Top three noisy pixels from each quadrant. If the there are fewer than three noisy pixels in the level2.evt file, extra rows are filled as -1
| Pixel properties | Quadrant properties | ||||||
|---|---|---|---|---|---|---|---|
| Quadrant | DetID | PixID | Counts | Sigma | Mean | Median | Sigma |
| A | 9 | 19 | 11106 | 8.82 | 3579 | 3363 | 877.5 |
| A | 7 | 110 | 10863 | 8.55 | 3579 | 3363 | 877.5 |
| A | 0 | 29 | 10802 | 8.48 | 3579 | 3363 | 877.5 |
| B | 2 | 9 | 10844 | 11.74 | 3365 | 3223 | 649.2 |
| B | 3 | 80 | 9676 | 9.94 | 3365 | 3223 | 649.2 |
| B | 2 | 8 | 8926 | 8.78 | 3365 | 3223 | 649.2 |
| C | 1 | 81 | 10871 | 8.74 | 3462 | 3249 | 872.0 |
| C | 1 | 80 | 10559 | 8.38 | 3462 | 3249 | 872.0 |
| C | 3 | 203 | 10493 | 8.31 | 3462 | 3249 | 872.0 |
| D | 7 | 3 | 8172 | 6.07 | 3228 | 2946 | 860.3 |
| D | 4 | 160 | 8104 | 6.0 | 3228 | 2946 | 860.3 |
| D | 10 | 113 | 8090 | 5.98 | 3228 | 2946 | 860.3 |
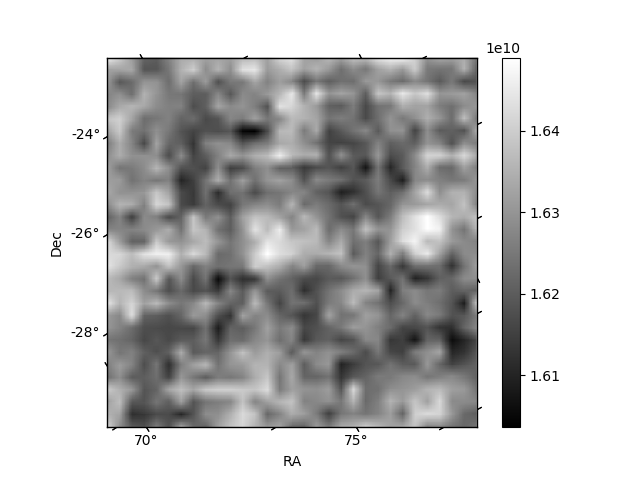
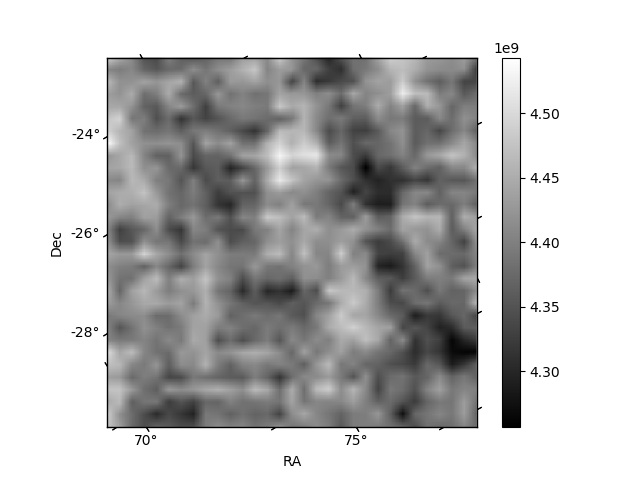
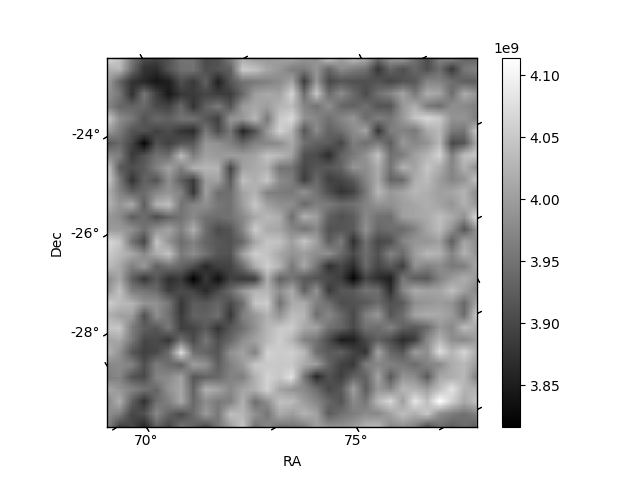
Histogram calculated using DETX and DETY for each event in the final _common_clean file
| Quadrant A |  |
 |
Quadrant B |
|---|---|---|---|
| Quadrant D |  |
 |
Quadrant C |
| Plot type | Count rate plots | Images |
|---|---|---|
| Comparison with Poisson distribution Blue bars denote a histogram of data divided into 1 sec bins. Red curve is a Poisson curve with rate = median count rate of data. |
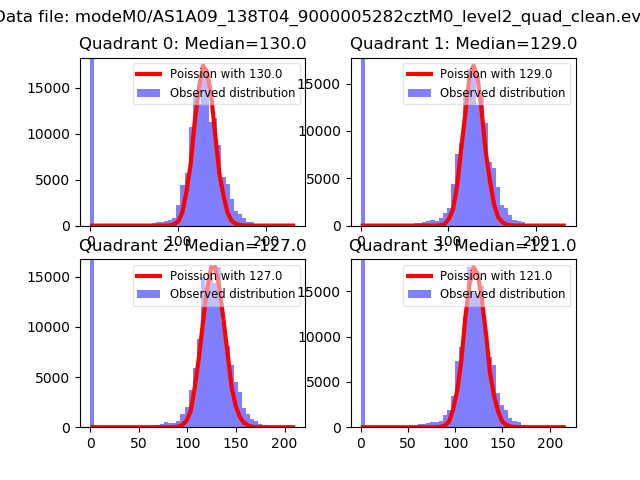 |
 |
| Quadrant-wise count rates Data is divided into 100 sec bins |
 |
|
| Module-wise count rates for Quadrant A Data is divided into 100 sec bins |
 |
 |
| Module-wise count rates for Quadrant B Data is divided into 100 sec bins |
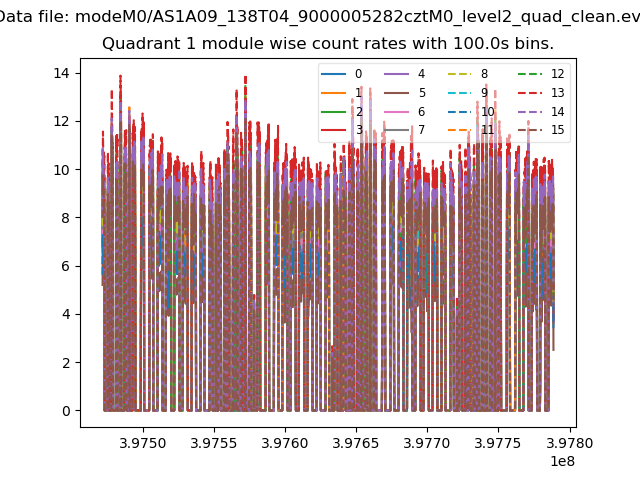 |
 |
| Module-wise count rates for Quadrant C Data is divided into 100 sec bins |
 |
 |
| Module-wise count rates for Quadrant D Data is divided into 100 sec bins |
 |
 |
| Parameter | Plot |
|---|---|
| CZT HV Monitor |  |
| D_VDD | 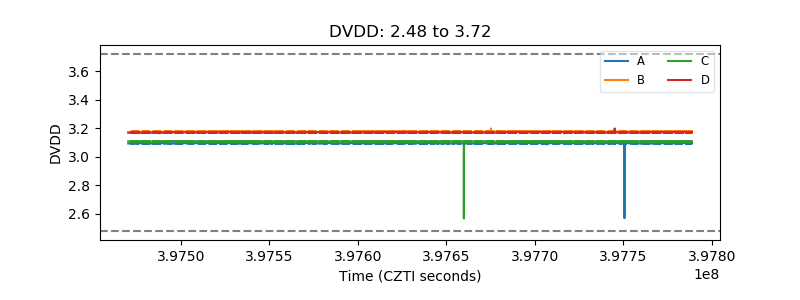 |
| Temperature 1 |  |
| Veto HV Monitor |  |
| Veto LLD |  |
| Alpha Counter |  |
| _CPM_Rate |  |
| CZT Counter |  |
| +2.5 Volts monitor |  |
| +5 Volts monitor |  |
| _ROLL_ROT |  |
| _Roll_DEC | 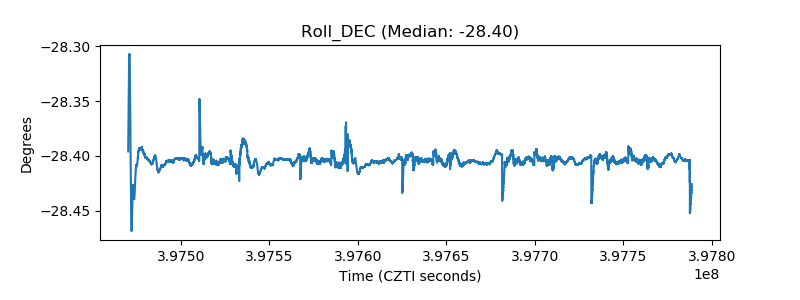 |
| _Roll_RA |  |
| Veto Counter |  |