| Param | Original file | Final file |
|---|---|---|
| Filename | modeM0/AS1A09_138T04_9000005282_37067cztM0_level2.evt | modeM0/AS1A09_138T04_9000005282_37067cztM0_level2_quad_clean.evt |
| Size (bytes) | 91,059,840 | 21,741,120 |
| Size | 86.8 MB | 20.7 MB |
| Events in quadrant A | 641,223 | 146,112 |
| Events in quadrant B | 690,789 | 146,702 |
| Events in quadrant C | 580,359 | 145,737 |
| Events in quadrant D | 769,593 | 137,486 |
| Mode SS | |||
|---|---|---|---|
| Quadrant | BADHDUFLAG | Total packets | Discarded packets |
| A | 0 | 20 | 0 |
| B | 0 | 20 | 0 |
| C | 0 | 20 | 0 |
| D | 0 | 20 | 0 |
| Mode M0 | |||
|---|---|---|---|
| Quadrant | BADHDUFLAG | Total packets | Discarded packets |
| A | 0 | 2540 | 2 |
| B | 0 | 2728 | 1 |
| C | 0 | 2309 | 1 |
| D | 0 | 2991 | 1 |
| Mode M9 | |||
|---|---|---|---|
| Quadrant | BADHDUFLAG | Total packets | Discarded packets |
| A | 0 | 16 | 0 |
| B | 0 | 16 | 0 |
| C | 0 | 16 | 0 |
| D | 0 | 16 | 0 |
| Quadrant | Total seconds | Saturated seconds | Saturation percentage |
|---|---|---|---|
| A | 1076 | 7 | 0.650558% |
| B | 1076 | 41 | 3.810409% |
| C | 1076 | 5 | 0.464684% |
| D | 1076 | 23 | 2.137546% |
Noise dominated data is calculated using 1-second bins in cleaned event files. If a bin has >2000 counts, and if more than 50% of those come from <1% of pixels, then it is considered to be noise-dominated and hence unusable.
| Quadrant | # 1 sec bins | Bins with >0 counts | Bins with >2000 counts | High rate bins dominated by noise | Noise dominated (total time) | Noise dominated (detector-on time) | Marked lightcurve |
|---|---|---|---|---|---|---|---|
| A | 1076 | 1076 | 4 | 4 | 0.37% | 0.37% | 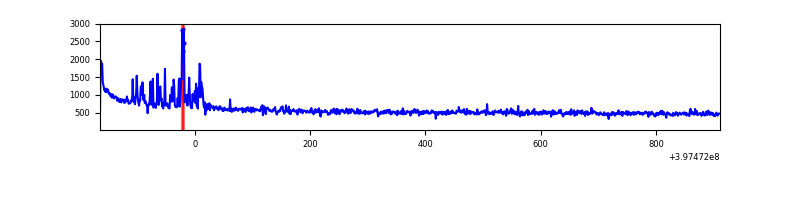 |
| B | 1076 | 1076 | 31 | 31 | 2.88% | 2.88% | 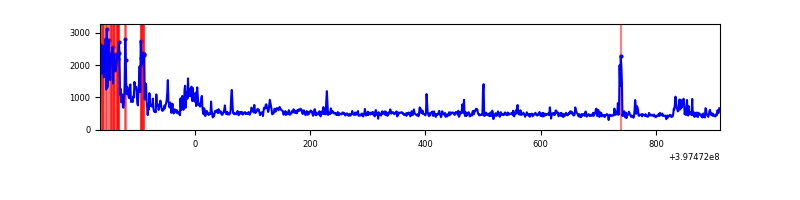 |
| C | 1076 | 1076 | 4 | 4 | 0.37% | 0.37% | 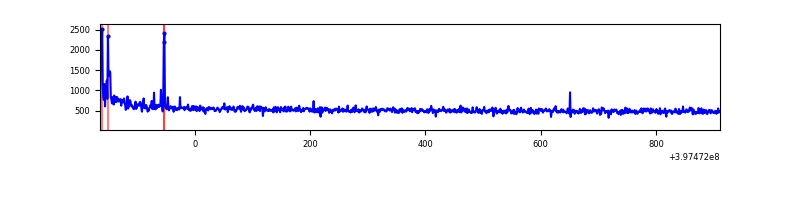 |
| D | 1076 | 1076 | 22 | 22 | 2.04% | 2.04% | 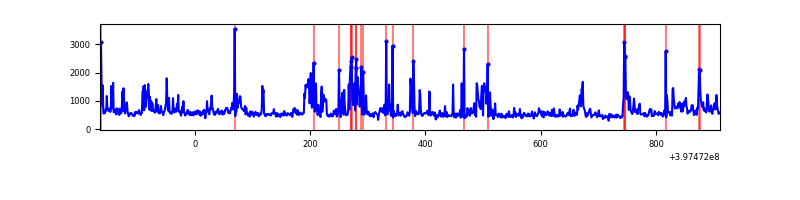 |
Top three noisy pixels from each quadrant. If the there are fewer than three noisy pixels in the level2.evt file, extra rows are filled as -1
| Pixel properties | Quadrant properties | ||||||
|---|---|---|---|---|---|---|---|
| Quadrant | DetID | PixID | Counts | Sigma | Mean | Median | Sigma |
| A | 10 | 83 | 89044 | 3169.08 | 131 | 128 | 28.1 |
| A | 7 | 3 | 35899 | 1274.93 | 131 | 128 | 28.1 |
| A | 9 | 143 | 6541 | 228.57 | 131 | 128 | 28.1 |
| B | 5 | 184 | 128237 | 4936.39 | 126 | 122 | 26.0 |
| B | 5 | 172 | 35287 | 1354.94 | 126 | 122 | 26.0 |
| B | 0 | 229 | 18548 | 709.97 | 126 | 122 | 26.0 |
| C | 15 | 214 | 50586 | 1611.27 | 127 | 128 | 31.3 |
| C | 0 | 10 | 31871 | 1013.65 | 127 | 128 | 31.3 |
| C | 2 | 16 | 920 | 25.29 | 127 | 128 | 31.3 |
| D | 1 | 47 | 87247 | 2773.41 | 127 | 124 | 31.4 |
| D | 12 | 17 | 54316 | 1725.11 | 127 | 124 | 31.4 |
| D | 4 | 239 | 26970 | 854.59 | 127 | 124 | 31.4 |
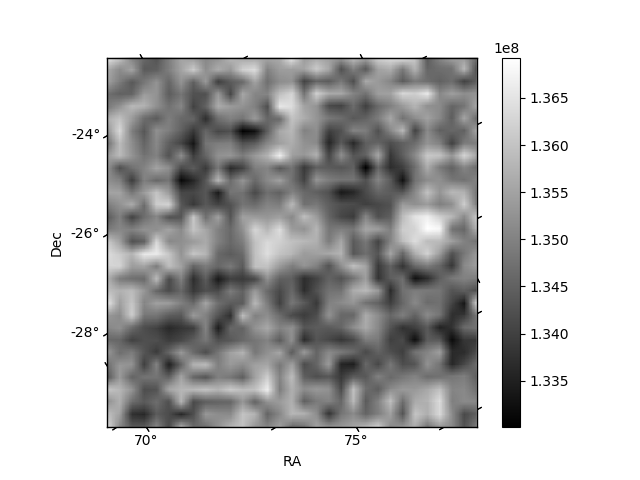
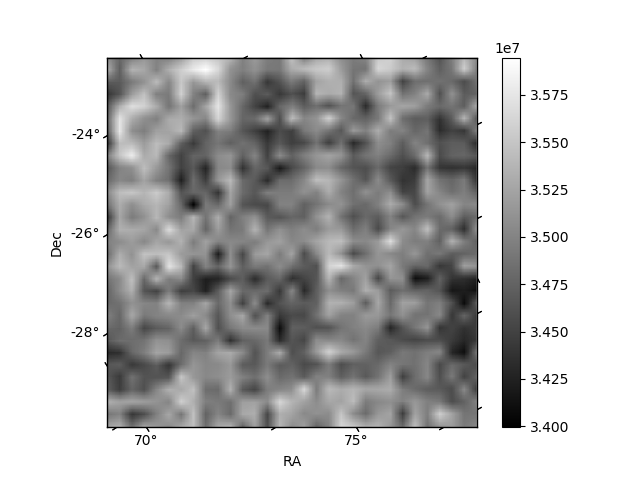
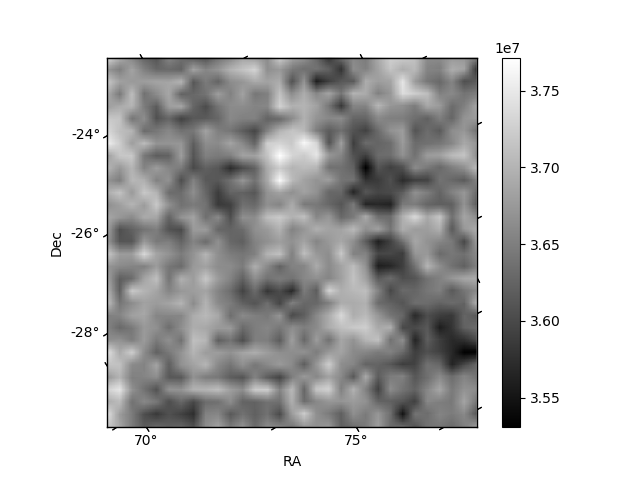
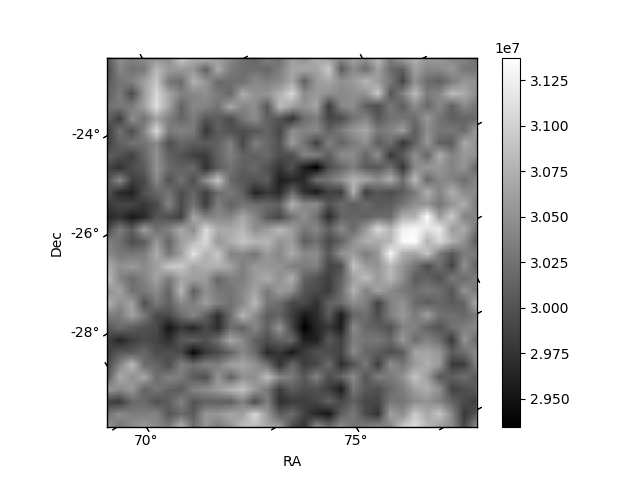
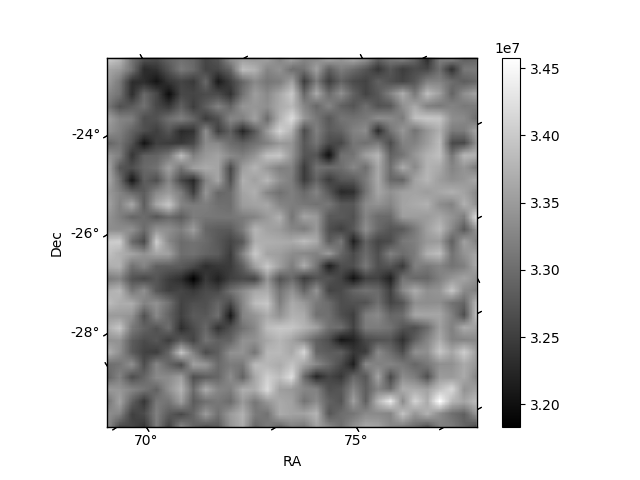
Histogram calculated using DETX and DETY for each event in the final _common_clean file
| Quadrant A | 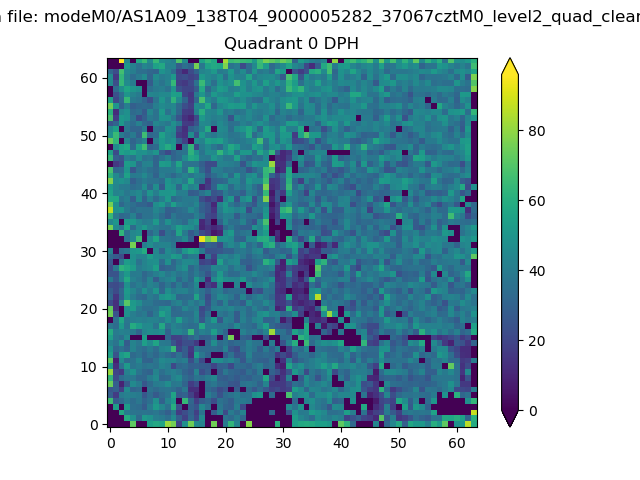 |
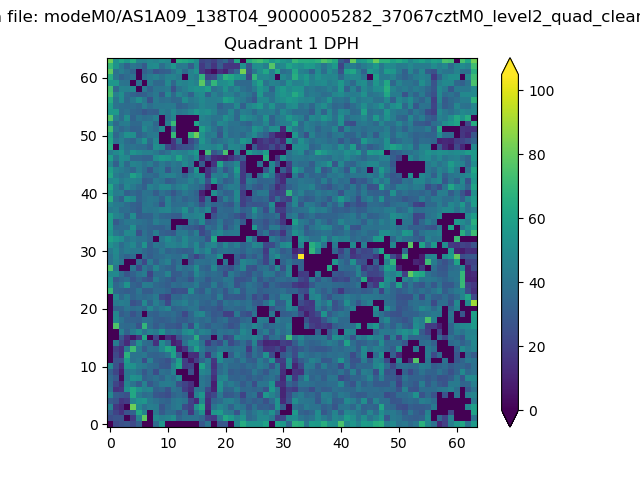 |
Quadrant B |
|---|---|---|---|
| Quadrant D | 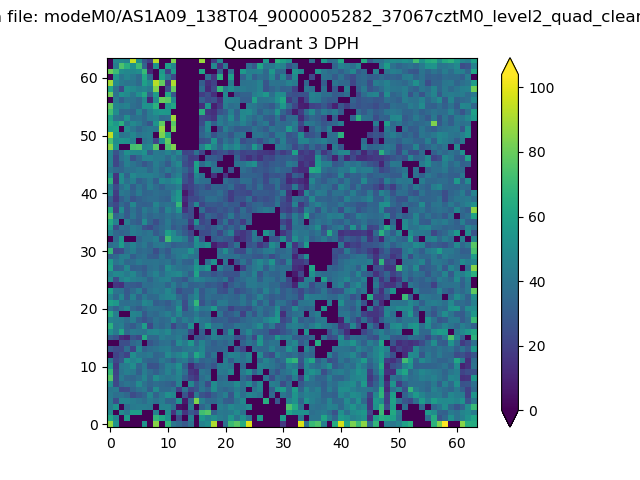 |
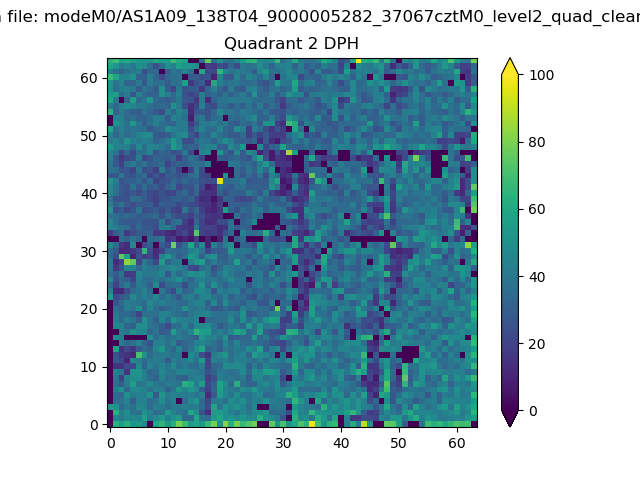 |
Quadrant C |
| Plot type | Count rate plots | Images |
|---|---|---|
| Comparison with Poisson distribution Blue bars denote a histogram of data divided into 1 sec bins. Red curve is a Poisson curve with rate = median count rate of data. |
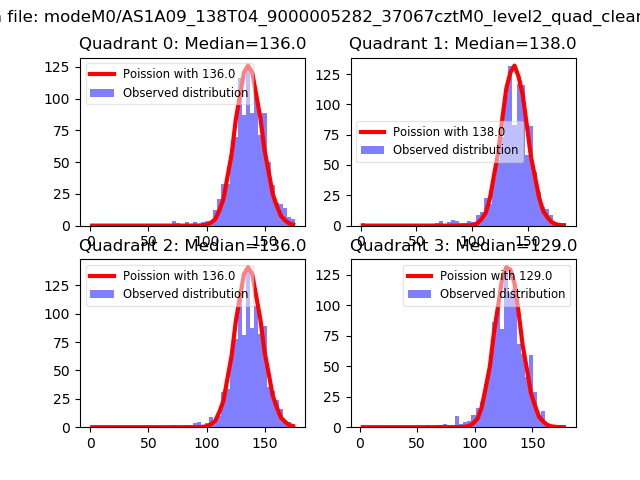 |
 |
| Quadrant-wise count rates Data is divided into 100 sec bins |
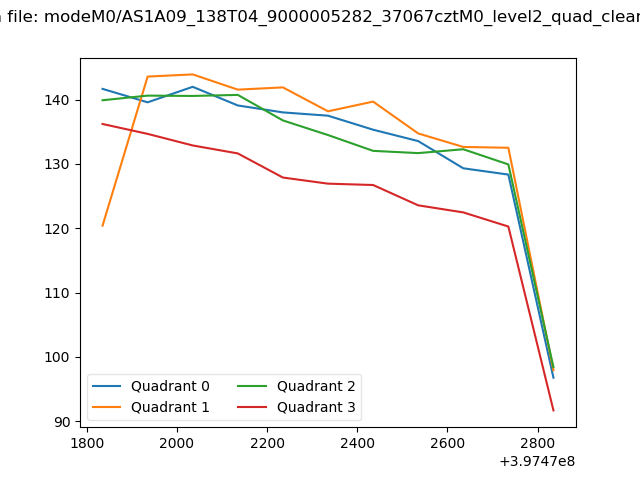 |
|
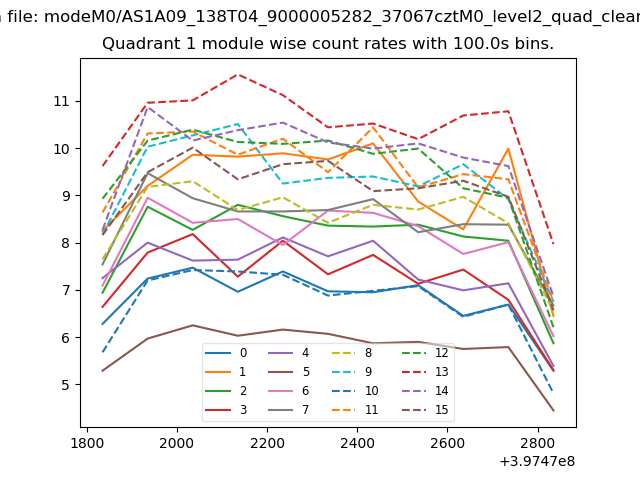
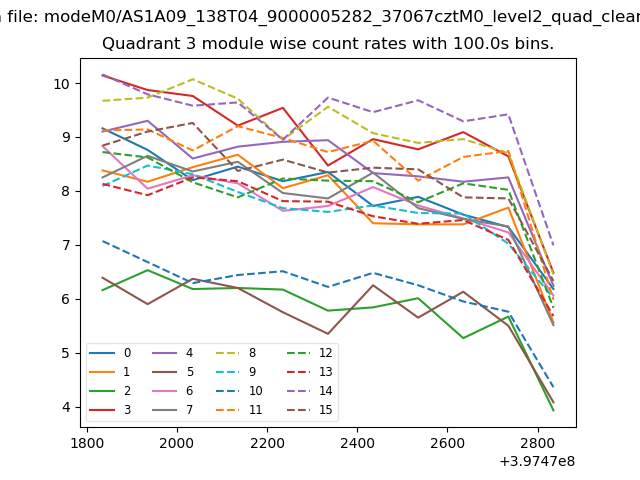
| Module-wise count rates for Quadrant A Data is divided into 100 sec bins |
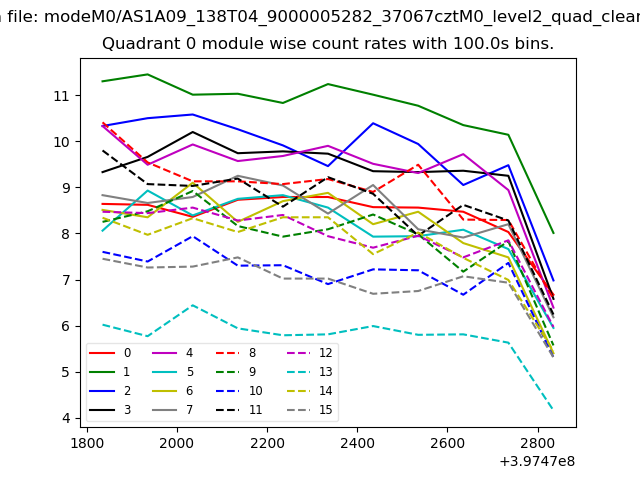 |
 |
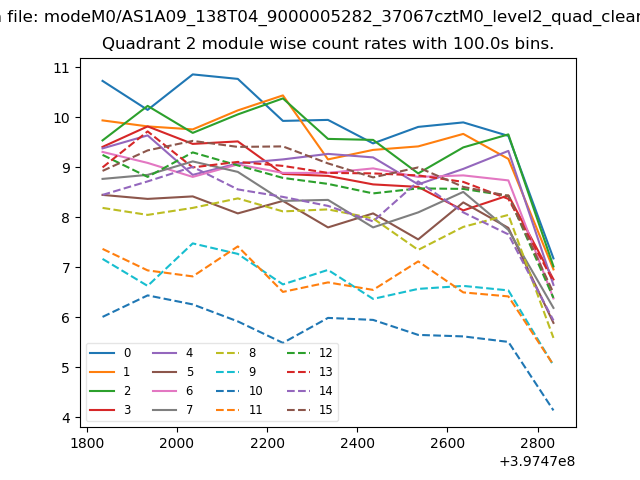
| Module-wise count rates for Quadrant B Data is divided into 100 sec bins |
 |
 |
| Module-wise count rates for Quadrant C Data is divided into 100 sec bins |
 |
 |
| Module-wise count rates for Quadrant D Data is divided into 100 sec bins |
 |
 |
| Parameter | Plot |
|---|---|
| CZT HV Monitor | 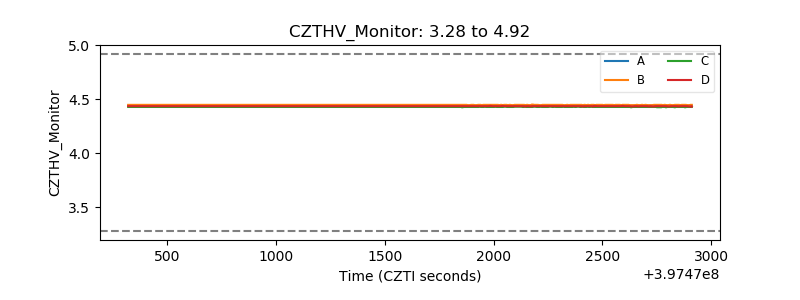 |
| D_VDD | 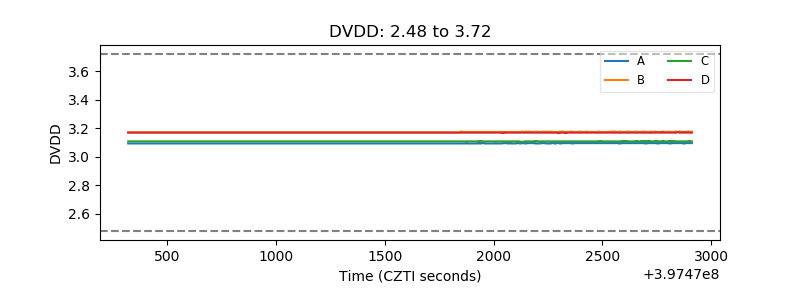 |
| Temperature 1 | 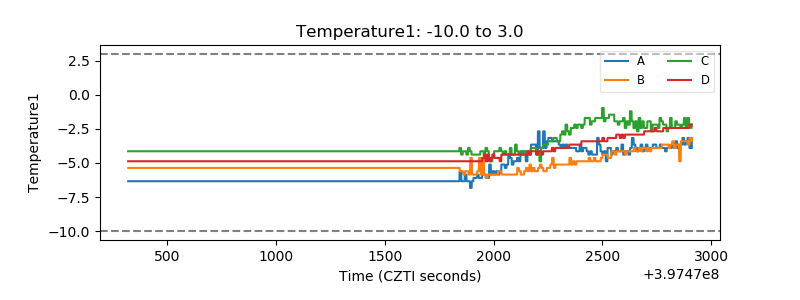 |
| Veto HV Monitor |  |
| Veto LLD | 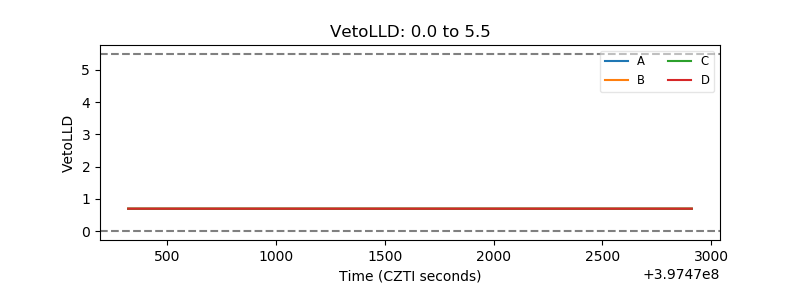 |
| Alpha Counter | 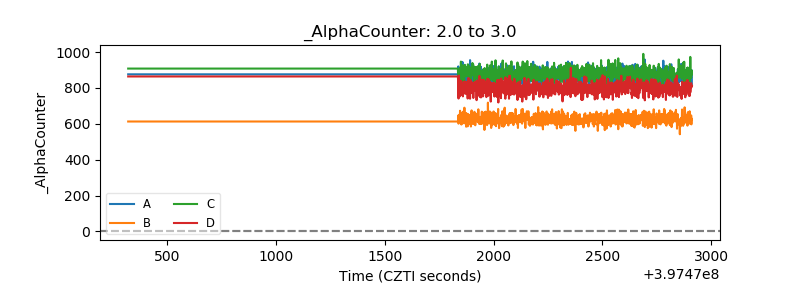 |
| _CPM_Rate | 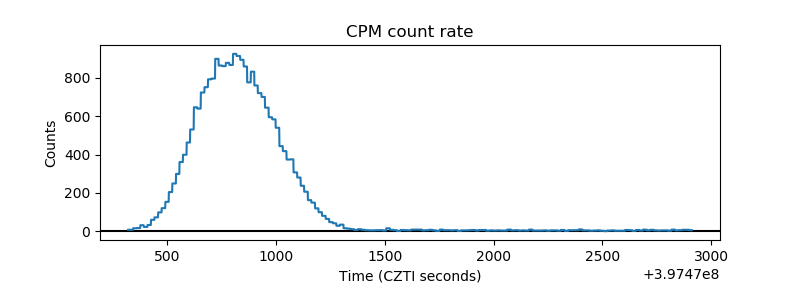 |
| CZT Counter | 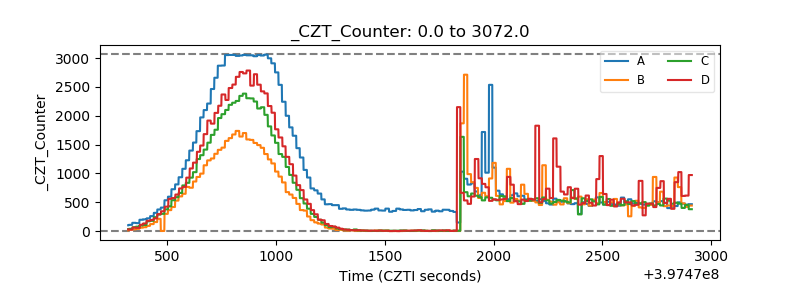 |
| +2.5 Volts monitor | 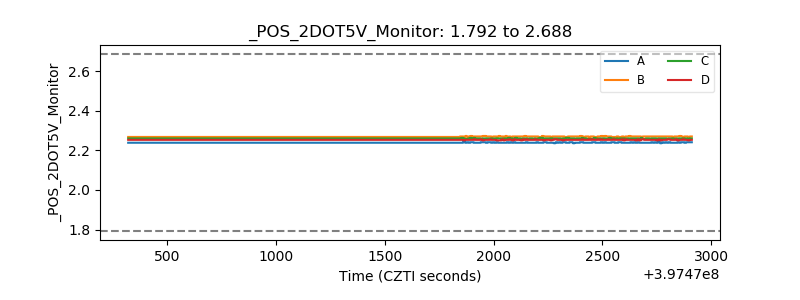 |
| +5 Volts monitor | 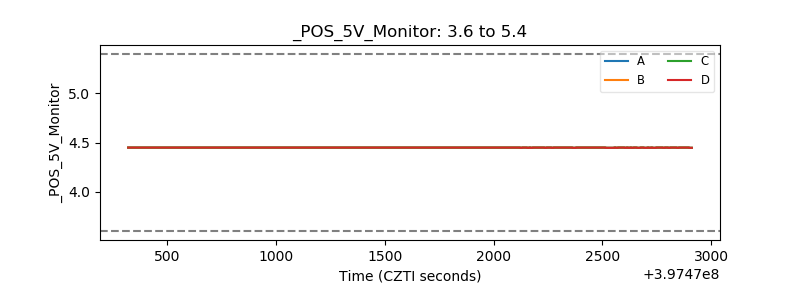 |
| _ROLL_ROT | 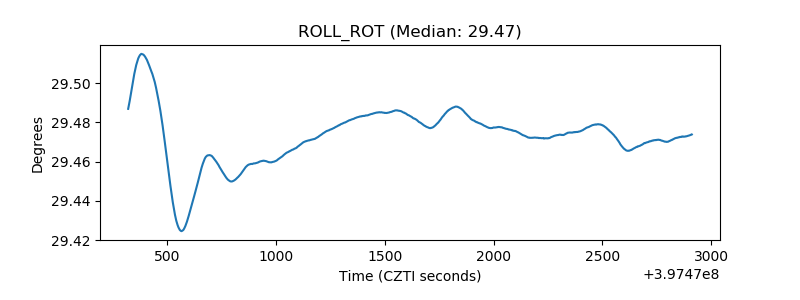 |
| _Roll_DEC | 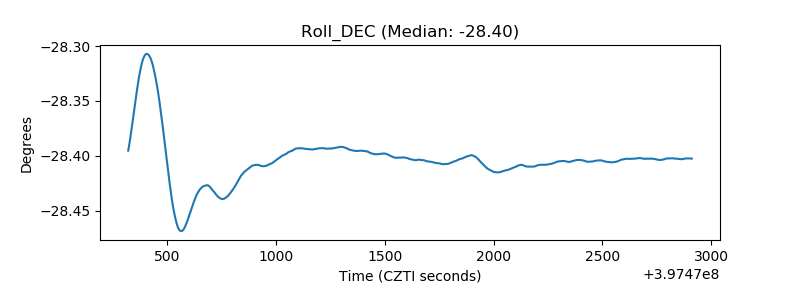 |
| _Roll_RA | 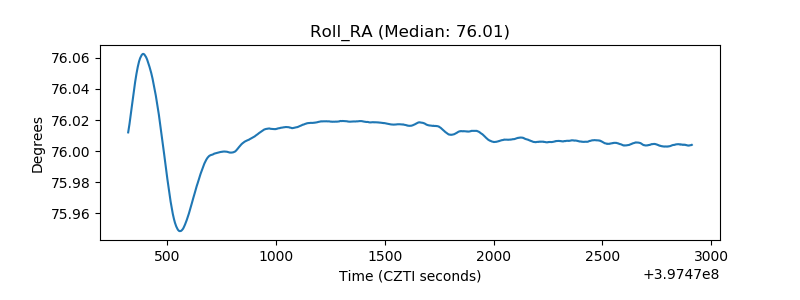 |
| Veto Counter | 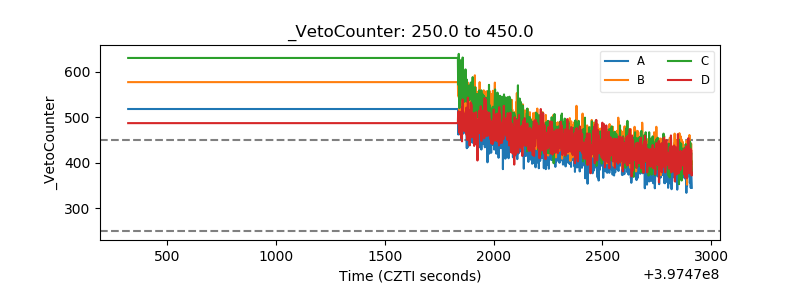 |