| Param | Original file | Final file |
|---|---|---|
| Filename | modeM0/AS1A09_138T04_9000005282_37069cztM0_level2.evt | modeM0/AS1A09_138T04_9000005282_37069cztM0_level2_quad_clean.evt |
| Size (bytes) | 513,336,960 | 70,617,600 |
| Size | 489.6 MB | 67.3 MB |
| Events in quadrant A | 2,991,631 | 451,243 |
| Events in quadrant B | 4,684,987 | 439,749 |
| Events in quadrant C | 2,912,417 | 442,744 |
| Events in quadrant D | 4,582,184 | 417,170 |
| Mode SS | |||
|---|---|---|---|
| Quadrant | BADHDUFLAG | Total packets | Discarded packets |
| A | 0 | 112 | 0 |
| B | 0 | 112 | 0 |
| C | 0 | 112 | 0 |
| D | 0 | 112 | 0 |
| Mode M0 | |||
|---|---|---|---|
| Quadrant | BADHDUFLAG | Total packets | Discarded packets |
| A | 0 | 12098 | 3 |
| B | 0 | 17491 | 2 |
| C | 0 | 11782 | 2 |
| D | 0 | 17271 | 2 |
| Mode M9 | |||
|---|---|---|---|
| Quadrant | BADHDUFLAG | Total packets | Discarded packets |
| A | 0 | 21 | 0 |
| B | 0 | 21 | 0 |
| C | 0 | 21 | 0 |
| D | 0 | 22 | 0 |
| Quadrant | Total seconds | Saturated seconds | Saturation percentage |
|---|---|---|---|
| A | 5536 | 16 | 0.289017% |
| B | 5536 | 652 | 11.777457% |
| C | 5536 | 39 | 0.704480% |
| D | 5536 | 333 | 6.015173% |
Noise dominated data is calculated using 1-second bins in cleaned event files. If a bin has >2000 counts, and if more than 50% of those come from <1% of pixels, then it is considered to be noise-dominated and hence unusable.
| Quadrant | # 1 sec bins | Bins with >0 counts | Bins with >2000 counts | High rate bins dominated by noise | Noise dominated (total time) | Noise dominated (detector-on time) | Marked lightcurve |
|---|---|---|---|---|---|---|---|
| A | 7330 | 5537 | 5 | 5 | 0.07% | 0.09% | 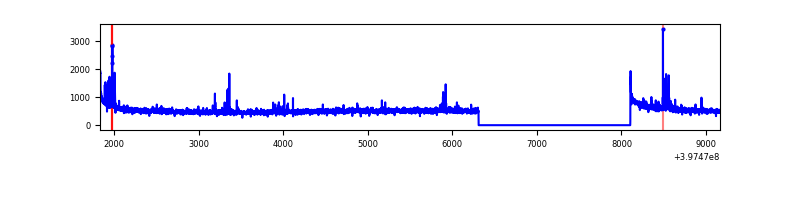 |
| B | 7330 | 5537 | 501 | 501 | 6.83% | 9.05% | 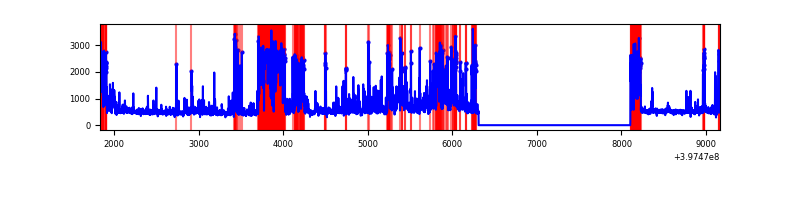 |
| C | 7330 | 5537 | 31 | 31 | 0.42% | 0.56% | 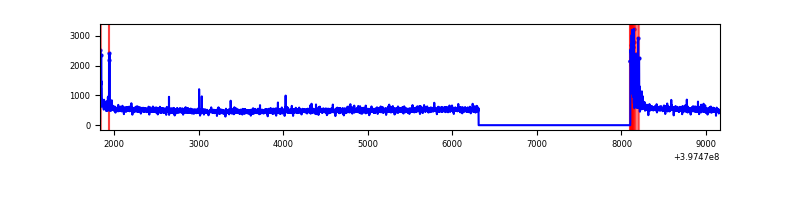 |
| D | 7330 | 5537 | 291 | 291 | 3.97% | 5.26% | 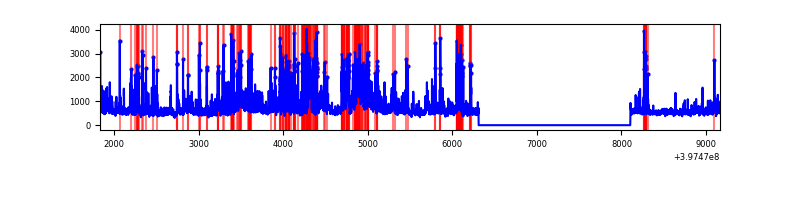 |
Top three noisy pixels from each quadrant. If the there are fewer than three noisy pixels in the level2.evt file, extra rows are filled as -1
| Pixel properties | Quadrant properties | ||||||
|---|---|---|---|---|---|---|---|
| Quadrant | DetID | PixID | Counts | Sigma | Mean | Median | Sigma |
| A | 10 | 83 | 269817 | 1980.79 | 674 | 662 | 135.9 |
| A | 7 | 3 | 89437 | 653.32 | 674 | 662 | 135.9 |
| A | 9 | 143 | 15993 | 112.83 | 674 | 662 | 135.9 |
| B | 5 | 184 | 1826450 | 15102.56 | 632 | 618 | 120.9 |
| B | 0 | 229 | 178550 | 1471.78 | 632 | 618 | 120.9 |
| B | 5 | 172 | 116585 | 959.23 | 632 | 618 | 120.9 |
| C | 15 | 214 | 238417 | 1582.6 | 646 | 649 | 150.2 |
| C | 0 | 10 | 145111 | 961.55 | 646 | 649 | 150.2 |
| C | 0 | 207 | 6624 | 39.77 | 646 | 649 | 150.2 |
| D | 12 | 17 | 731231 | 4725.1 | 641 | 624 | 154.6 |
| D | 1 | 47 | 343677 | 2218.65 | 641 | 624 | 154.6 |
| D | 1 | 52 | 241397 | 1557.17 | 641 | 624 | 154.6 |
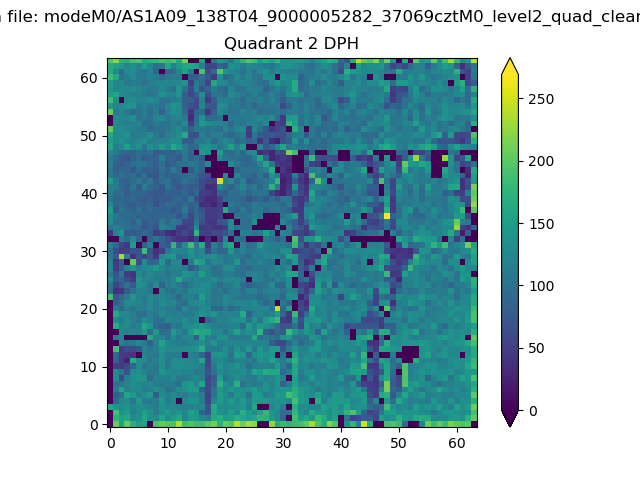
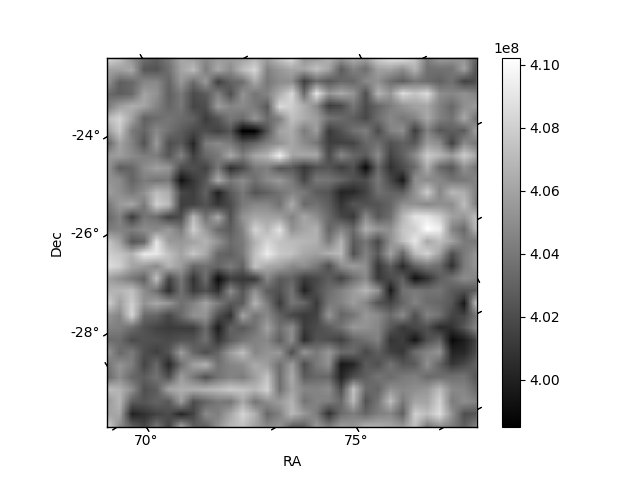
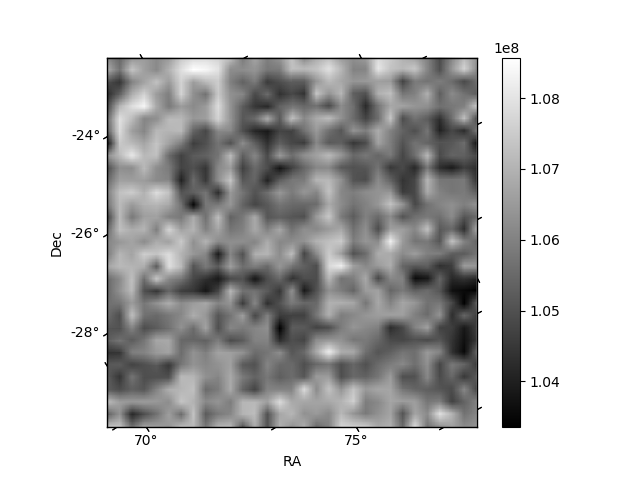
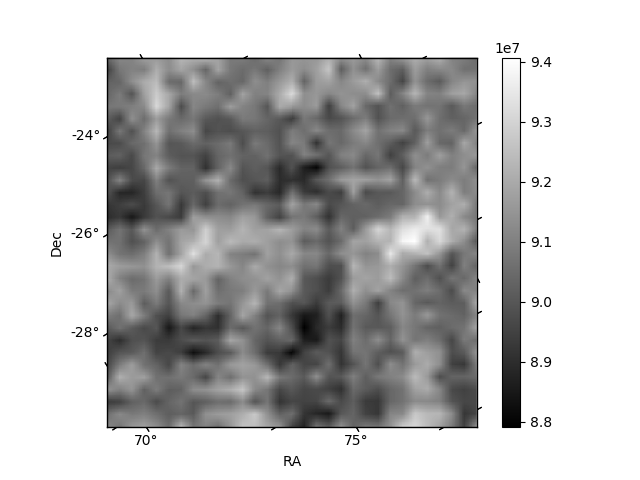
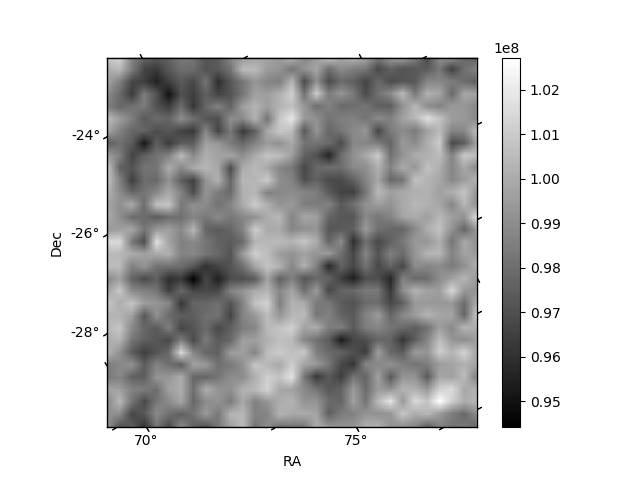
Histogram calculated using DETX and DETY for each event in the final _common_clean file
| Quadrant A | 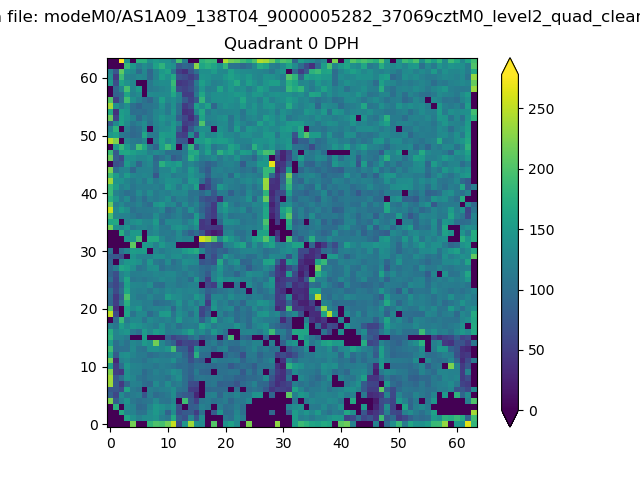 |
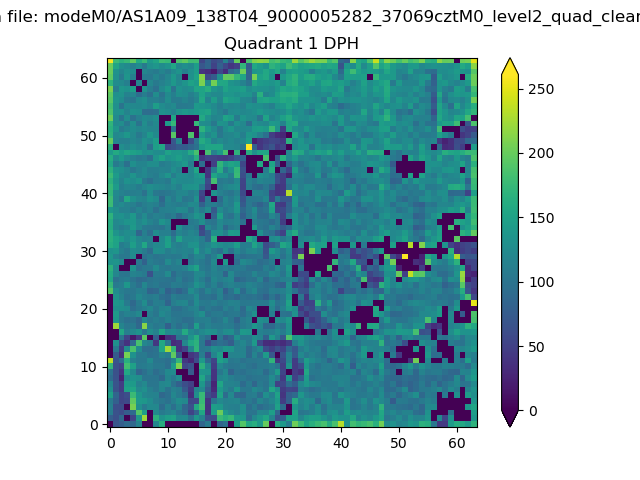 |
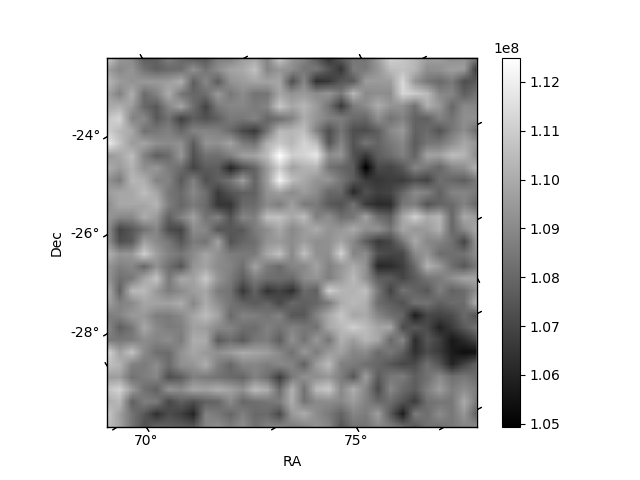
Quadrant B |
|---|---|---|---|
| Quadrant D | 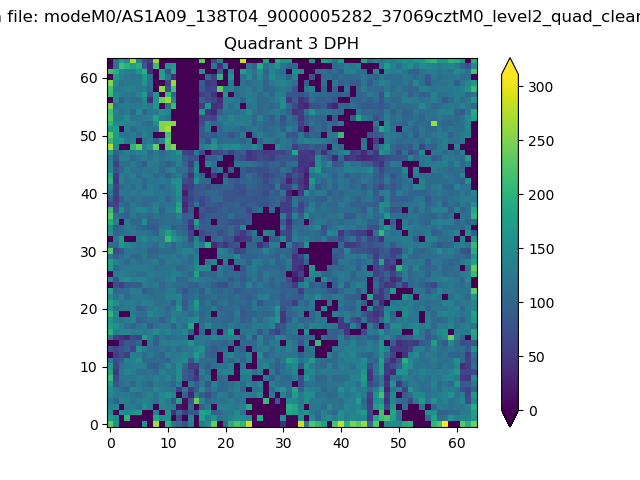 |
 |
Quadrant C |
| Plot type | Count rate plots | Images |
|---|---|---|
| Comparison with Poisson distribution Blue bars denote a histogram of data divided into 1 sec bins. Red curve is a Poisson curve with rate = median count rate of data. |
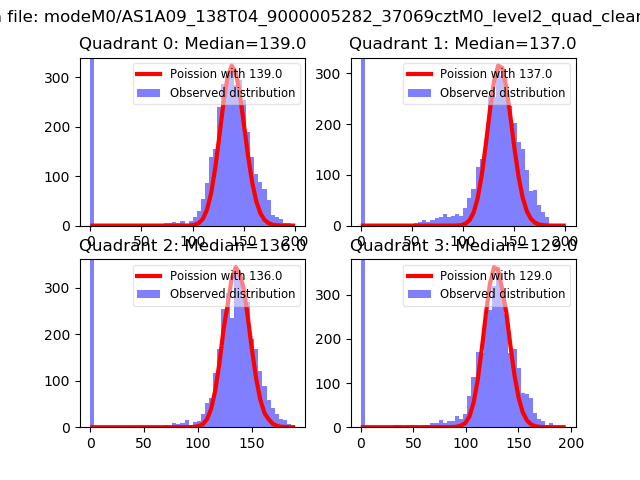 |
 |
| Quadrant-wise count rates Data is divided into 100 sec bins |
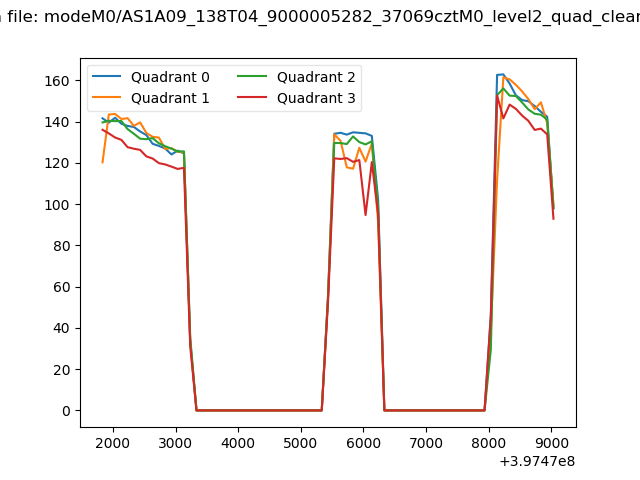 |
|
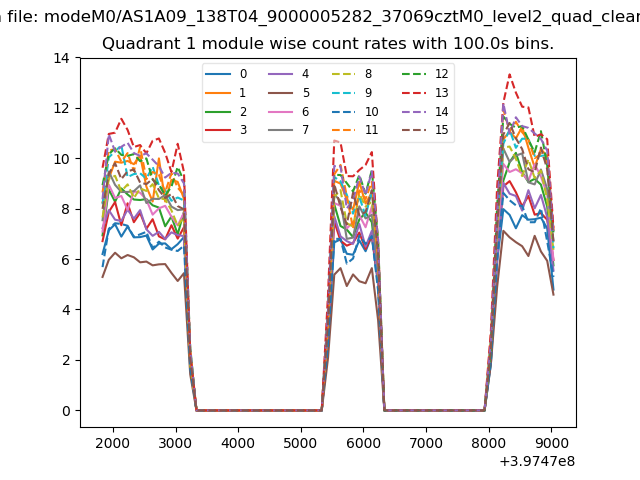
| Module-wise count rates for Quadrant A Data is divided into 100 sec bins |
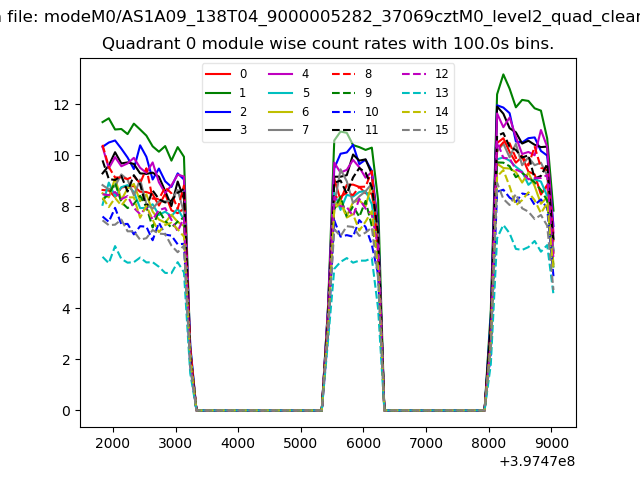 |
 |
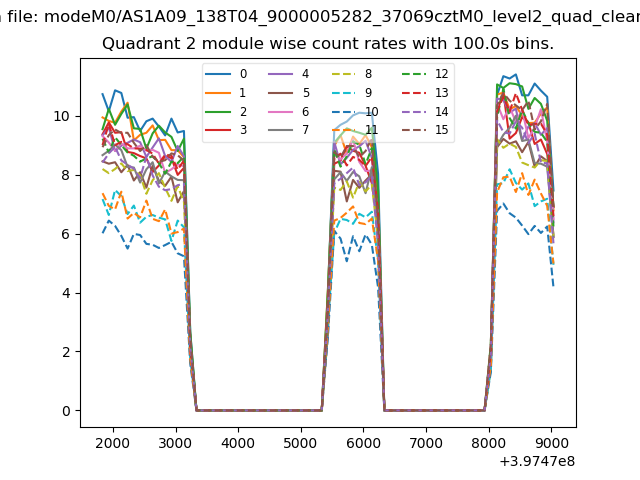
| Module-wise count rates for Quadrant B Data is divided into 100 sec bins |
 |
 |
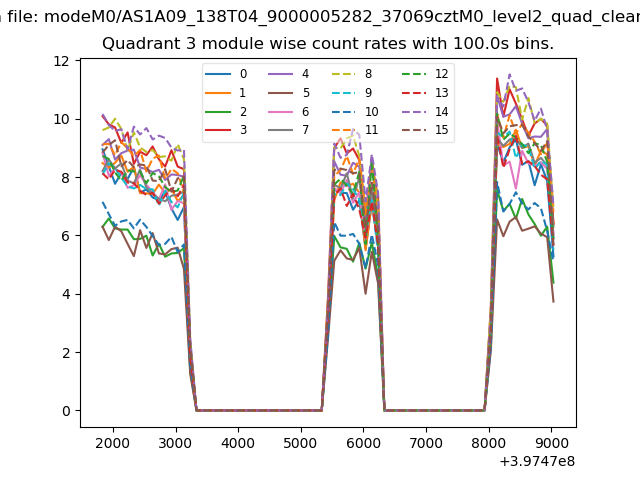
| Module-wise count rates for Quadrant C Data is divided into 100 sec bins |
 |
 |
| Module-wise count rates for Quadrant D Data is divided into 100 sec bins |
 |
 |
| Parameter | Plot |
|---|---|
| CZT HV Monitor | 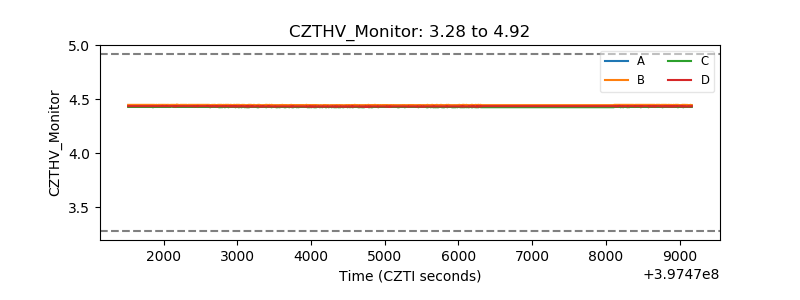 |
| D_VDD | 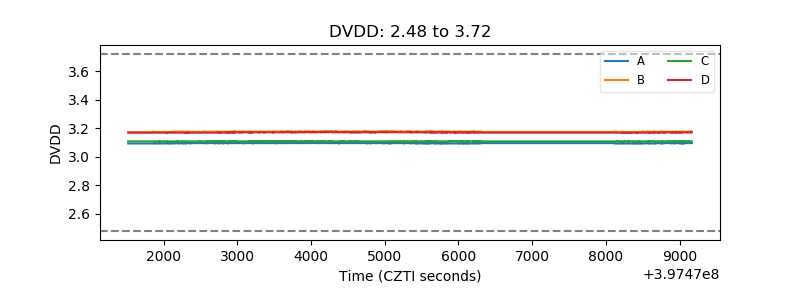 |
| Temperature 1 | 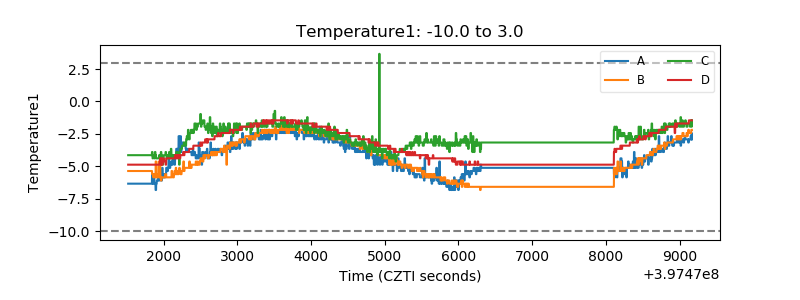 |
| Veto HV Monitor | 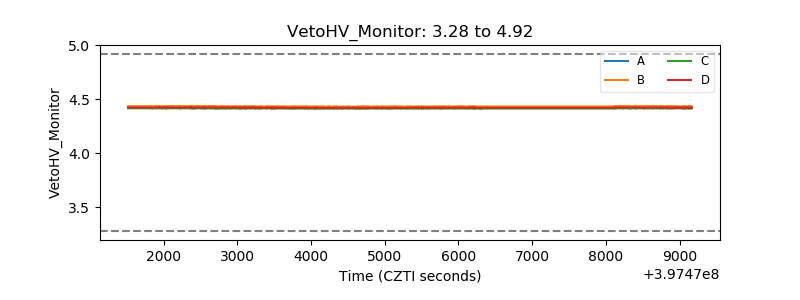 |
| Veto LLD | 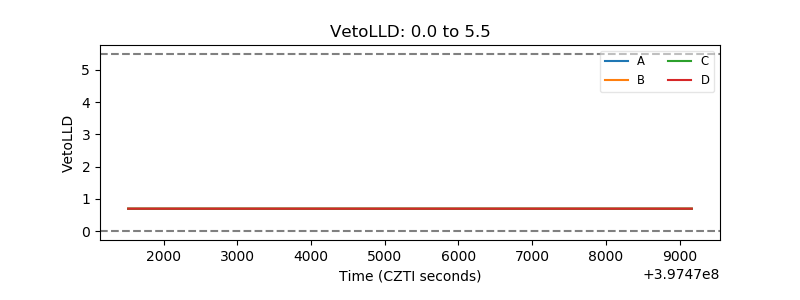 |
| Alpha Counter | 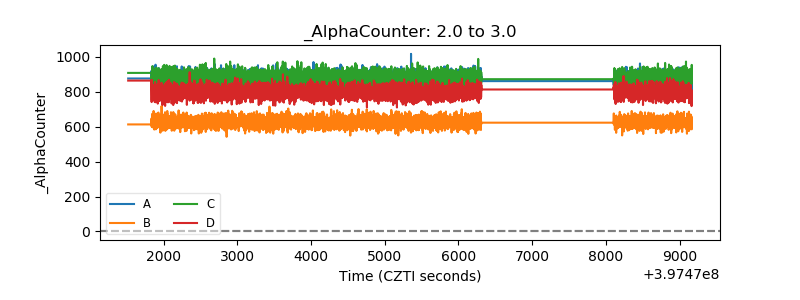 |
| _CPM_Rate | 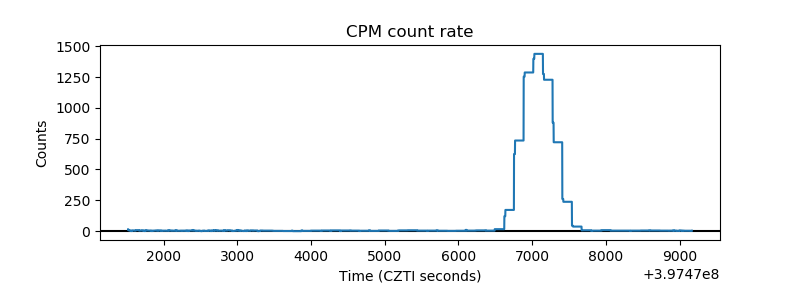 |
| CZT Counter | 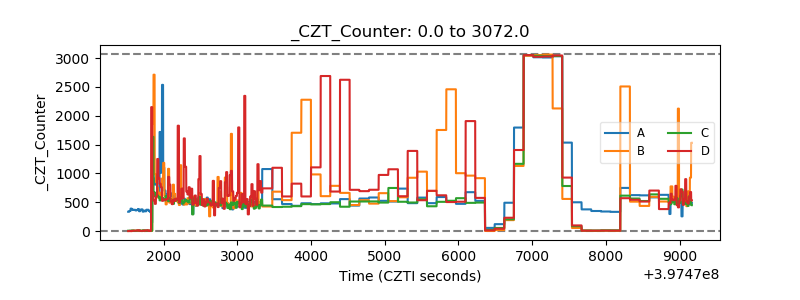 |
| +2.5 Volts monitor | 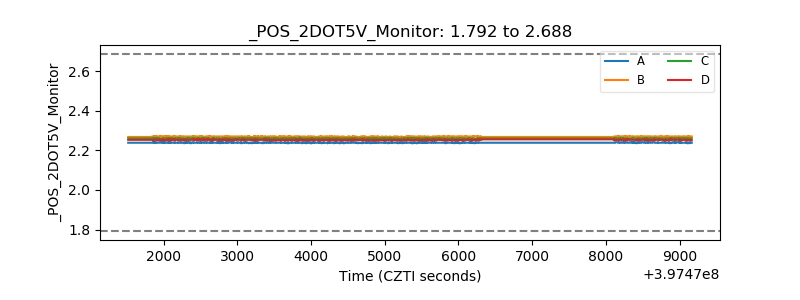 |
| +5 Volts monitor | 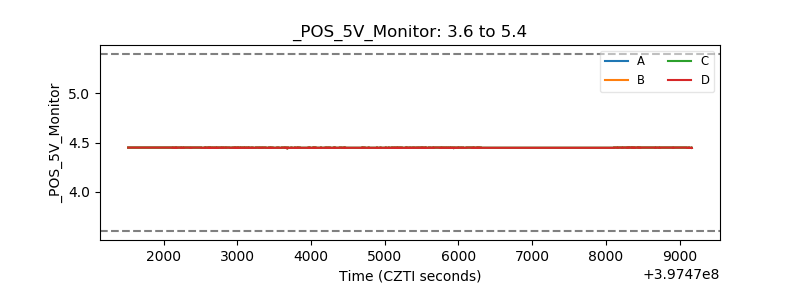 |
| _ROLL_ROT | 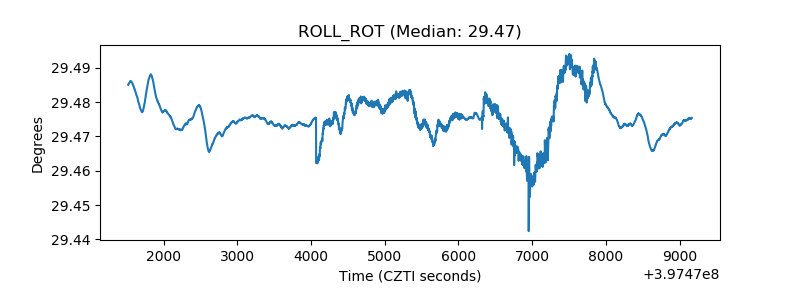 |
| _Roll_DEC | 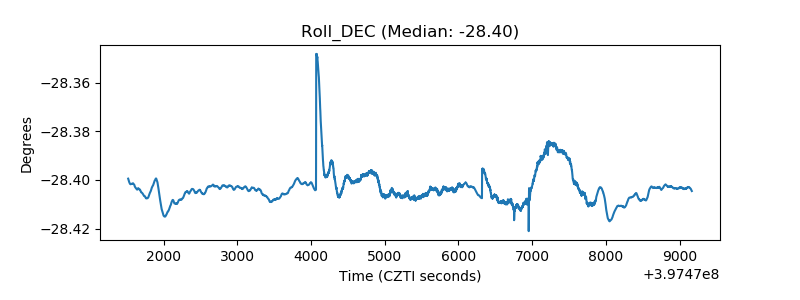 |
| _Roll_RA | 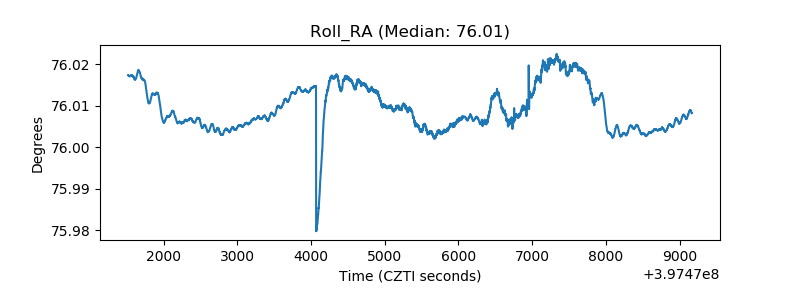 |
| Veto Counter | 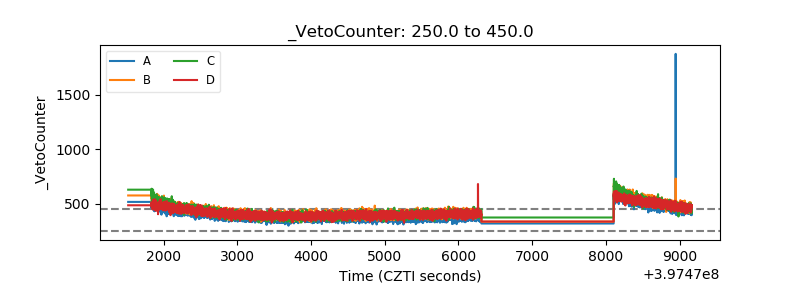 |