| Param | Original file | Final file |
|---|---|---|
| Filename | modeM0/AS1A09_138T04_9000005282_37070cztM0_level2.evt | modeM0/AS1A09_138T04_9000005282_37070cztM0_level2_quad_clean.evt |
| Size (bytes) | 528,295,680 | 63,679,680 |
| Size | 503.8 MB | 60.7 MB |
| Events in quadrant A | 2,995,840 | 402,628 |
| Events in quadrant B | 3,800,666 | 398,120 |
| Events in quadrant C | 3,242,741 | 383,219 |
| Events in quadrant D | 5,593,680 | 364,982 |
| Mode SS | |||
|---|---|---|---|
| Quadrant | BADHDUFLAG | Total packets | Discarded packets |
| A | 0 | 112 | 0 |
| B | 0 | 112 | 0 |
| C | 0 | 112 | 0 |
| D | 0 | 112 | 0 |
| Mode M0 | |||
|---|---|---|---|
| Quadrant | BADHDUFLAG | Total packets | Discarded packets |
| A | 0 | 12051 | 3 |
| B | 0 | 14527 | 2 |
| C | 0 | 12848 | 2 |
| D | 0 | 20287 | 2 |
| Mode M9 | |||
|---|---|---|---|
| Quadrant | BADHDUFLAG | Total packets | Discarded packets |
| A | 0 | 22 | 0 |
| B | 0 | 22 | 0 |
| C | 0 | 22 | 0 |
| D | 0 | 23 | 0 |
| Quadrant | Total seconds | Saturated seconds | Saturation percentage |
|---|---|---|---|
| A | 5408 | 10 | 0.184911% |
| B | 5408 | 329 | 6.083580% |
| C | 5408 | 79 | 1.460799% |
| D | 5408 | 429 | 7.932692% |
Noise dominated data is calculated using 1-second bins in cleaned event files. If a bin has >2000 counts, and if more than 50% of those come from <1% of pixels, then it is considered to be noise-dominated and hence unusable.
| Quadrant | # 1 sec bins | Bins with >0 counts | Bins with >2000 counts | High rate bins dominated by noise | Noise dominated (total time) | Noise dominated (detector-on time) | Marked lightcurve |
|---|---|---|---|---|---|---|---|
| A | 7351 | 5409 | 2 | 2 | 0.03% | 0.04% | 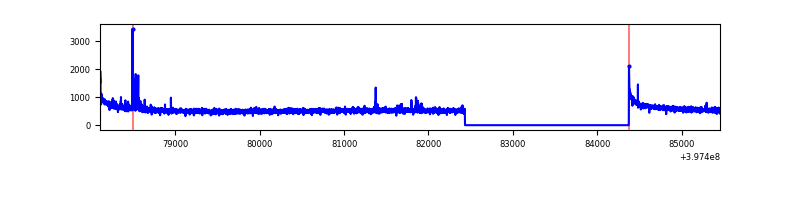 |
| B | 7350 | 5408 | 243 | 243 | 3.31% | 4.49% | 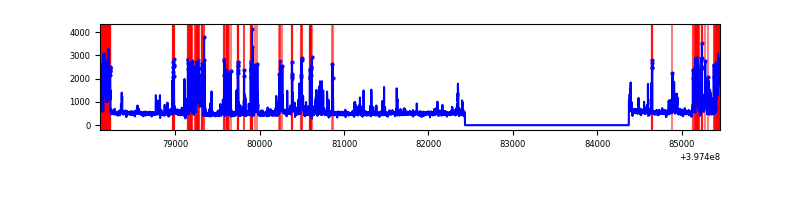 |
| C | 7351 | 5409 | 67 | 67 | 0.91% | 1.24% | 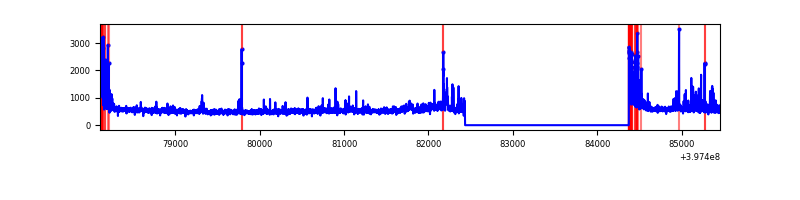 |
| D | 7351 | 5409 | 450 | 450 | 6.12% | 8.32% | 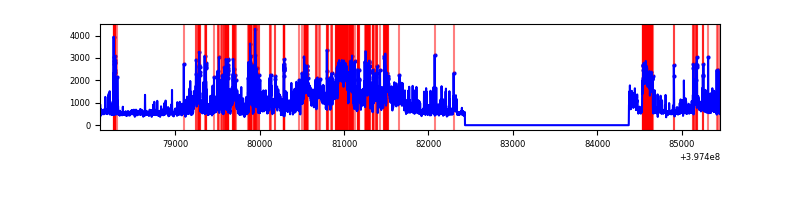 |
Top three noisy pixels from each quadrant. If the there are fewer than three noisy pixels in the level2.evt file, extra rows are filled as -1
| Pixel properties | Quadrant properties | ||||||
|---|---|---|---|---|---|---|---|
| Quadrant | DetID | PixID | Counts | Sigma | Mean | Median | Sigma |
| A | 10 | 83 | 265104 | 1923.65 | 692 | 680 | 137.5 |
| A | 7 | 3 | 39435 | 281.94 | 692 | 680 | 137.5 |
| A | 9 | 143 | 12678 | 87.28 | 692 | 680 | 137.5 |
| B | 5 | 184 | 547773 | 4340.39 | 664 | 648 | 126.1 |
| B | 5 | 172 | 511917 | 4055.94 | 664 | 648 | 126.1 |
| B | 5 | 255 | 49311 | 386.05 | 664 | 648 | 126.1 |
| C | 0 | 10 | 389976 | 2571.72 | 653 | 658 | 151.4 |
| C | 15 | 214 | 231112 | 1522.31 | 653 | 658 | 151.4 |
| C | 1 | 23 | 50722 | 330.71 | 653 | 658 | 151.4 |
| D | 6 | 112 | 1602253 | 10122.57 | 655 | 640 | 158.2 |
| D | 1 | 47 | 360288 | 2273.06 | 655 | 640 | 158.2 |
| D | 1 | 20 | 253471 | 1597.95 | 655 | 640 | 158.2 |
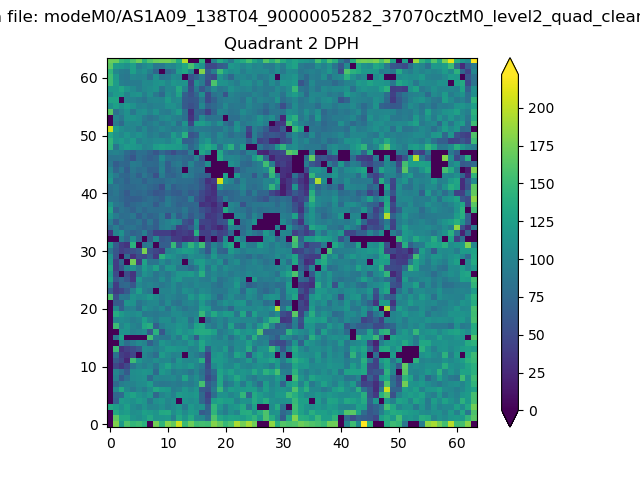
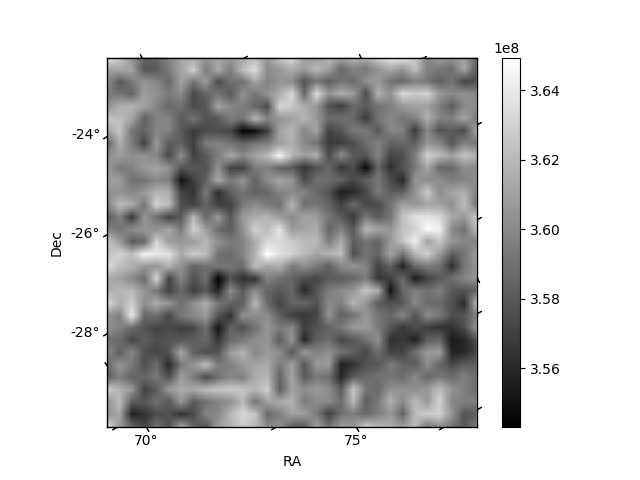
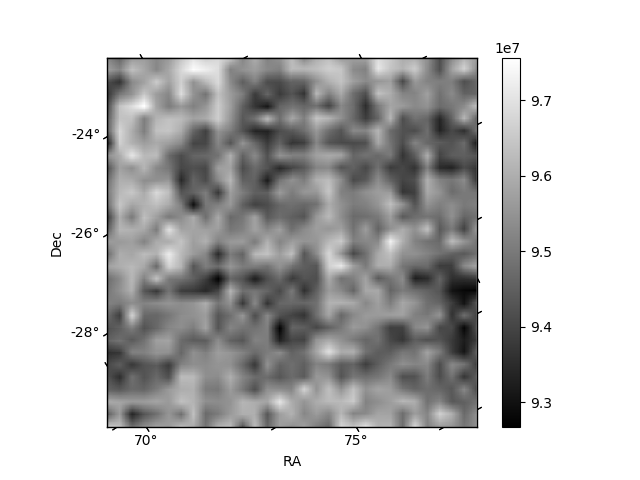
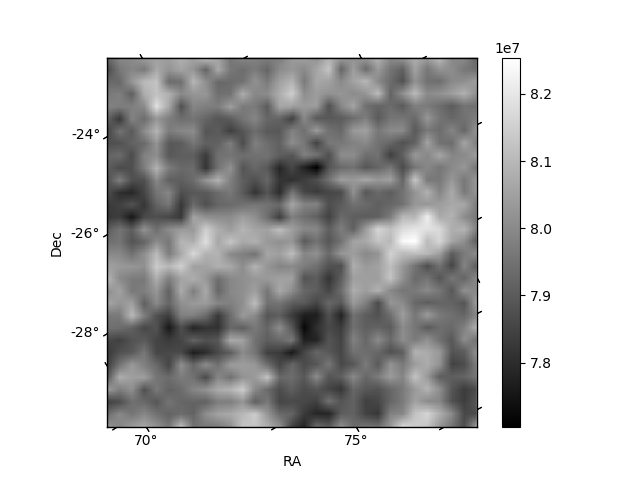
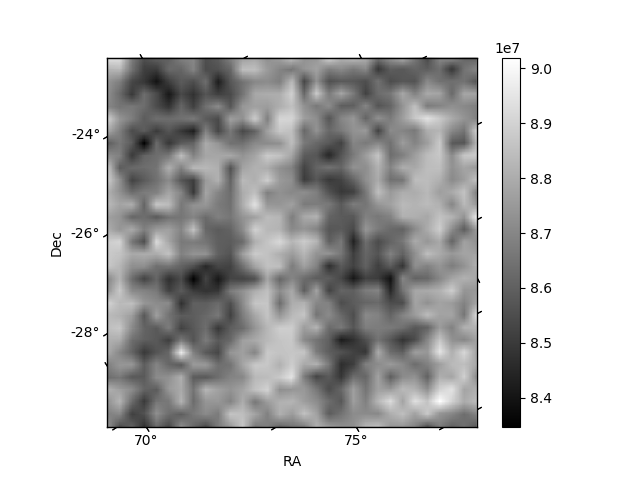
Histogram calculated using DETX and DETY for each event in the final _common_clean file
| Quadrant A | 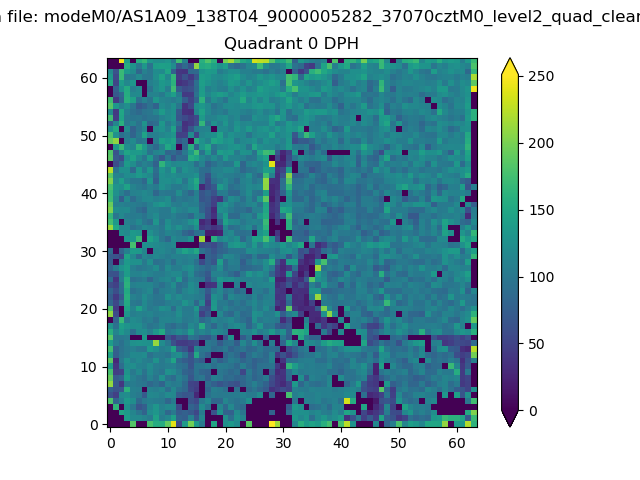 |
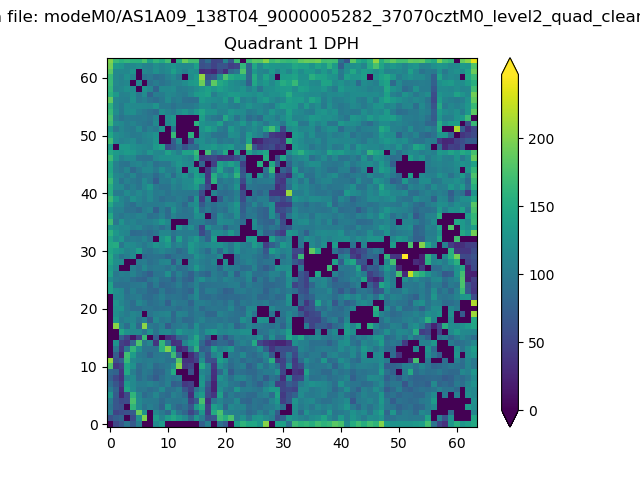 |
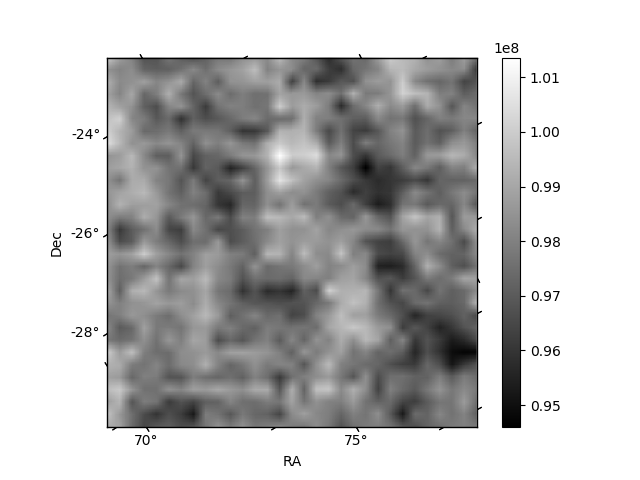
Quadrant B |
|---|---|---|---|
| Quadrant D | 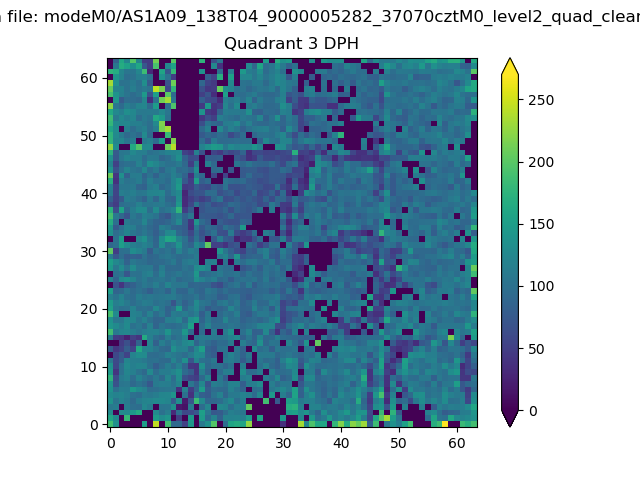 |
 |
Quadrant C |
| Plot type | Count rate plots | Images |
|---|---|---|
| Comparison with Poisson distribution Blue bars denote a histogram of data divided into 1 sec bins. Red curve is a Poisson curve with rate = median count rate of data. |
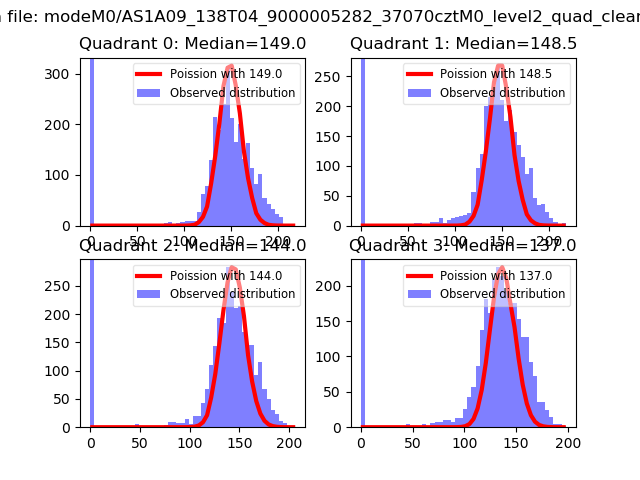 |
 |
| Quadrant-wise count rates Data is divided into 100 sec bins |
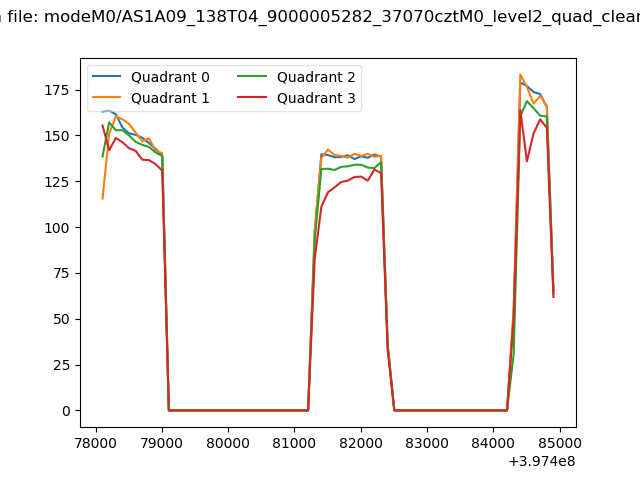 |
|
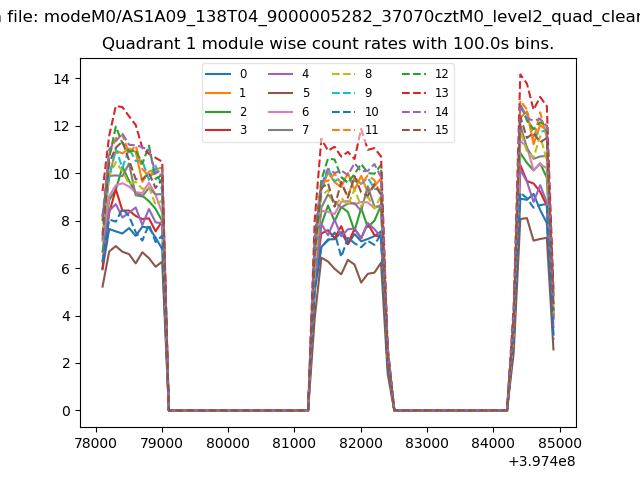
| Module-wise count rates for Quadrant A Data is divided into 100 sec bins |
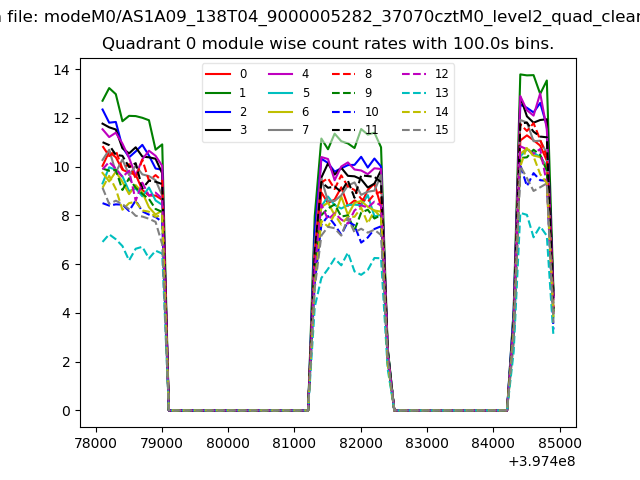 |
 |
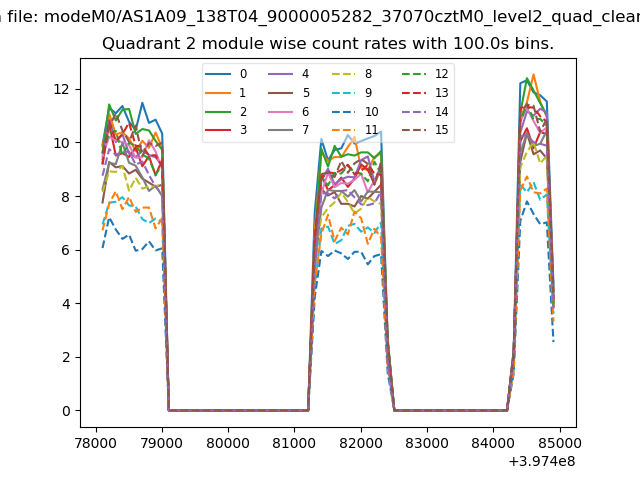
| Module-wise count rates for Quadrant B Data is divided into 100 sec bins |
 |
 |
| Module-wise count rates for Quadrant C Data is divided into 100 sec bins |
 |
 |
| Module-wise count rates for Quadrant D Data is divided into 100 sec bins |
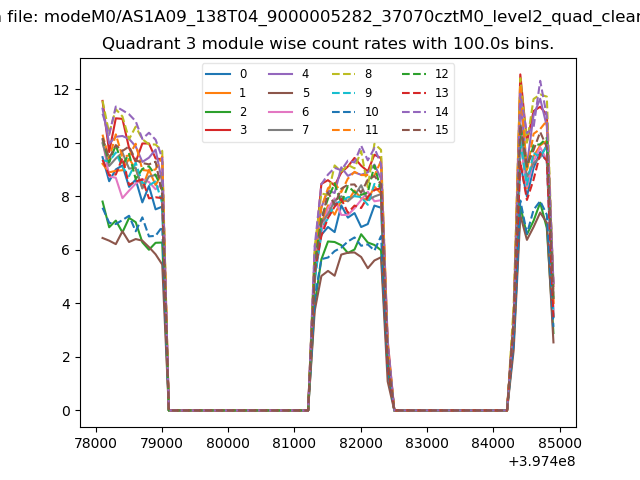 |
 |
| Parameter | Plot |
|---|---|
| CZT HV Monitor | 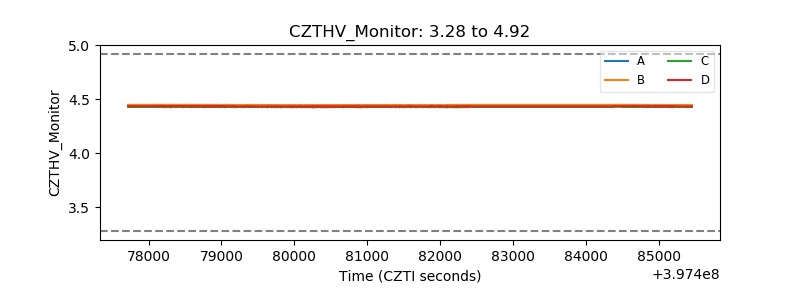 |
| D_VDD | 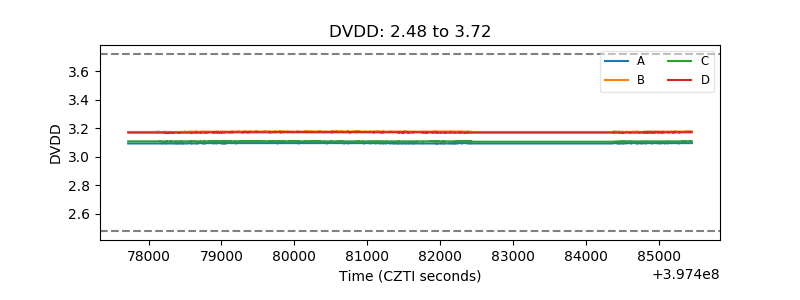 |
| Temperature 1 | 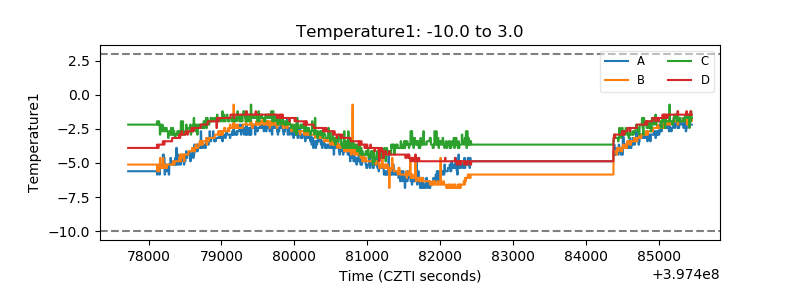 |
| Veto HV Monitor |  |
| Veto LLD | 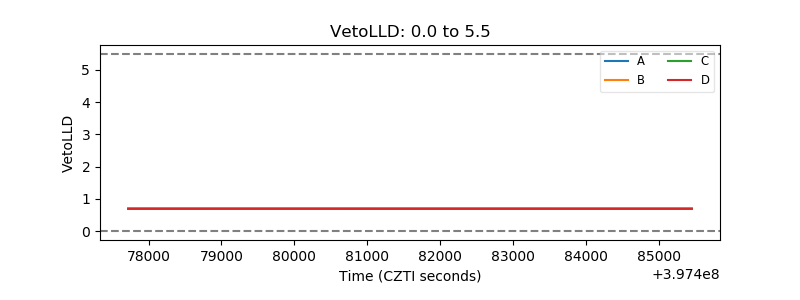 |
| Alpha Counter | 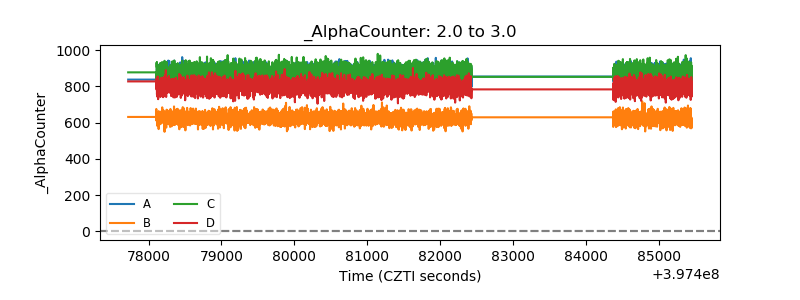 |
| _CPM_Rate | 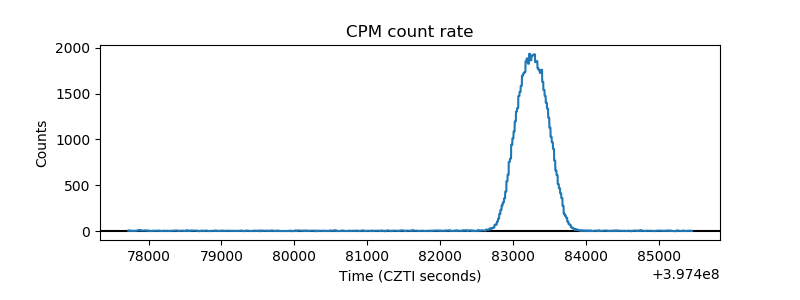 |
| CZT Counter | 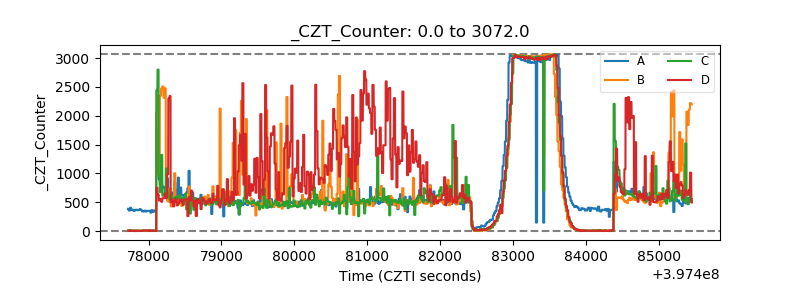 |
| +2.5 Volts monitor | 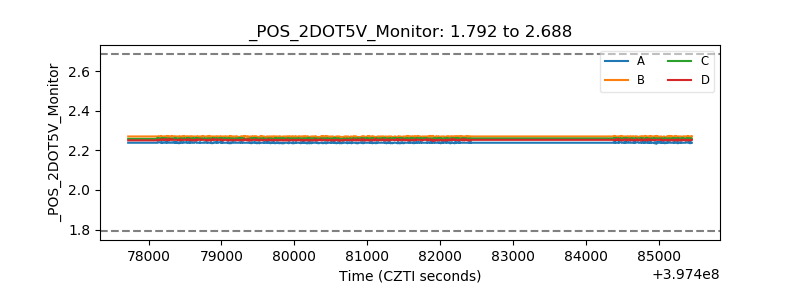 |
| +5 Volts monitor | 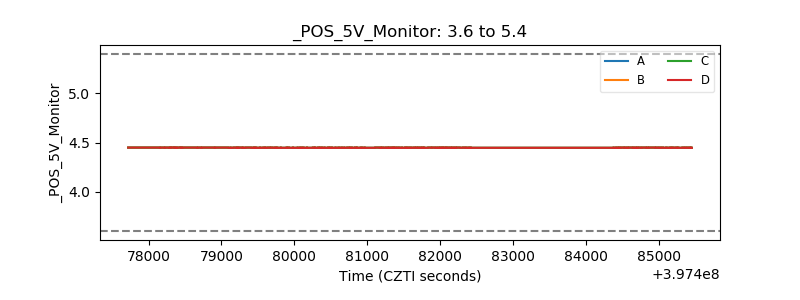 |
| _ROLL_ROT | 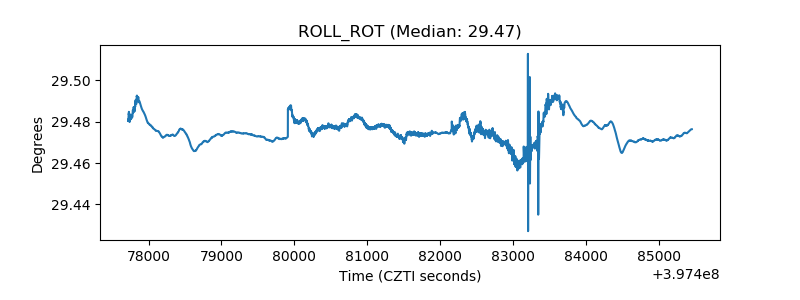 |
| _Roll_DEC | 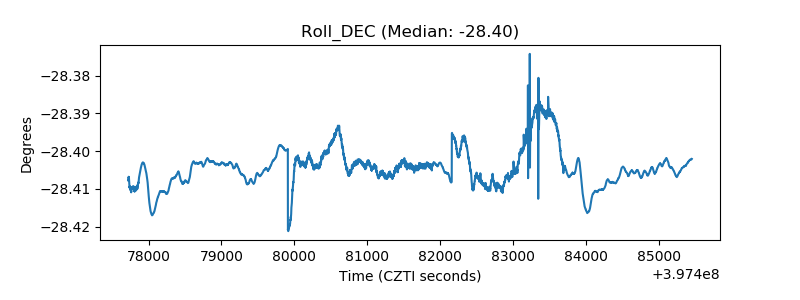 |
| _Roll_RA | 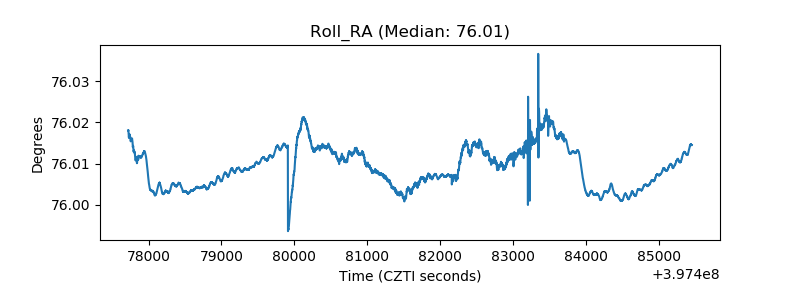 |
| Veto Counter | 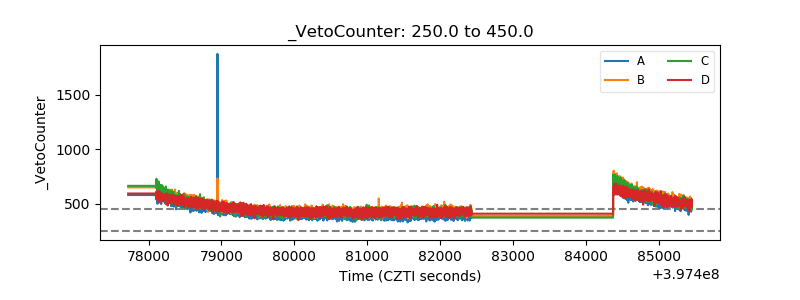 |