| Param | Original file | Final file |
|---|---|---|
| Filename | modeM0/AS1A09_138T04_9000005282_37071cztM0_level2.evt | modeM0/AS1A09_138T04_9000005282_37071cztM0_level2_quad_clean.evt |
| Size (bytes) | 485,504,640 | 54,455,040 |
| Size | 463.0 MB | 51.9 MB |
| Events in quadrant A | 3,010,215 | 333,285 |
| Events in quadrant B | 4,056,654 | 330,601 |
| Events in quadrant C | 3,268,922 | 314,816 |
| Events in quadrant D | 4,010,909 | 301,019 |
| Mode SS | |||
|---|---|---|---|
| Quadrant | BADHDUFLAG | Total packets | Discarded packets |
| A | 0 | 106 | 0 |
| B | 0 | 106 | 0 |
| C | 0 | 106 | 0 |
| D | 0 | 106 | 0 |
| Mode M0 | |||
|---|---|---|---|
| Quadrant | BADHDUFLAG | Total packets | Discarded packets |
| A | 0 | 12010 | 3 |
| B | 0 | 15349 | 2 |
| C | 0 | 12771 | 2 |
| D | 0 | 15402 | 2 |
| Mode M9 | |||
|---|---|---|---|
| Quadrant | BADHDUFLAG | Total packets | Discarded packets |
| A | 0 | 25 | 0 |
| B | 0 | 25 | 0 |
| C | 0 | 25 | 0 |
| D | 0 | 26 | 0 |
| Quadrant | Total seconds | Saturated seconds | Saturation percentage |
|---|---|---|---|
| A | 5269 | 18 | 0.341621% |
| B | 5269 | 405 | 7.686468% |
| C | 5269 | 82 | 1.556273% |
| D | 5269 | 191 | 3.624976% |
Noise dominated data is calculated using 1-second bins in cleaned event files. If a bin has >2000 counts, and if more than 50% of those come from <1% of pixels, then it is considered to be noise-dominated and hence unusable.
| Quadrant | # 1 sec bins | Bins with >0 counts | Bins with >2000 counts | High rate bins dominated by noise | Noise dominated (total time) | Noise dominated (detector-on time) | Marked lightcurve |
|---|---|---|---|---|---|---|---|
| A | 7301 | 5270 | 5 | 5 | 0.07% | 0.09% | 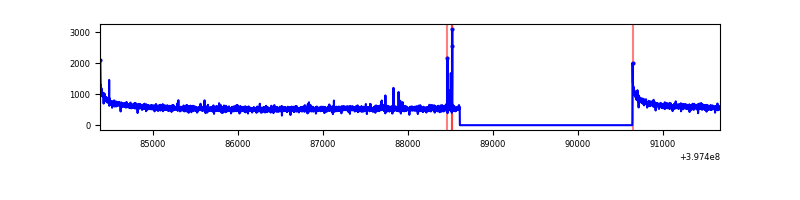 |
| B | 7301 | 5270 | 306 | 306 | 4.19% | 5.81% | 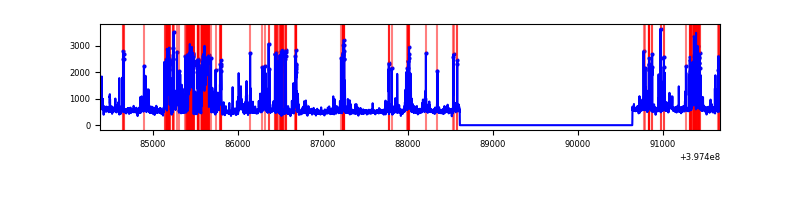 |
| C | 7301 | 5270 | 73 | 73 | 1.00% | 1.39% | 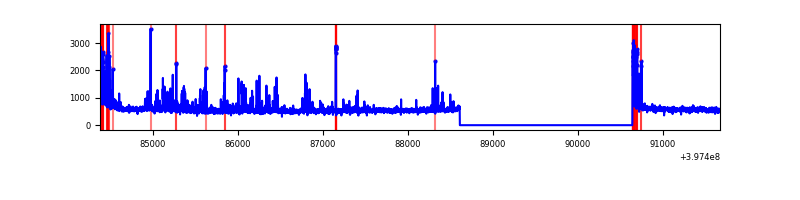 |
| D | 7301 | 5270 | 209 | 209 | 2.86% | 3.97% | 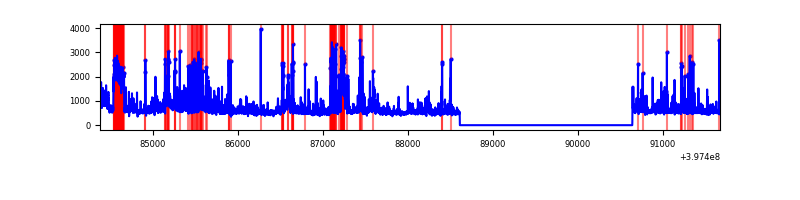 |
Top three noisy pixels from each quadrant. If the there are fewer than three noisy pixels in the level2.evt file, extra rows are filled as -1
| Pixel properties | Quadrant properties | ||||||
|---|---|---|---|---|---|---|---|
| Quadrant | DetID | PixID | Counts | Sigma | Mean | Median | Sigma |
| A | 10 | 83 | 267637 | 1903.05 | 701 | 689 | 140.3 |
| A | 9 | 143 | 21171 | 146.01 | 701 | 689 | 140.3 |
| A | 13 | 254 | 8211 | 53.62 | 701 | 689 | 140.3 |
| B | 5 | 172 | 727631 | 5810.33 | 668 | 654 | 125.1 |
| B | 5 | 184 | 447042 | 3567.74 | 668 | 654 | 125.1 |
| B | 5 | 200 | 91739 | 727.99 | 668 | 654 | 125.1 |
| C | 0 | 10 | 448814 | 2973.89 | 657 | 665 | 150.7 |
| C | 15 | 214 | 223282 | 1477.27 | 657 | 665 | 150.7 |
| C | 14 | 254 | 19847 | 127.29 | 657 | 665 | 150.7 |
| D | 12 | 17 | 238504 | 1463.85 | 668 | 652 | 162.5 |
| D | 1 | 20 | 225355 | 1382.92 | 668 | 652 | 162.5 |
| D | 1 | 47 | 210593 | 1292.07 | 668 | 652 | 162.5 |
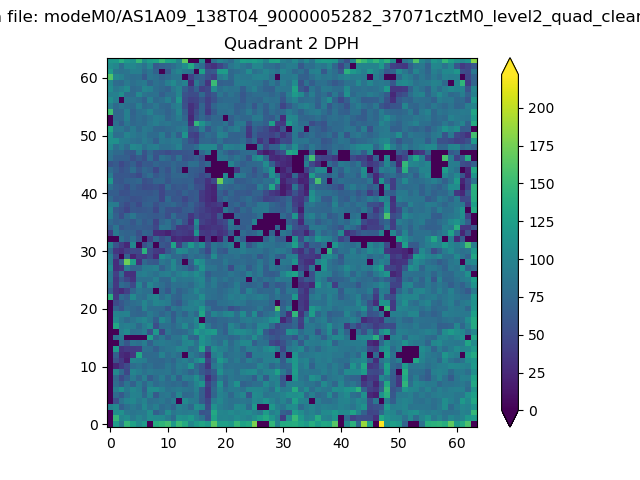
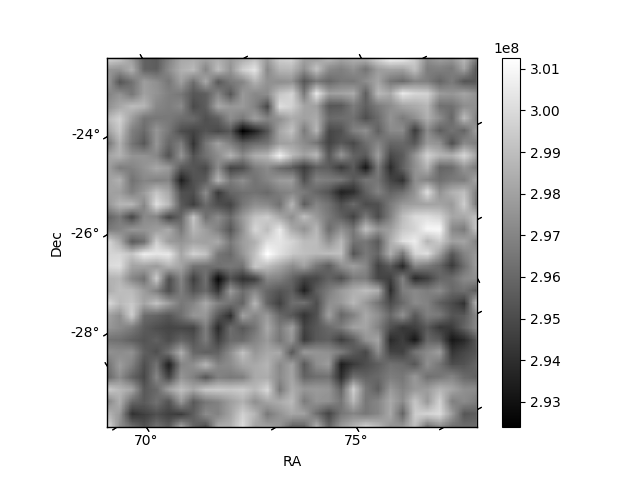
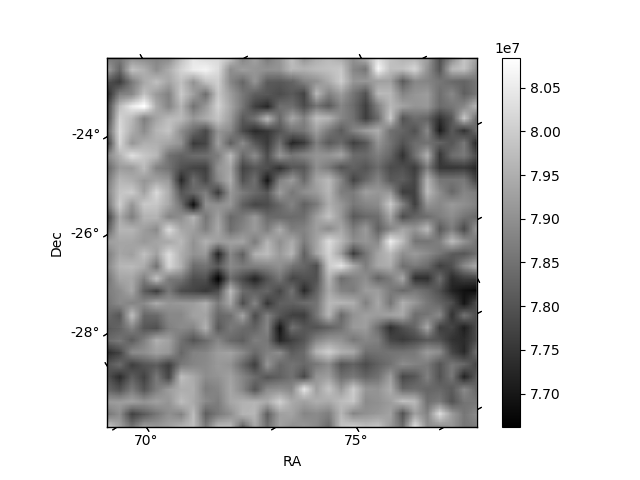
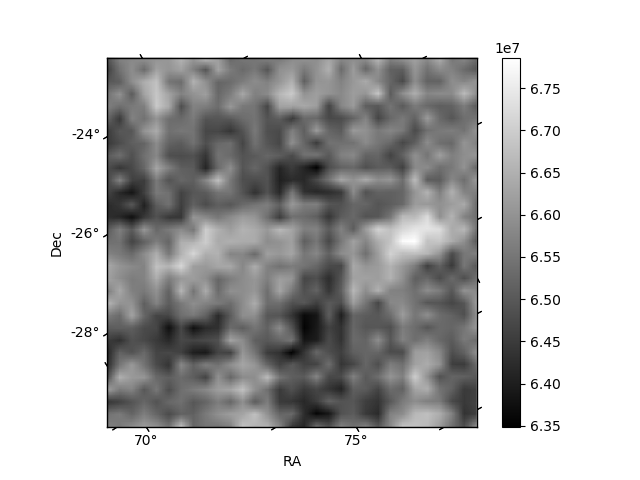
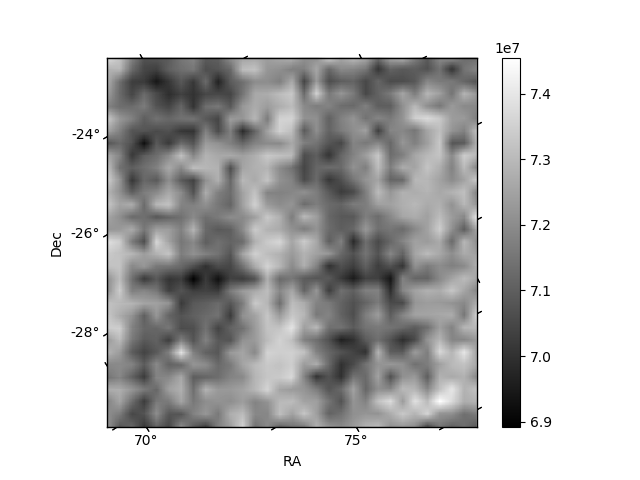
Histogram calculated using DETX and DETY for each event in the final _common_clean file
| Quadrant A | 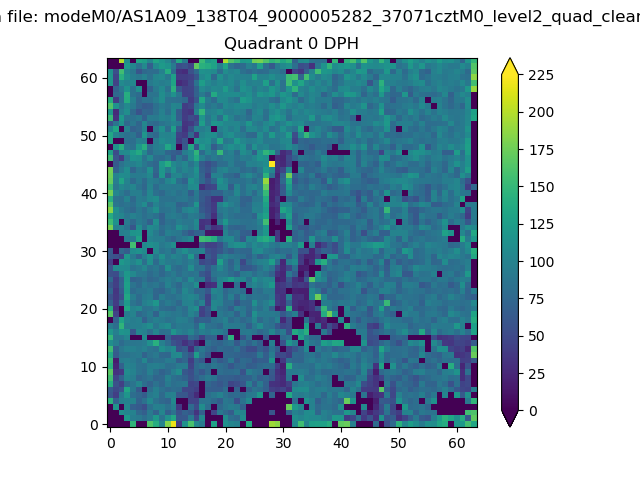 |
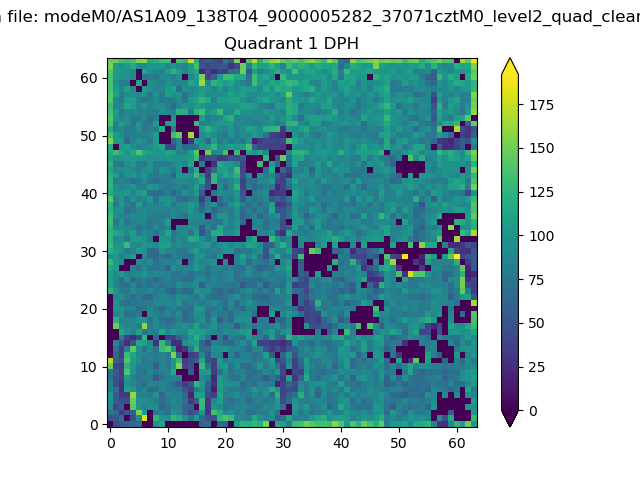 |
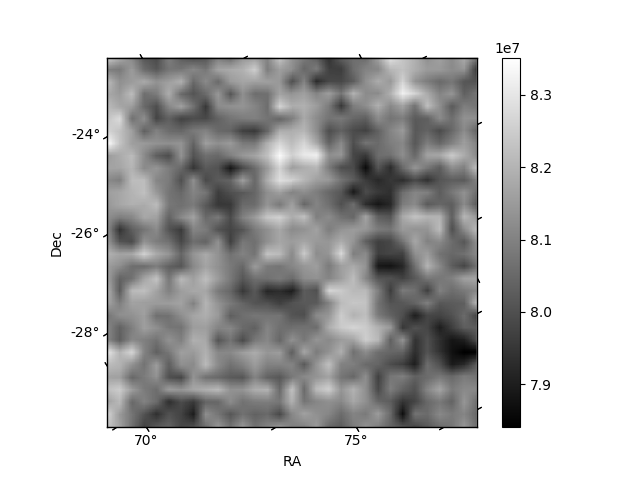
Quadrant B |
|---|---|---|---|
| Quadrant D | 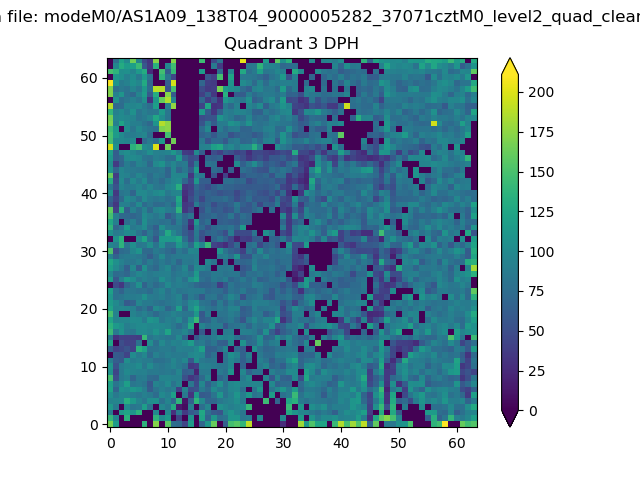 |
 |
Quadrant C |
| Plot type | Count rate plots | Images |
|---|---|---|
| Comparison with Poisson distribution Blue bars denote a histogram of data divided into 1 sec bins. Red curve is a Poisson curve with rate = median count rate of data. |
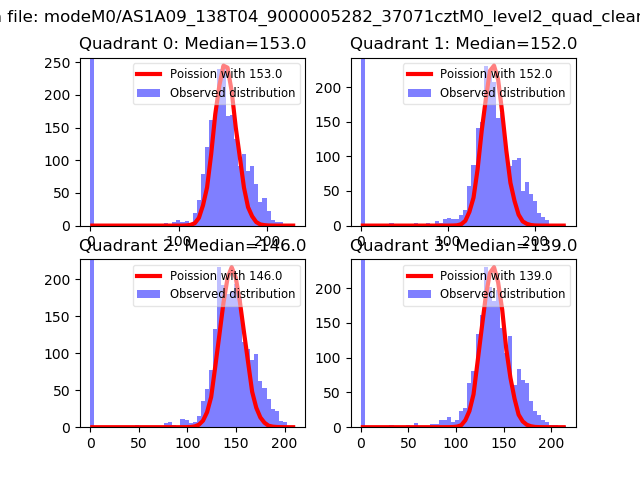 |
 |
| Quadrant-wise count rates Data is divided into 100 sec bins |
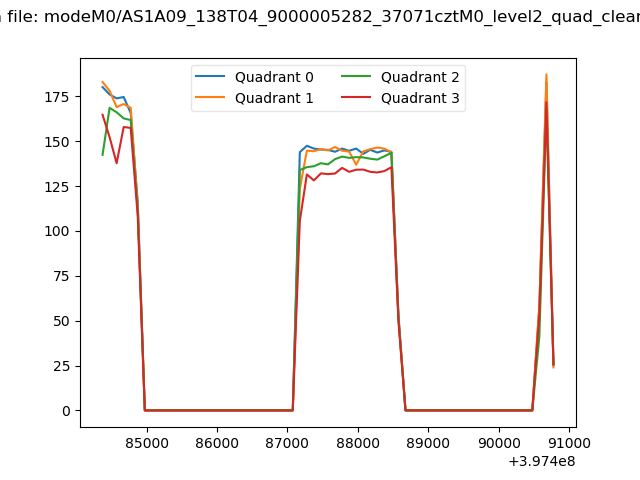 |
|
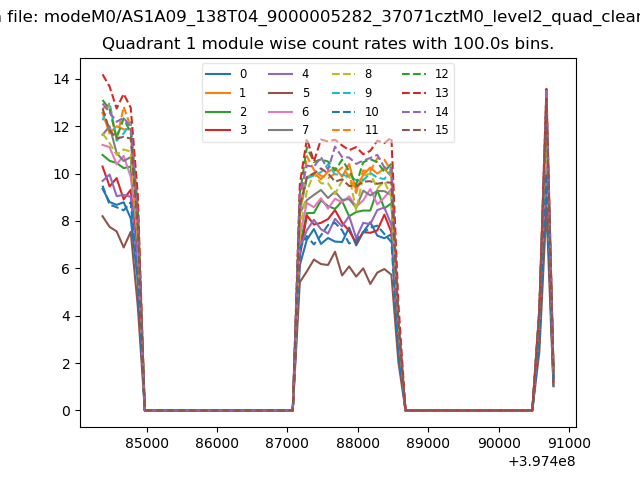
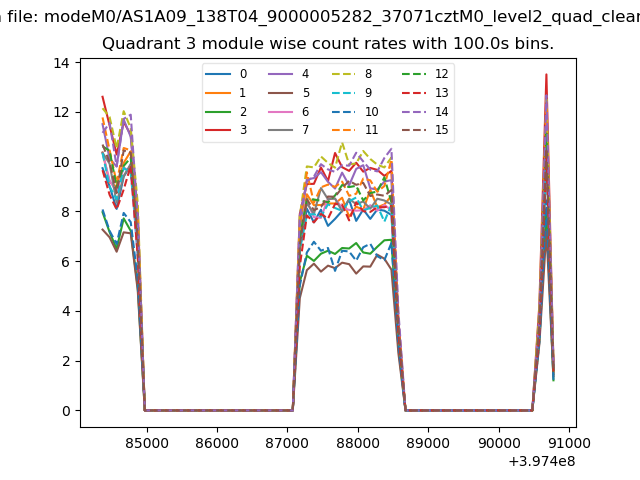
| Module-wise count rates for Quadrant A Data is divided into 100 sec bins |
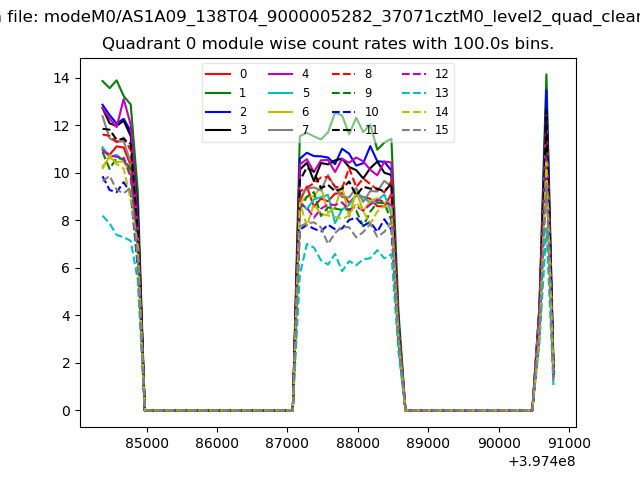 |
 |
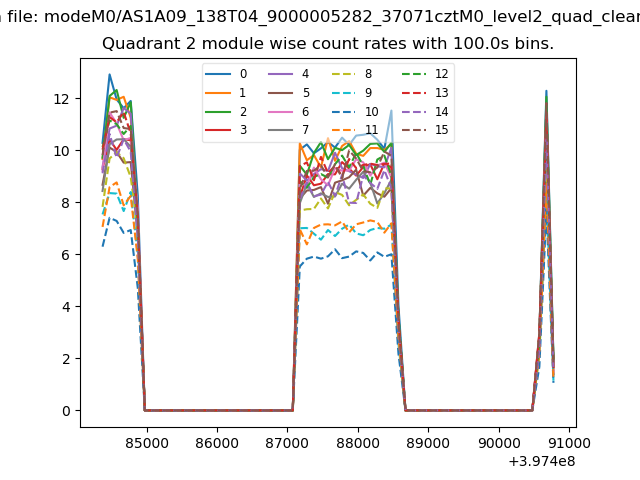
| Module-wise count rates for Quadrant B Data is divided into 100 sec bins |
 |
 |
| Module-wise count rates for Quadrant C Data is divided into 100 sec bins |
 |
 |
| Module-wise count rates for Quadrant D Data is divided into 100 sec bins |
 |
 |
| Parameter | Plot |
|---|---|
| CZT HV Monitor | 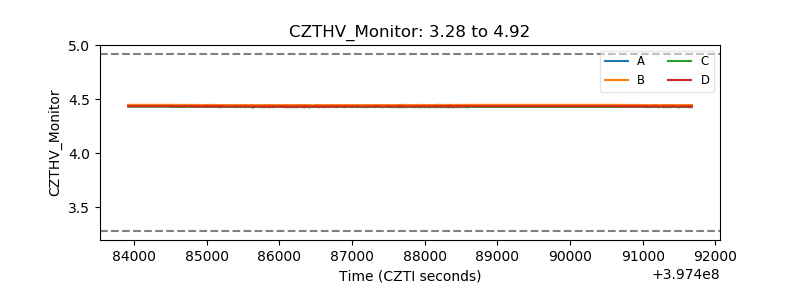 |
| D_VDD | 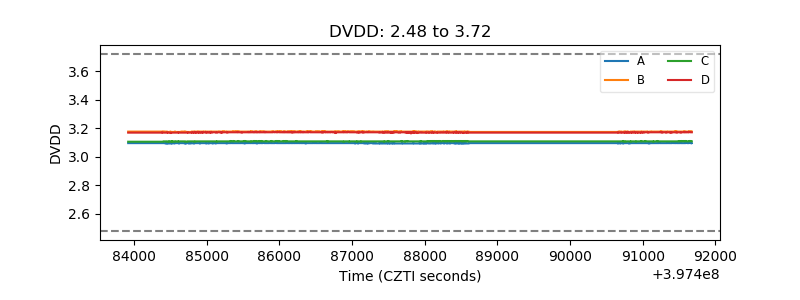 |
| Temperature 1 | 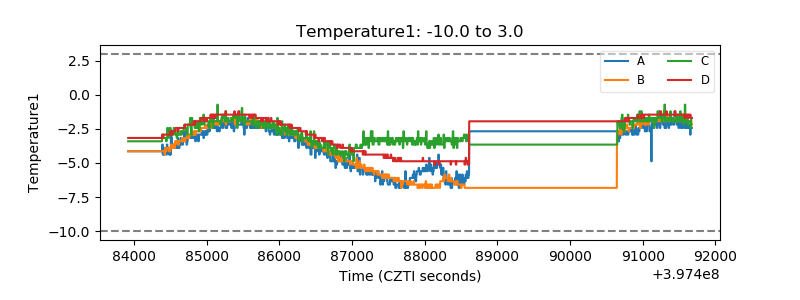 |
| Veto HV Monitor | 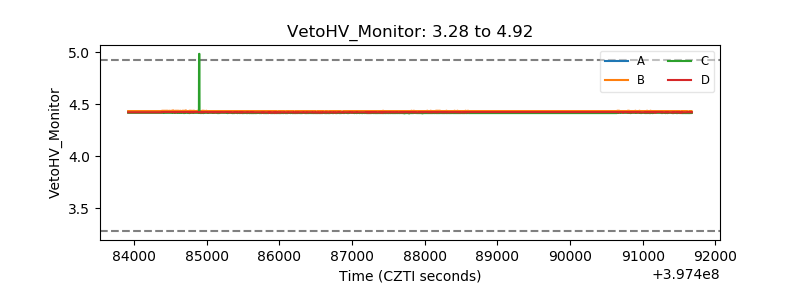 |
| Veto LLD | 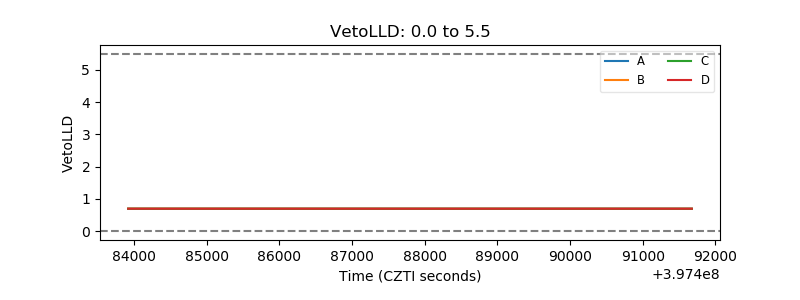 |
| Alpha Counter | 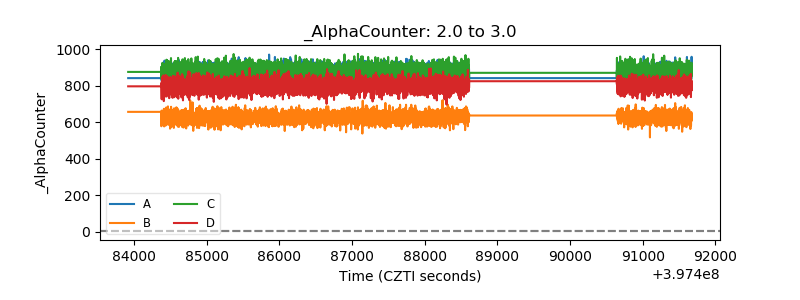 |
| _CPM_Rate | 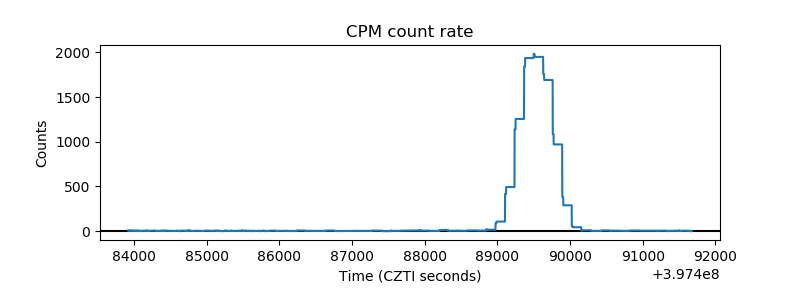 |
| CZT Counter | 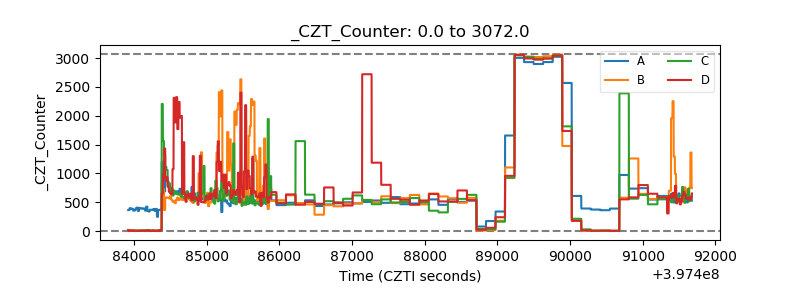 |
| +2.5 Volts monitor | 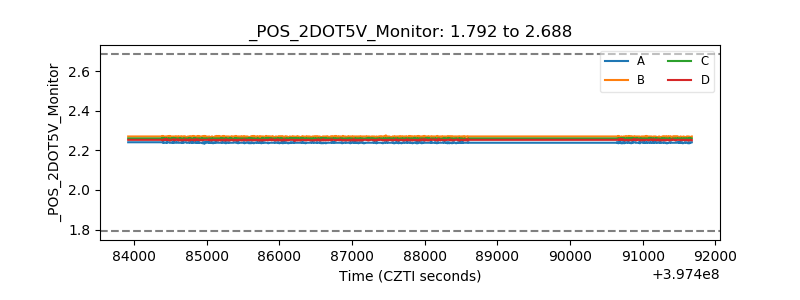 |
| +5 Volts monitor | 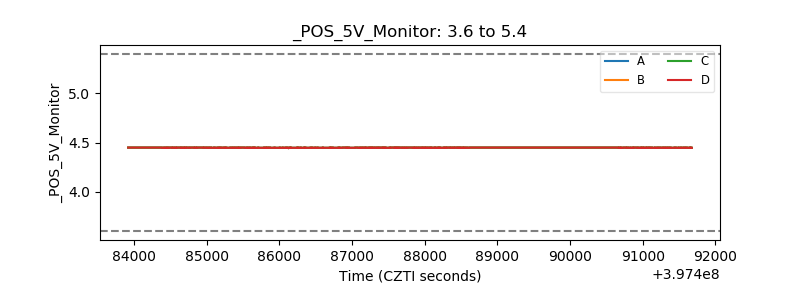 |
| _ROLL_ROT | 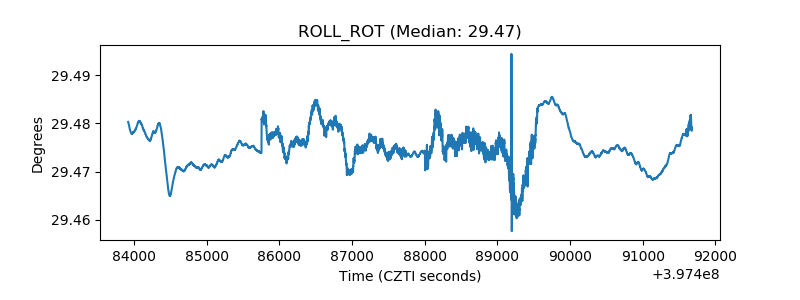 |
| _Roll_DEC | 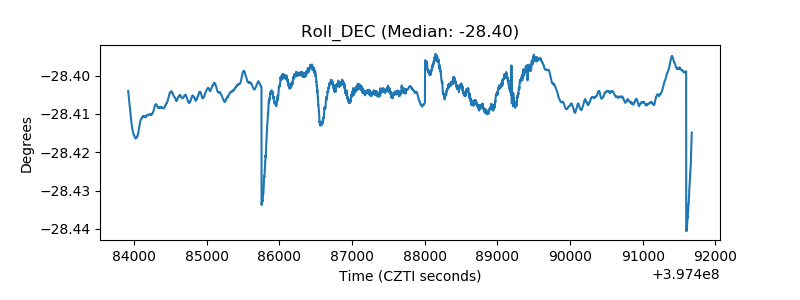 |
| _Roll_RA | 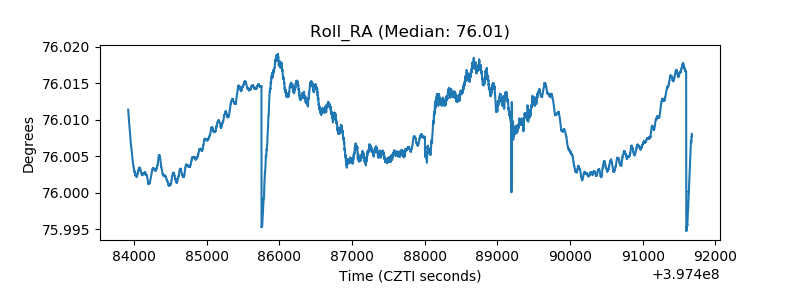 |
| Veto Counter |  |