| Param | Original file | Final file |
|---|---|---|
| Filename | modeM0/AS1A09_138T04_9000005282_37072cztM0_level2.evt | modeM0/AS1A09_138T04_9000005282_37072cztM0_level2_quad_clean.evt |
| Size (bytes) | 441,771,840 | 48,464,640 |
| Size | 421.3 MB | 46.2 MB |
| Events in quadrant A | 2,925,577 | 287,885 |
| Events in quadrant B | 3,293,239 | 288,960 |
| Events in quadrant C | 3,046,206 | 272,060 |
| Events in quadrant D | 3,768,401 | 261,189 |
| Mode SS | |||
|---|---|---|---|
| Quadrant | BADHDUFLAG | Total packets | Discarded packets |
| A | 0 | 104 | 0 |
| B | 0 | 104 | 0 |
| C | 0 | 104 | 0 |
| D | 0 | 104 | 0 |
| Mode M0 | |||
|---|---|---|---|
| Quadrant | BADHDUFLAG | Total packets | Discarded packets |
| A | 0 | 11671 | 3 |
| B | 0 | 12949 | 2 |
| C | 0 | 11921 | 2 |
| D | 0 | 14450 | 2 |
| Mode M9 | |||
|---|---|---|---|
| Quadrant | BADHDUFLAG | Total packets | Discarded packets |
| A | 0 | 25 | 0 |
| B | 0 | 25 | 0 |
| C | 0 | 25 | 0 |
| D | 0 | 26 | 0 |
| Quadrant | Total seconds | Saturated seconds | Saturation percentage |
|---|---|---|---|
| A | 5092 | 16 | 0.314218% |
| B | 5092 | 137 | 2.690495% |
| C | 5092 | 92 | 1.806756% |
| D | 5092 | 170 | 3.338570% |
Noise dominated data is calculated using 1-second bins in cleaned event files. If a bin has >2000 counts, and if more than 50% of those come from <1% of pixels, then it is considered to be noise-dominated and hence unusable.
| Quadrant | # 1 sec bins | Bins with >0 counts | Bins with >2000 counts | High rate bins dominated by noise | Noise dominated (total time) | Noise dominated (detector-on time) | Marked lightcurve |
|---|---|---|---|---|---|---|---|
| A | 7215 | 5093 | 2 | 2 | 0.03% | 0.04% | 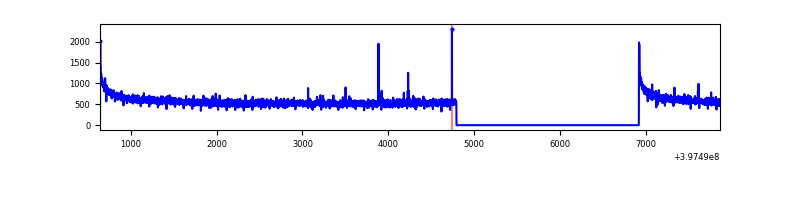 |
| B | 7215 | 5093 | 97 | 97 | 1.34% | 1.90% | 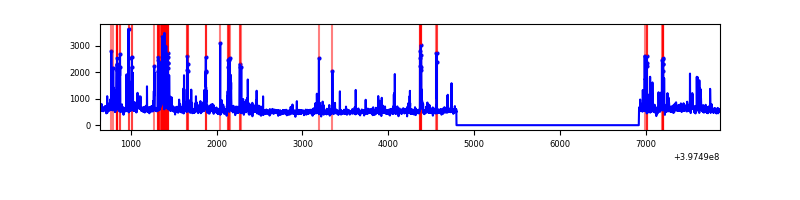 |
| C | 7215 | 5093 | 69 | 69 | 0.96% | 1.35% | 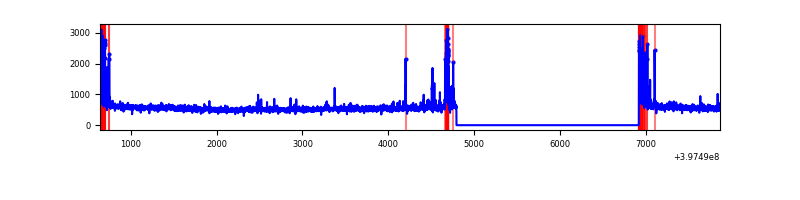 |
| D | 7215 | 5093 | 160 | 160 | 2.22% | 3.14% | 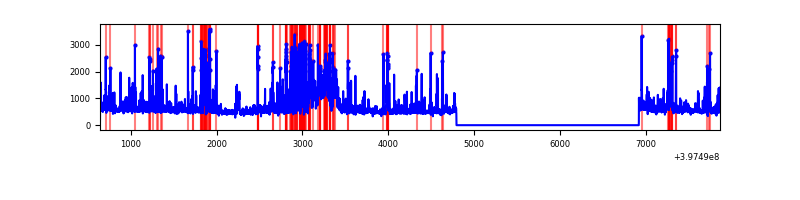 |
Top three noisy pixels from each quadrant. If the there are fewer than three noisy pixels in the level2.evt file, extra rows are filled as -1
| Pixel properties | Quadrant properties | ||||||
|---|---|---|---|---|---|---|---|
| Quadrant | DetID | PixID | Counts | Sigma | Mean | Median | Sigma |
| A | 10 | 83 | 264572 | 1941.32 | 681 | 672 | 135.9 |
| A | 13 | 6 | 12676 | 88.3 | 681 | 672 | 135.9 |
| A | 13 | 254 | 7704 | 51.73 | 681 | 672 | 135.9 |
| B | 5 | 172 | 522096 | 4204.53 | 665 | 650 | 124.0 |
| B | 0 | 229 | 70065 | 559.71 | 665 | 650 | 124.0 |
| B | 0 | 190 | 33908 | 268.17 | 665 | 650 | 124.0 |
| C | 15 | 214 | 214972 | 1456.01 | 639 | 644 | 147.2 |
| C | 0 | 10 | 184143 | 1246.57 | 639 | 644 | 147.2 |
| C | 0 | 207 | 119583 | 807.99 | 639 | 644 | 147.2 |
| D | 1 | 47 | 290603 | 1872.72 | 647 | 633 | 154.8 |
| D | 6 | 112 | 262102 | 1688.65 | 647 | 633 | 154.8 |
| D | 2 | 153 | 237913 | 1532.43 | 647 | 633 | 154.8 |
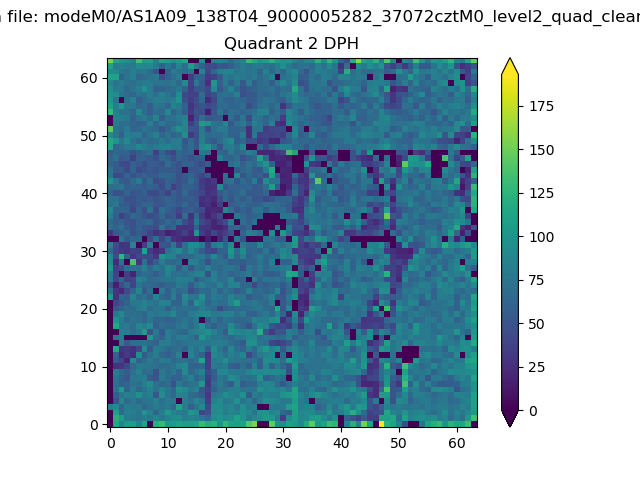
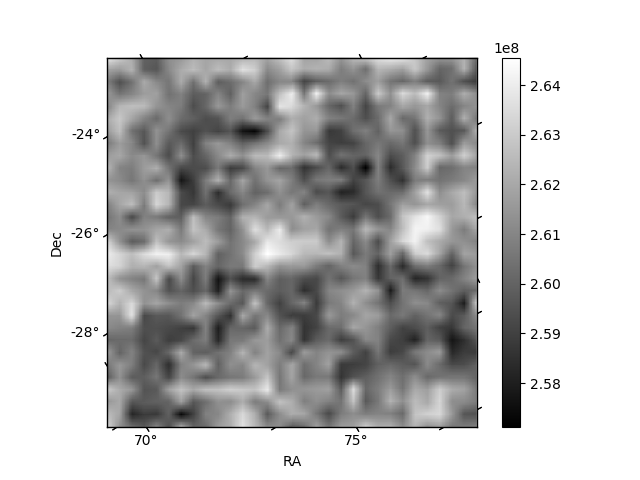
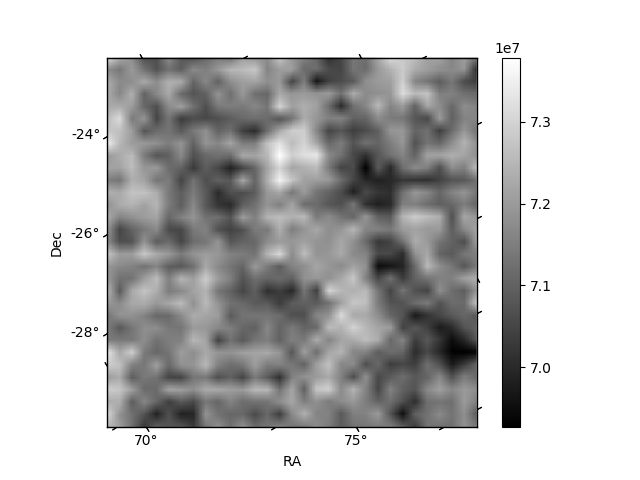
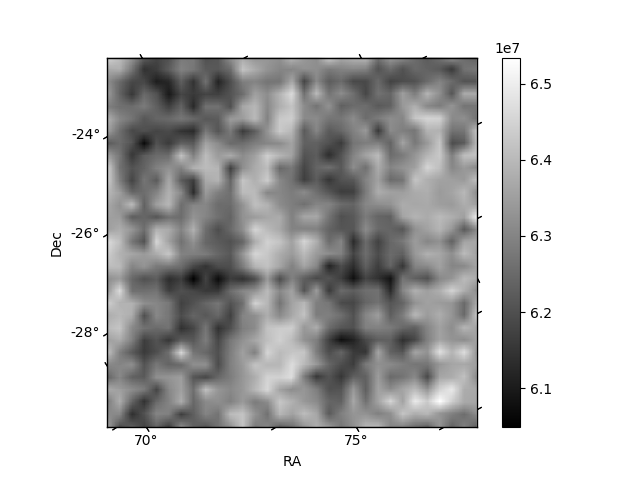
Histogram calculated using DETX and DETY for each event in the final _common_clean file
| Quadrant A | 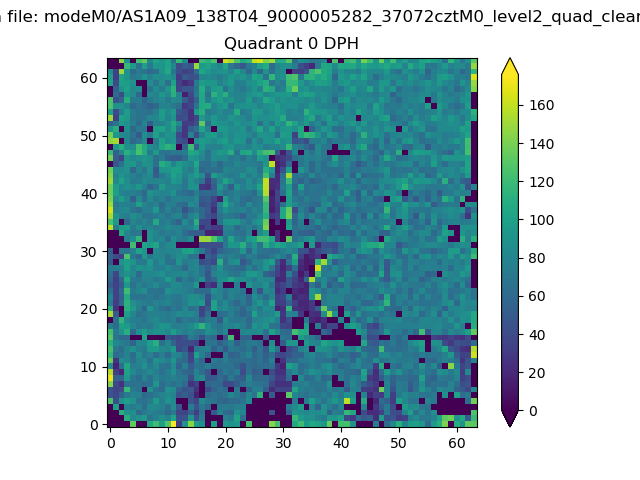 |
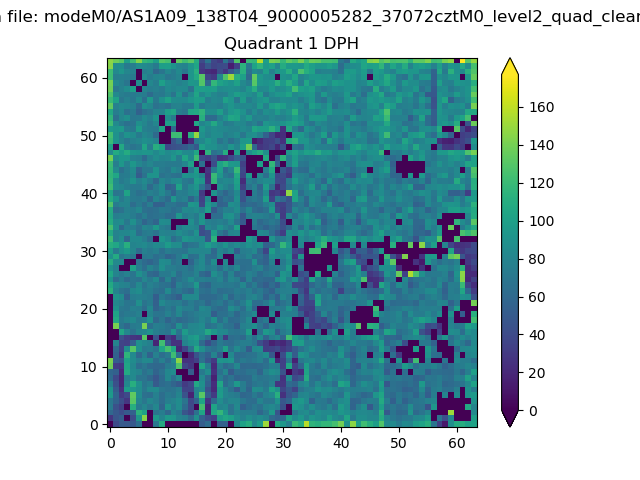 |
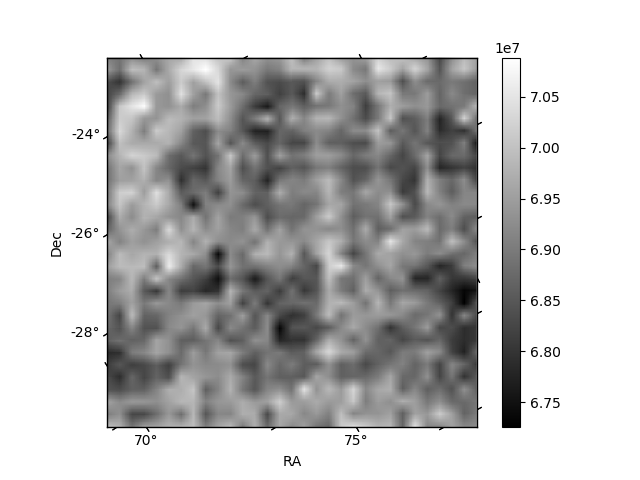
Quadrant B |
|---|---|---|---|
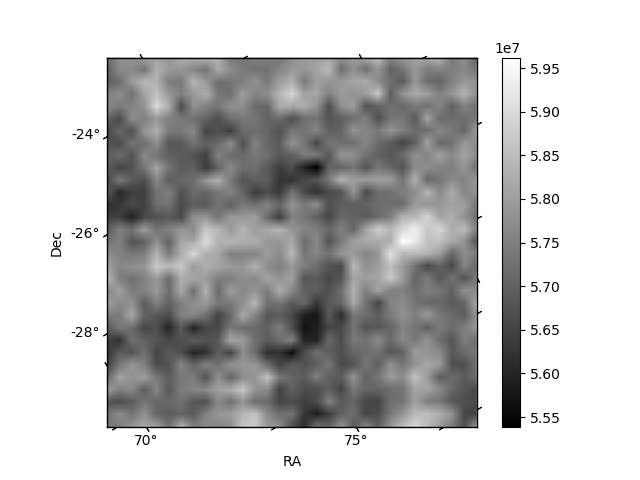
| Quadrant D | 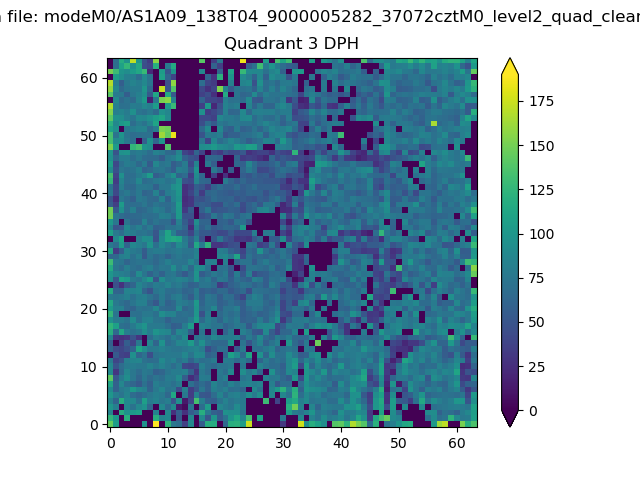 |
 |
Quadrant C |
| Plot type | Count rate plots | Images |
|---|---|---|
| Comparison with Poisson distribution Blue bars denote a histogram of data divided into 1 sec bins. Red curve is a Poisson curve with rate = median count rate of data. |
 |
 |
| Quadrant-wise count rates Data is divided into 100 sec bins |
 |
|
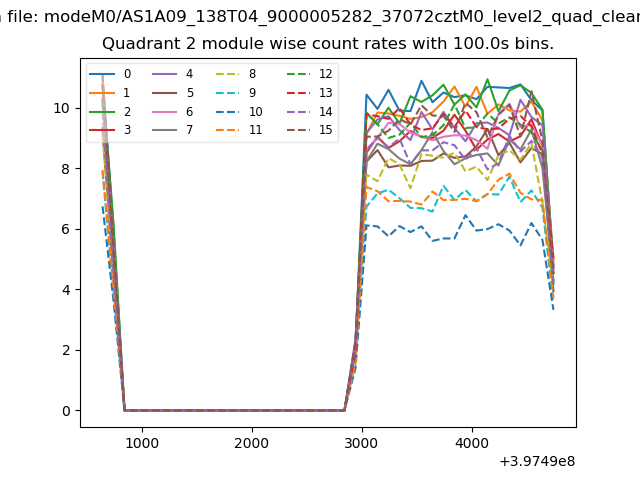
| Module-wise count rates for Quadrant A Data is divided into 100 sec bins |
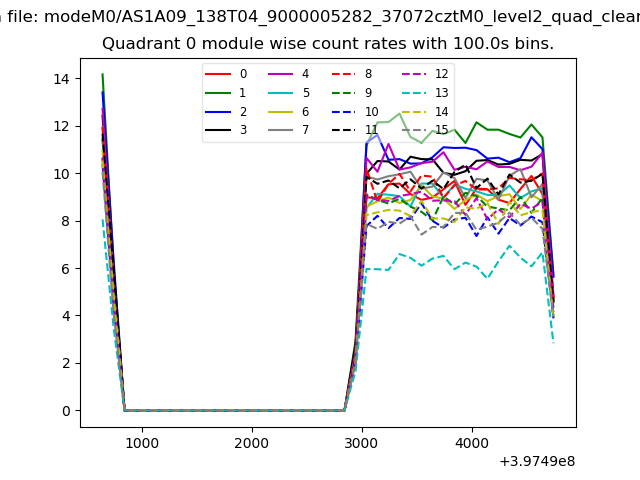 |
 |
| Module-wise count rates for Quadrant B Data is divided into 100 sec bins |
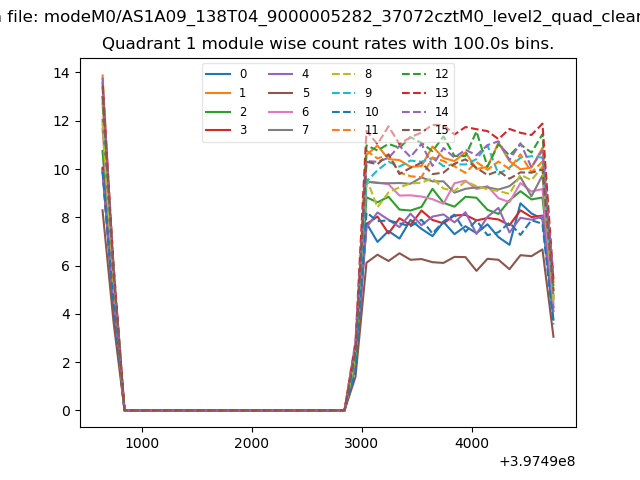 |
 |
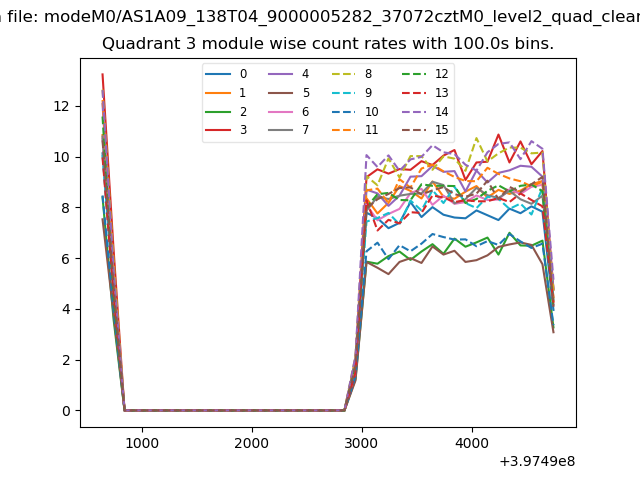
| Module-wise count rates for Quadrant C Data is divided into 100 sec bins |
 |
 |
| Module-wise count rates for Quadrant D Data is divided into 100 sec bins |
 |
 |
| Parameter | Plot |
|---|---|
| CZT HV Monitor | 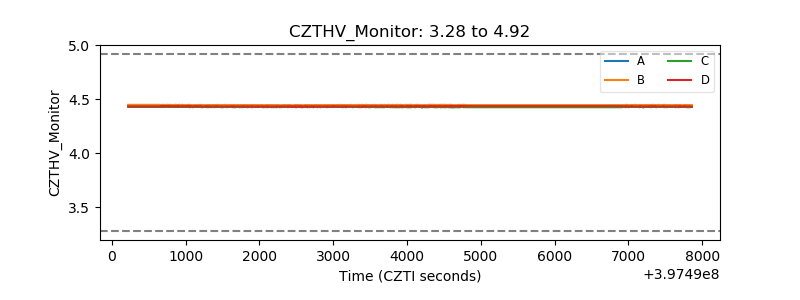 |
| D_VDD | 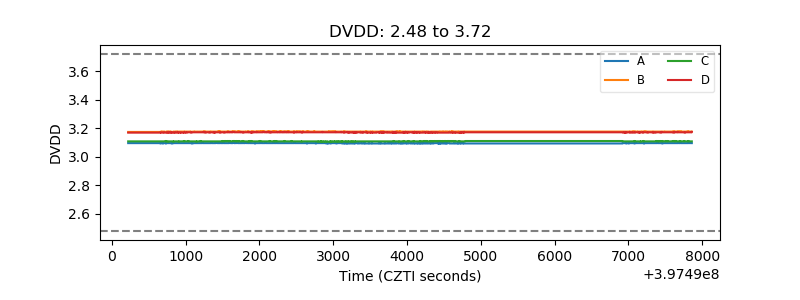 |
| Temperature 1 | 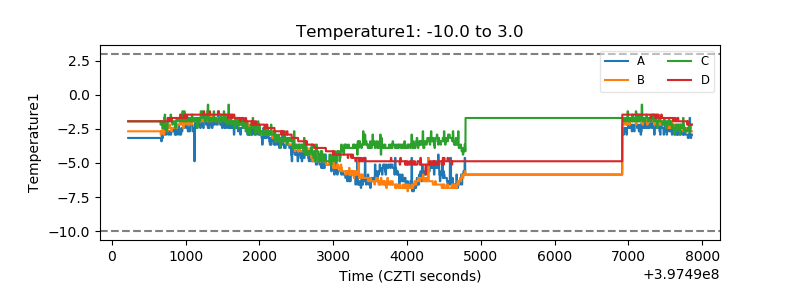 |
| Veto HV Monitor |  |
| Veto LLD | 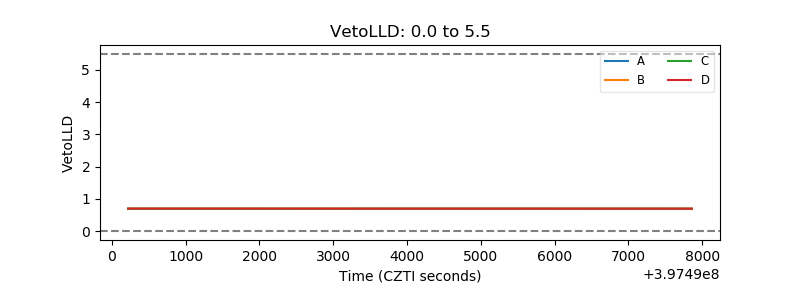 |
| Alpha Counter | 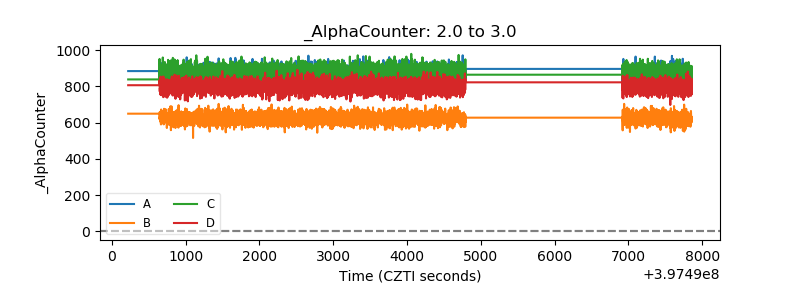 |
| _CPM_Rate |  |
| CZT Counter |  |
| +2.5 Volts monitor |  |
| +5 Volts monitor |  |
| _ROLL_ROT | 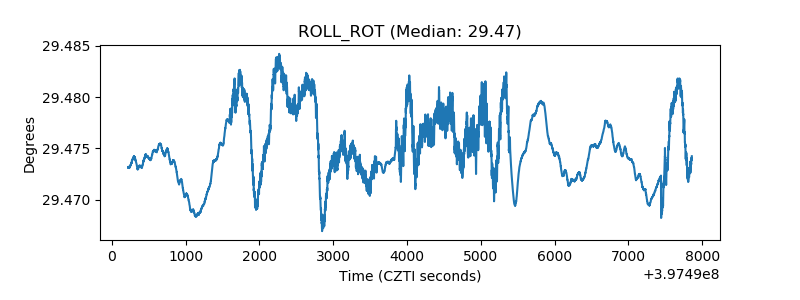 |
| _Roll_DEC |  |
| _Roll_RA | 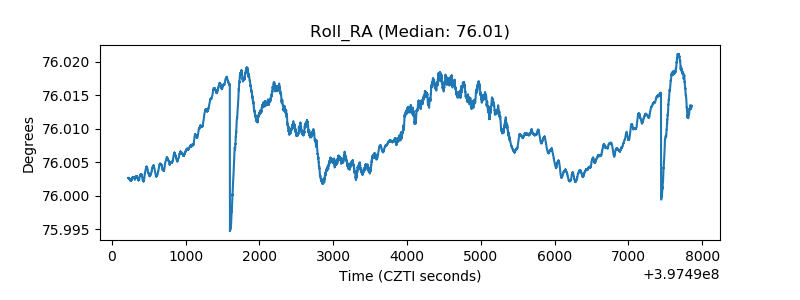 |
| Veto Counter | 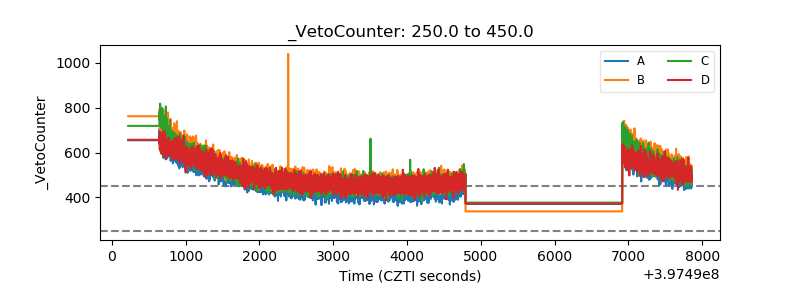 |