| Param | Original file | Final file |
|---|---|---|
| Filename | modeM0/AS1A09_138T04_9000005282_37074cztM0_level2.evt | modeM0/AS1A09_138T04_9000005282_37074cztM0_level2_quad_clean.evt |
| Size (bytes) | 441,601,920 | 59,716,800 |
| Size | 421.1 MB | 57.0 MB |
| Events in quadrant A | 2,758,908 | 375,797 |
| Events in quadrant B | 2,900,357 | 375,923 |
| Events in quadrant C | 2,775,076 | 362,821 |
| Events in quadrant D | 4,599,389 | 341,712 |
| Mode SS | |||
|---|---|---|---|
| Quadrant | BADHDUFLAG | Total packets | Discarded packets |
| A | 0 | 104 | 0 |
| B | 0 | 104 | 0 |
| C | 0 | 104 | 0 |
| D | 0 | 104 | 0 |
| Mode M0 | |||
|---|---|---|---|
| Quadrant | BADHDUFLAG | Total packets | Discarded packets |
| A | 0 | 11155 | 3 |
| B | 0 | 11687 | 2 |
| C | 0 | 10988 | 2 |
| D | 0 | 17113 | 2 |
| Mode M9 | |||
|---|---|---|---|
| Quadrant | BADHDUFLAG | Total packets | Discarded packets |
| A | 0 | 27 | 0 |
| B | 0 | 27 | 0 |
| C | 0 | 27 | 0 |
| D | 0 | 28 | 0 |
| Quadrant | Total seconds | Saturated seconds | Saturation percentage |
|---|---|---|---|
| A | 5009 | 24 | 0.479138% |
| B | 5009 | 36 | 0.718706% |
| C | 5009 | 75 | 1.497305% |
| D | 5009 | 269 | 5.370333% |
Noise dominated data is calculated using 1-second bins in cleaned event files. If a bin has >2000 counts, and if more than 50% of those come from <1% of pixels, then it is considered to be noise-dominated and hence unusable.
| Quadrant | # 1 sec bins | Bins with >0 counts | Bins with >2000 counts | High rate bins dominated by noise | Noise dominated (total time) | Noise dominated (detector-on time) | Marked lightcurve |
|---|---|---|---|---|---|---|---|
| A | 7042 | 5010 | 14 | 14 | 0.20% | 0.28% | 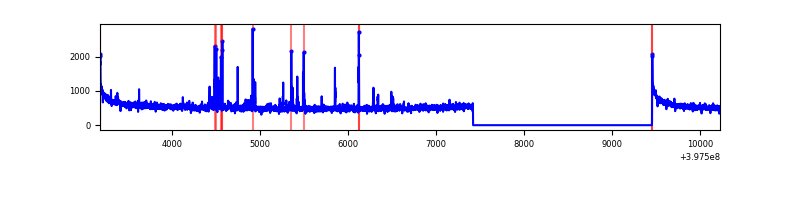 |
| B | 7042 | 5010 | 15 | 15 | 0.21% | 0.30% | 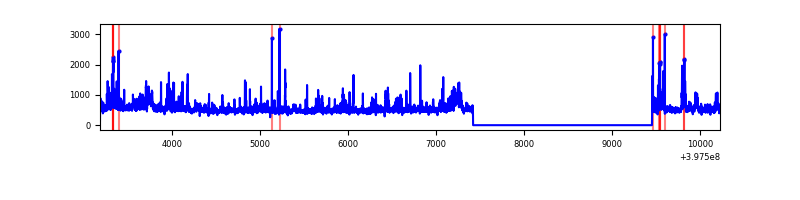 |
| C | 7042 | 5010 | 60 | 60 | 0.85% | 1.20% | 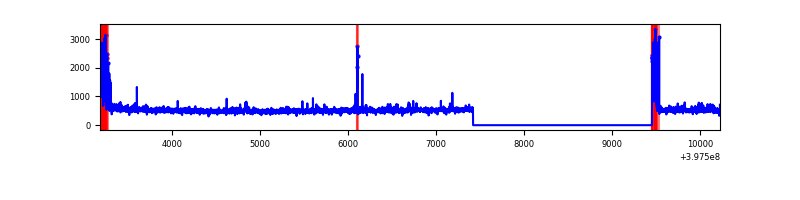 |
| D | 7042 | 5010 | 254 | 254 | 3.61% | 5.07% | 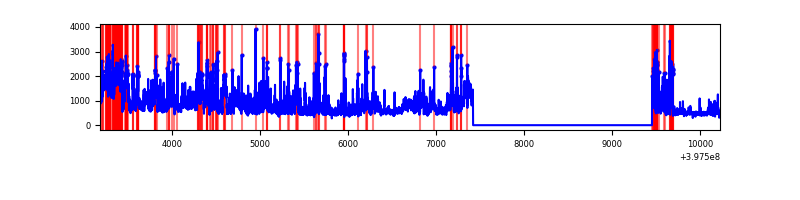 |
Top three noisy pixels from each quadrant. If the there are fewer than three noisy pixels in the level2.evt file, extra rows are filled as -1
| Pixel properties | Quadrant properties | ||||||
|---|---|---|---|---|---|---|---|
| Quadrant | DetID | PixID | Counts | Sigma | Mean | Median | Sigma |
| A | 10 | 83 | 262206 | 2120.46 | 613 | 602 | 123.4 |
| A | 7 | 3 | 78648 | 632.61 | 613 | 602 | 123.4 |
| A | 9 | 143 | 41237 | 329.37 | 613 | 602 | 123.4 |
| B | 0 | 229 | 157091 | 1345.86 | 609 | 596 | 116.3 |
| B | 5 | 172 | 137554 | 1177.85 | 609 | 596 | 116.3 |
| B | 4 | 232 | 63241 | 538.75 | 609 | 596 | 116.3 |
| C | 0 | 10 | 230542 | 1683.62 | 588 | 593 | 136.6 |
| C | 15 | 214 | 211079 | 1541.12 | 588 | 593 | 136.6 |
| C | 14 | 254 | 15041 | 105.78 | 588 | 593 | 136.6 |
| D | 6 | 112 | 1465375 | 10382.77 | 582 | 568 | 141.1 |
| D | 1 | 52 | 306441 | 2168.07 | 582 | 568 | 141.1 |
| D | 1 | 47 | 168790 | 1192.38 | 582 | 568 | 141.1 |
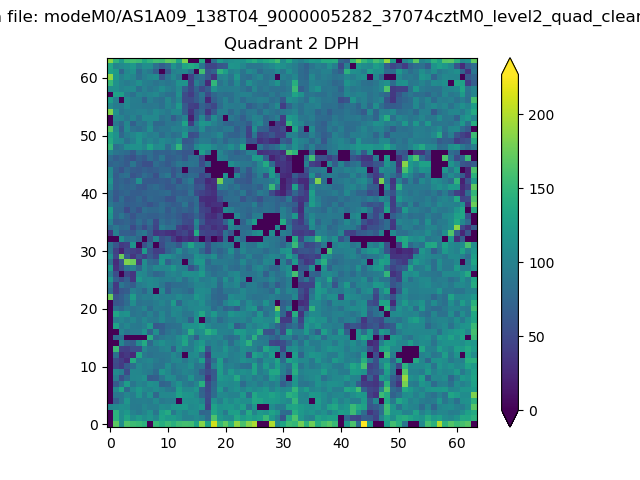
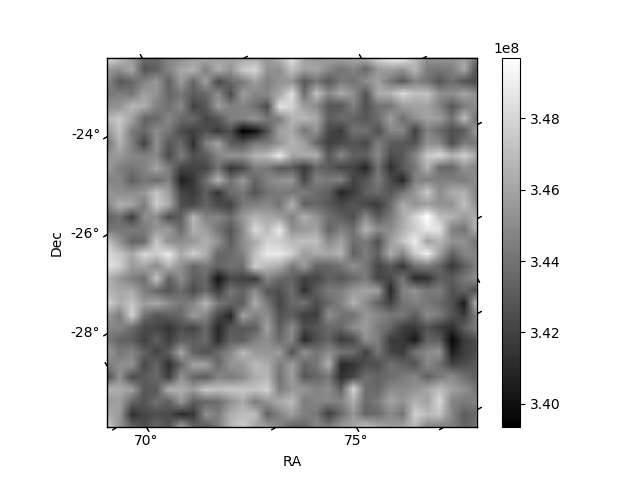
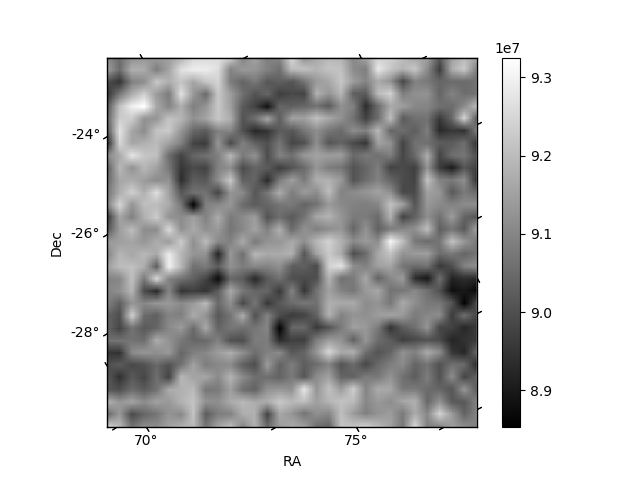
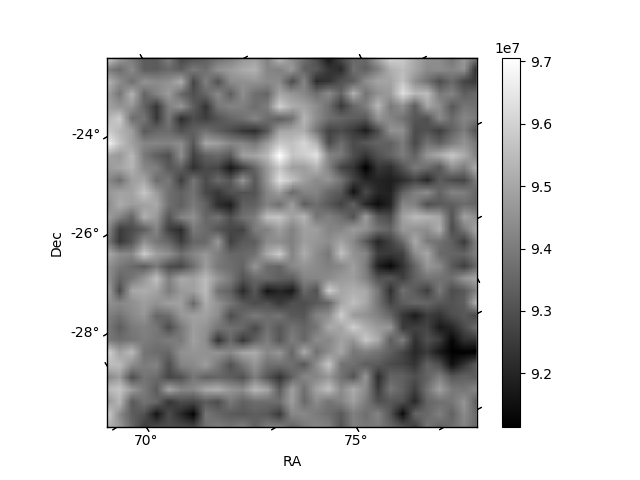
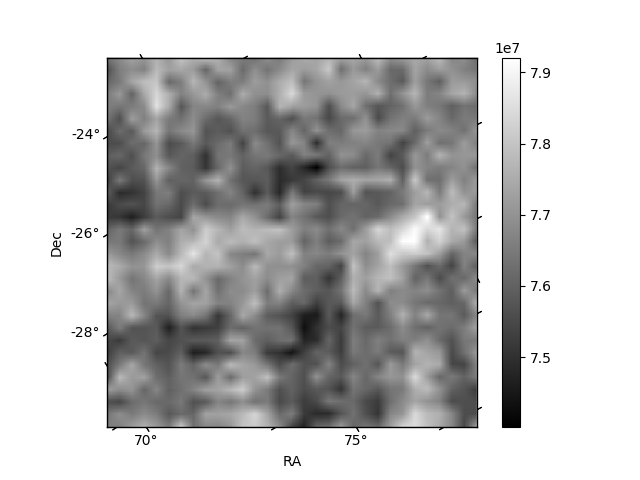
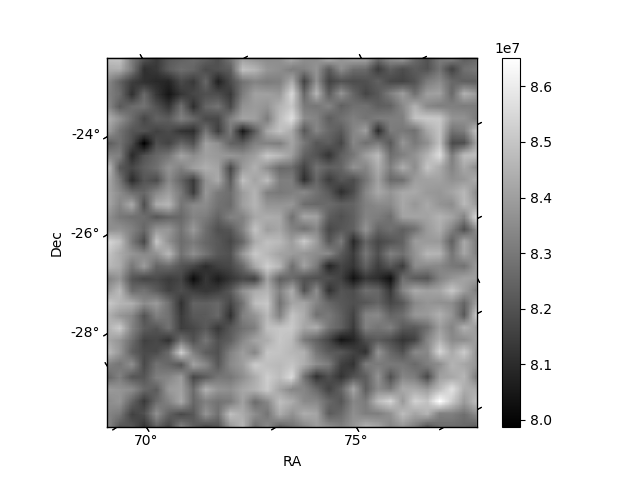
Histogram calculated using DETX and DETY for each event in the final _common_clean file
| Quadrant A | 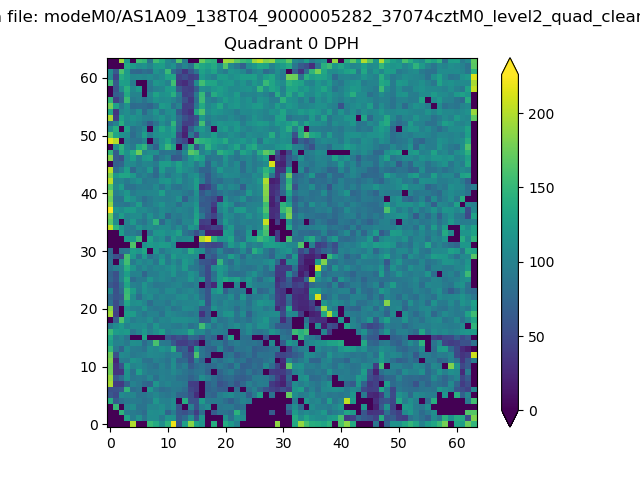 |
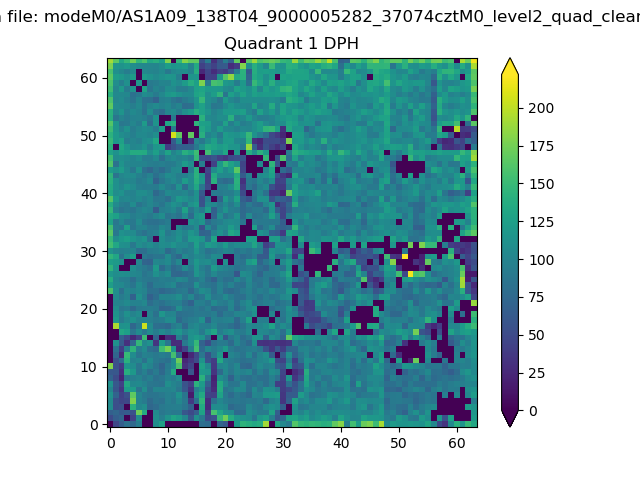 |
Quadrant B |
|---|---|---|---|
| Quadrant D | 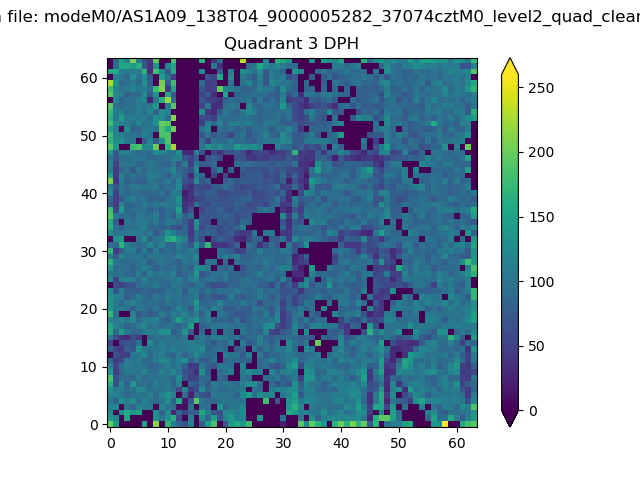 |
 |
Quadrant C |
| Plot type | Count rate plots | Images |
|---|---|---|
| Comparison with Poisson distribution Blue bars denote a histogram of data divided into 1 sec bins. Red curve is a Poisson curve with rate = median count rate of data. |
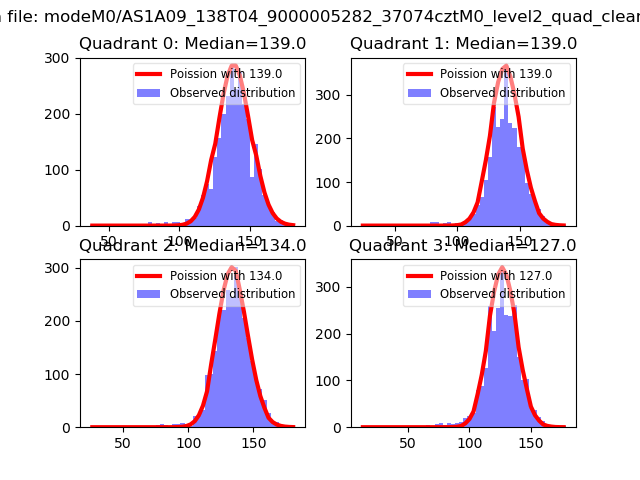 |
 |
| Quadrant-wise count rates Data is divided into 100 sec bins |
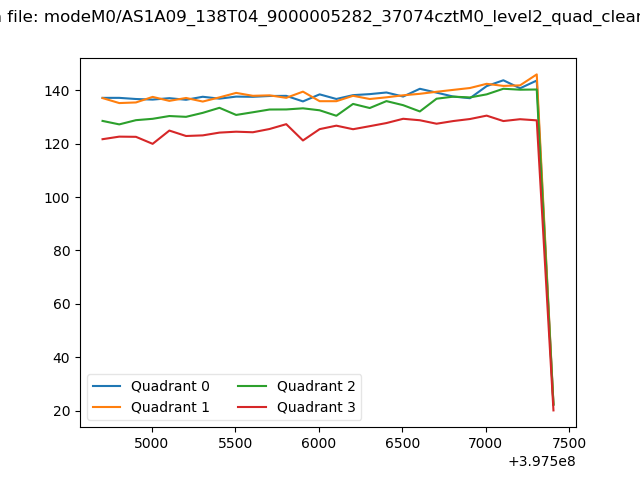 |
|
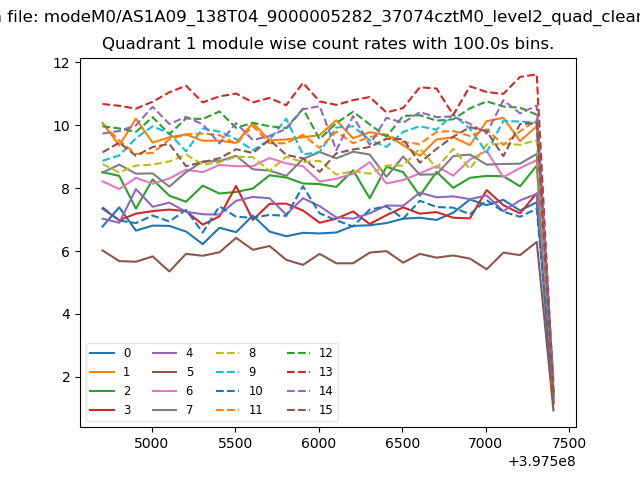
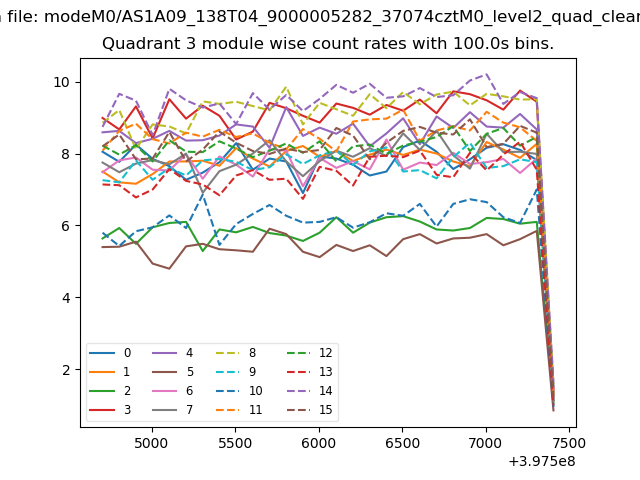
| Module-wise count rates for Quadrant A Data is divided into 100 sec bins |
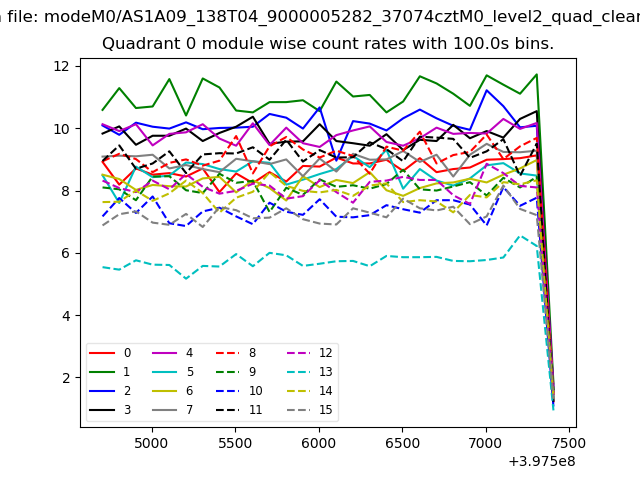 |
 |
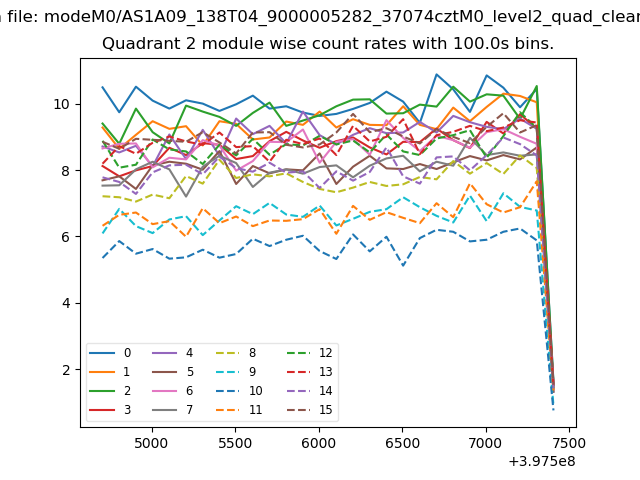
| Module-wise count rates for Quadrant B Data is divided into 100 sec bins |
 |
 |
| Module-wise count rates for Quadrant C Data is divided into 100 sec bins |
 |
 |
| Module-wise count rates for Quadrant D Data is divided into 100 sec bins |
 |
 |
| Parameter | Plot |
|---|---|
| CZT HV Monitor | 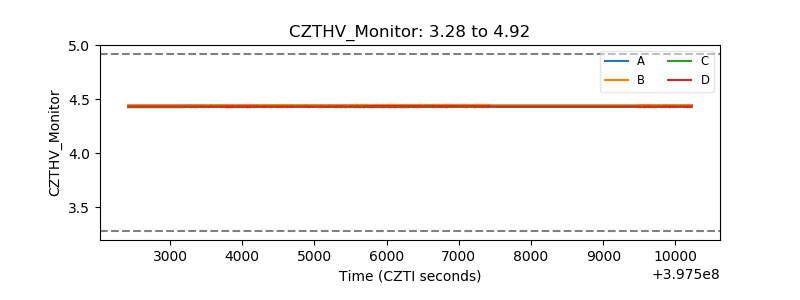 |
| D_VDD | 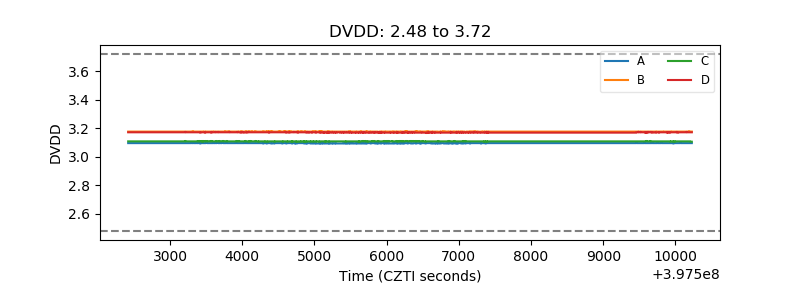 |
| Temperature 1 | 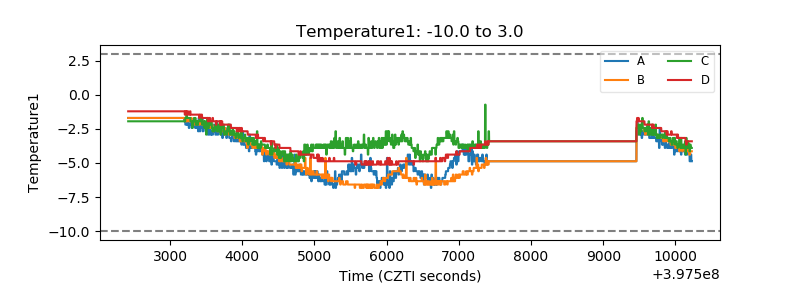 |
| Veto HV Monitor | 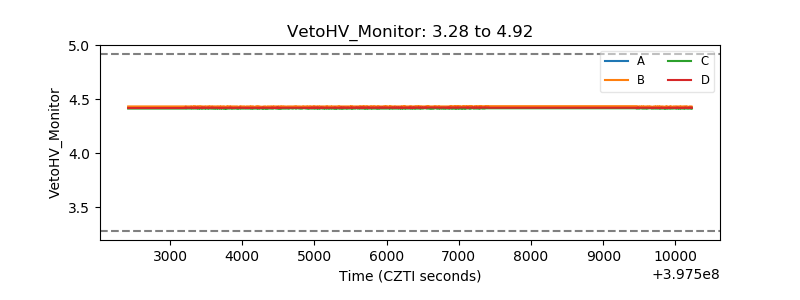 |
| Veto LLD | 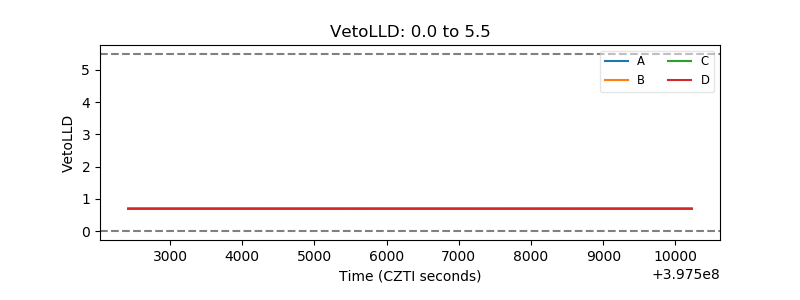 |
| Alpha Counter | 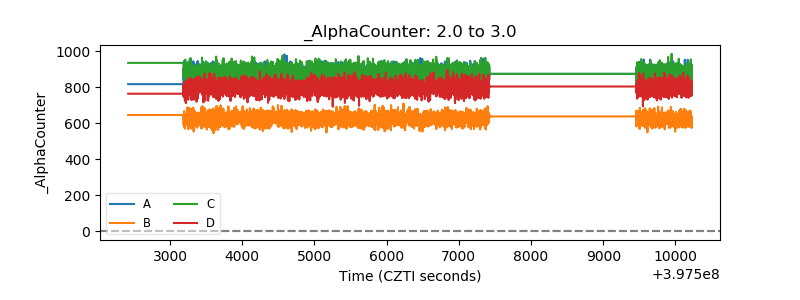 |
| _CPM_Rate | 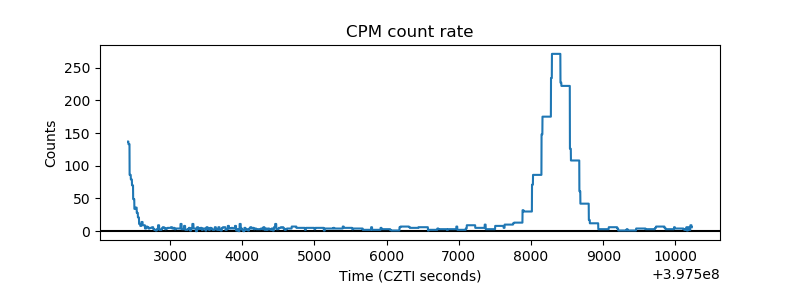 |
| CZT Counter | 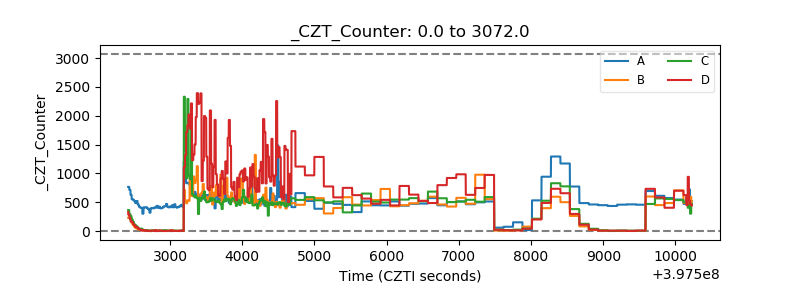 |
| +2.5 Volts monitor | 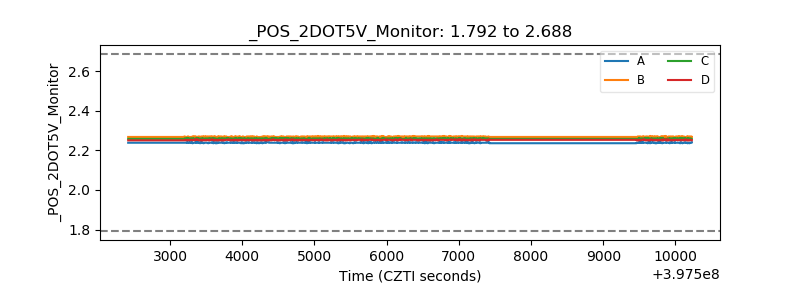 |
| +5 Volts monitor | 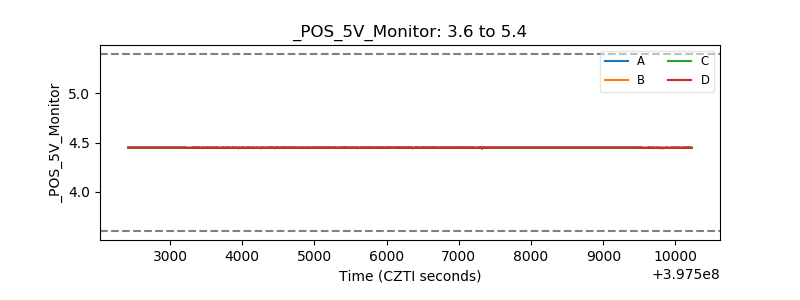 |
| _ROLL_ROT | 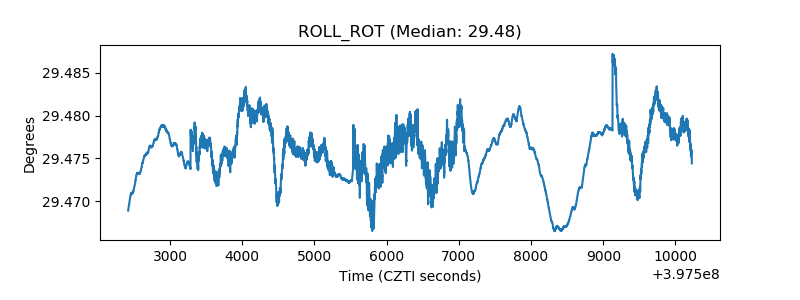 |
| _Roll_DEC | 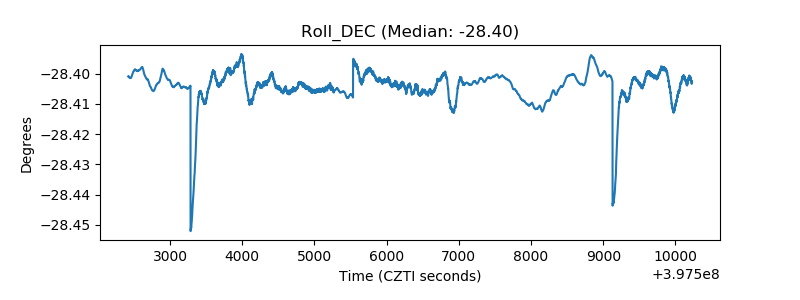 |
| _Roll_RA | 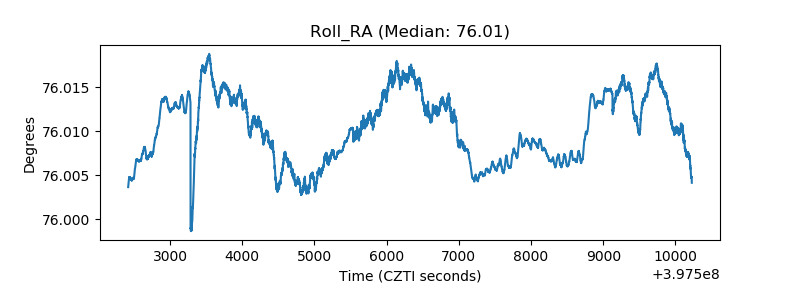 |
| Veto Counter | 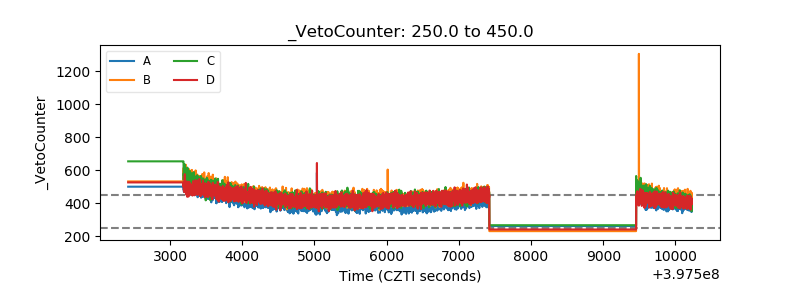 |