| Param | Original file | Final file |
|---|---|---|
| Filename | modeM0/AS1A09_138T04_9000005282_37075cztM0_level2.evt | modeM0/AS1A09_138T04_9000005282_37075cztM0_level2_quad_clean.evt |
| Size (bytes) | 407,214,720 | 71,222,400 |
| Size | 388.4 MB | 67.9 MB |
| Events in quadrant A | 2,696,531 | 459,361 |
| Events in quadrant B | 3,155,867 | 458,462 |
| Events in quadrant C | 2,811,816 | 446,017 |
| Events in quadrant D | 3,311,557 | 425,156 |
| Mode SS | |||
|---|---|---|---|
| Quadrant | BADHDUFLAG | Total packets | Discarded packets |
| A | 0 | 106 | 0 |
| B | 0 | 106 | 0 |
| C | 0 | 106 | 0 |
| D | 0 | 106 | 0 |
| Mode M0 | |||
|---|---|---|---|
| Quadrant | BADHDUFLAG | Total packets | Discarded packets |
| A | 0 | 11157 | 3 |
| B | 0 | 12697 | 2 |
| C | 0 | 11339 | 2 |
| D | 0 | 13318 | 2 |
| Mode M9 | |||
|---|---|---|---|
| Quadrant | BADHDUFLAG | Total packets | Discarded packets |
| A | 0 | 33 | 0 |
| B | 0 | 33 | 0 |
| C | 0 | 33 | 0 |
| D | 0 | 34 | 0 |
| Quadrant | Total seconds | Saturated seconds | Saturation percentage |
|---|---|---|---|
| A | 5252 | 11 | 0.209444% |
| B | 5252 | 242 | 4.607768% |
| C | 5252 | 52 | 0.990099% |
| D | 5252 | 161 | 3.065499% |
Noise dominated data is calculated using 1-second bins in cleaned event files. If a bin has >2000 counts, and if more than 50% of those come from <1% of pixels, then it is considered to be noise-dominated and hence unusable.
| Quadrant | # 1 sec bins | Bins with >0 counts | Bins with >2000 counts | High rate bins dominated by noise | Noise dominated (total time) | Noise dominated (detector-on time) | Marked lightcurve |
|---|---|---|---|---|---|---|---|
| A | 7016 | 5254 | 6 | 6 | 0.09% | 0.11% | 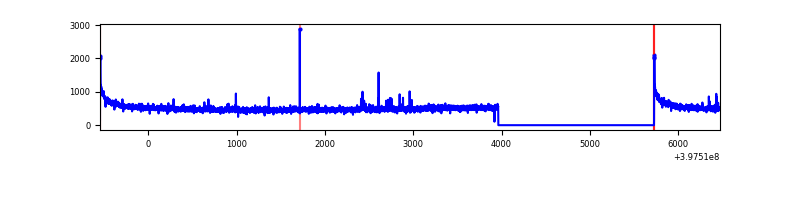 |
| B | 7016 | 5254 | 205 | 205 | 2.92% | 3.90% | 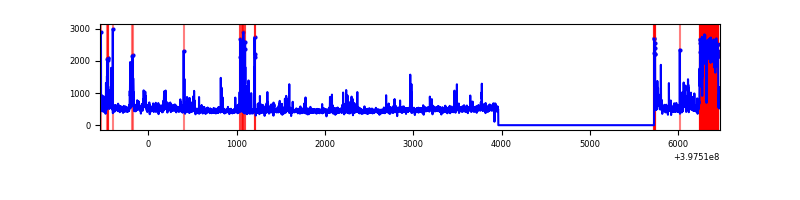 |
| C | 7016 | 5254 | 43 | 43 | 0.61% | 0.82% | 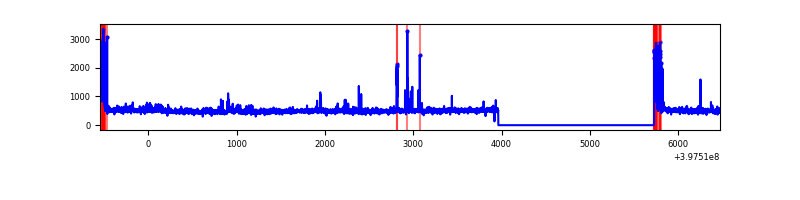 |
| D | 7016 | 5254 | 146 | 146 | 2.08% | 2.78% | 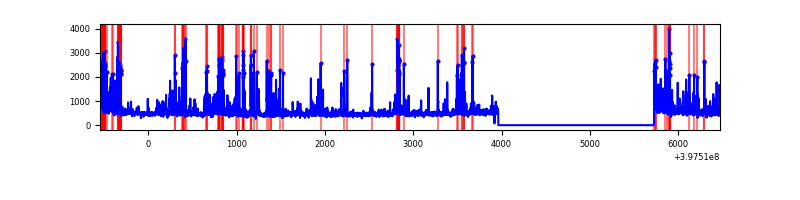 |
Top three noisy pixels from each quadrant. If the there are fewer than three noisy pixels in the level2.evt file, extra rows are filled as -1
| Pixel properties | Quadrant properties | ||||||
|---|---|---|---|---|---|---|---|
| Quadrant | DetID | PixID | Counts | Sigma | Mean | Median | Sigma |
| A | 10 | 83 | 262104 | 2093.13 | 618 | 607 | 124.9 |
| A | 7 | 3 | 27703 | 216.89 | 618 | 607 | 124.9 |
| A | 13 | 6 | 10836 | 81.88 | 618 | 607 | 124.9 |
| B | 0 | 229 | 538446 | 4653.71 | 603 | 587 | 115.6 |
| B | 5 | 172 | 81645 | 701.34 | 603 | 587 | 115.6 |
| B | 5 | 184 | 61278 | 525.12 | 603 | 587 | 115.6 |
| C | 15 | 214 | 222524 | 1589.45 | 597 | 603 | 139.6 |
| C | 0 | 10 | 174132 | 1242.86 | 597 | 603 | 139.6 |
| C | 14 | 254 | 28761 | 201.67 | 597 | 603 | 139.6 |
| D | 1 | 52 | 195167 | 1355.61 | 593 | 577 | 143.5 |
| D | 1 | 47 | 171960 | 1193.94 | 593 | 577 | 143.5 |
| D | 13 | 171 | 165350 | 1147.89 | 593 | 577 | 143.5 |
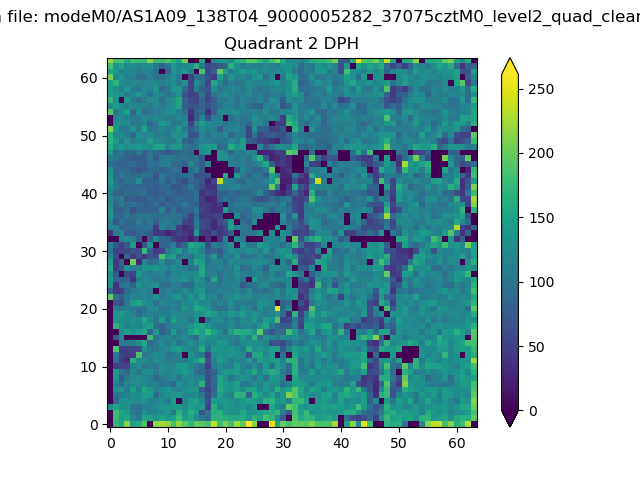
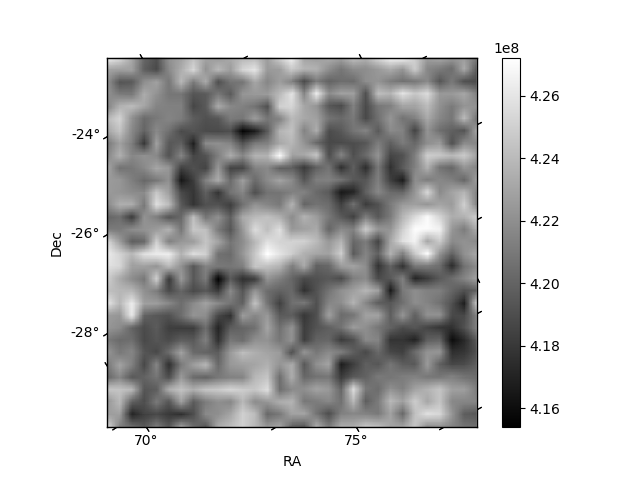
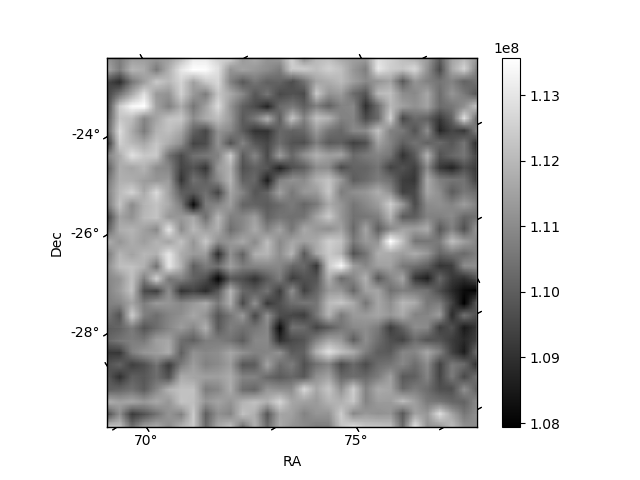
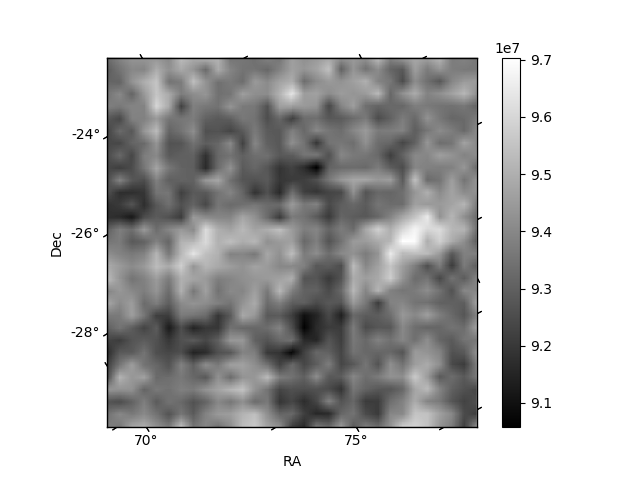
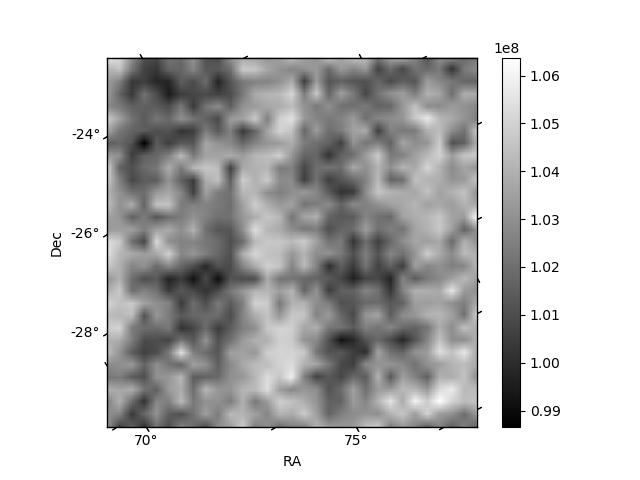
Histogram calculated using DETX and DETY for each event in the final _common_clean file
| Quadrant A | 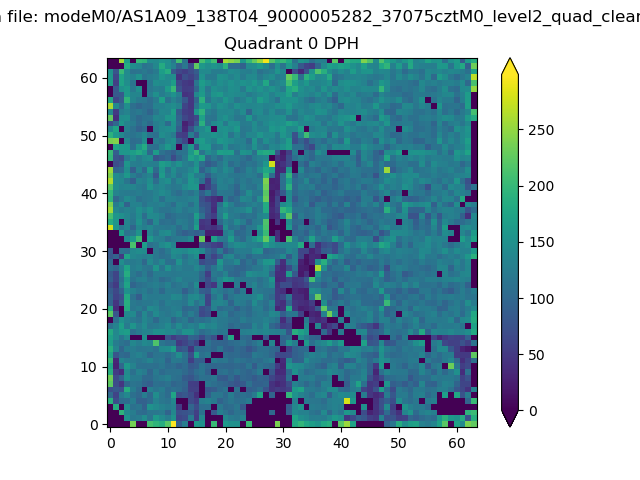 |
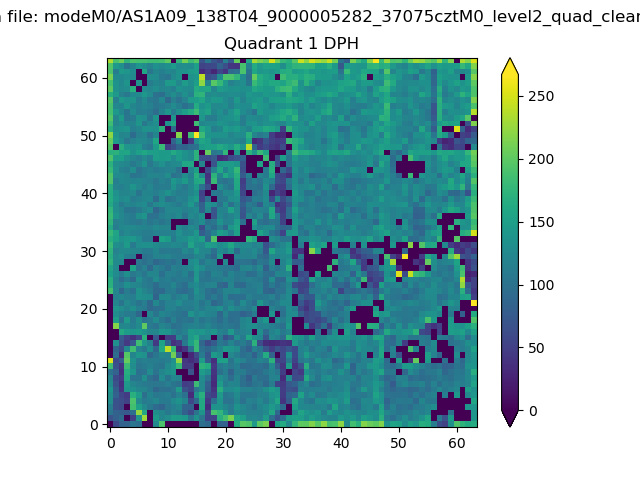 |
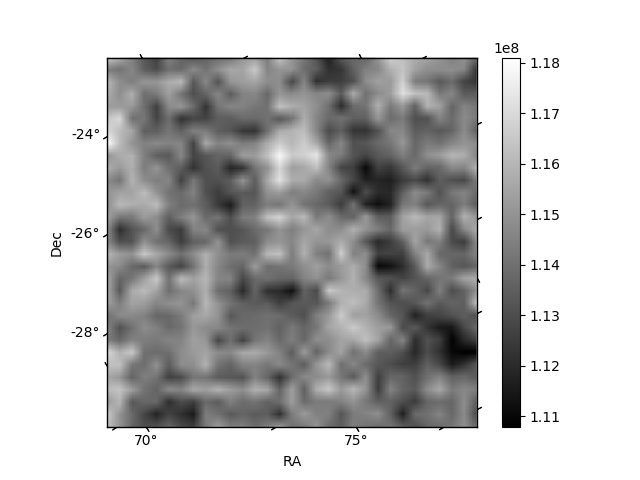
Quadrant B |
|---|---|---|---|
| Quadrant D | 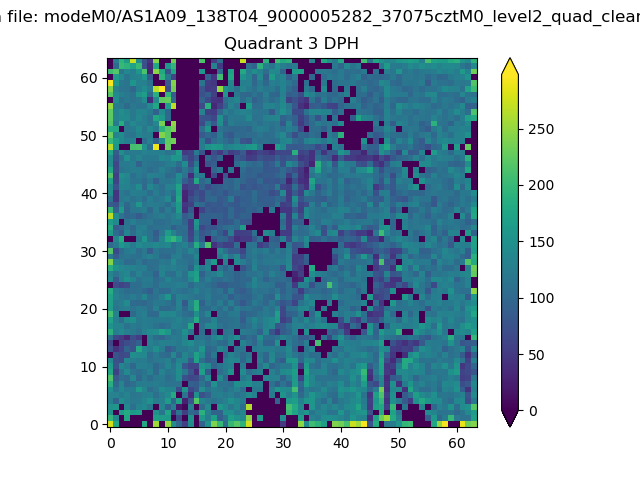 |
 |
Quadrant C |
| Plot type | Count rate plots | Images |
|---|---|---|
| Comparison with Poisson distribution Blue bars denote a histogram of data divided into 1 sec bins. Red curve is a Poisson curve with rate = median count rate of data. |
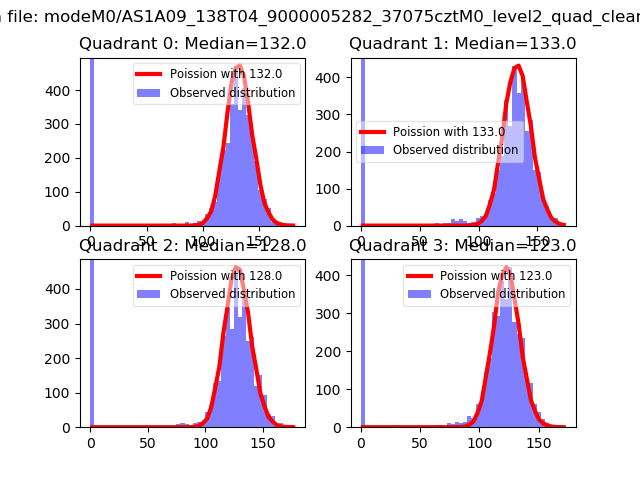 |
 |
| Quadrant-wise count rates Data is divided into 100 sec bins |
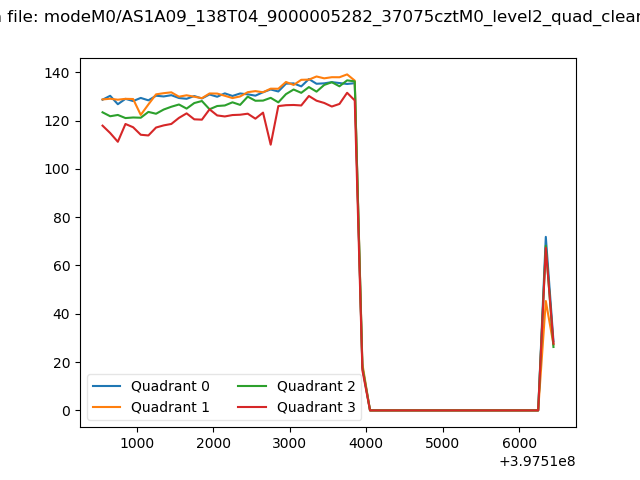 |
|
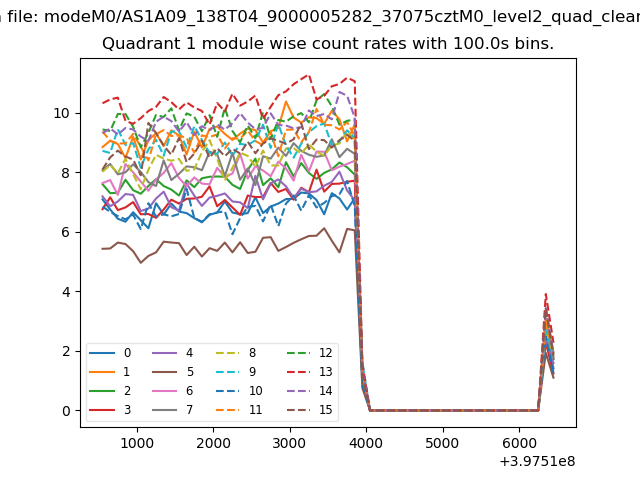
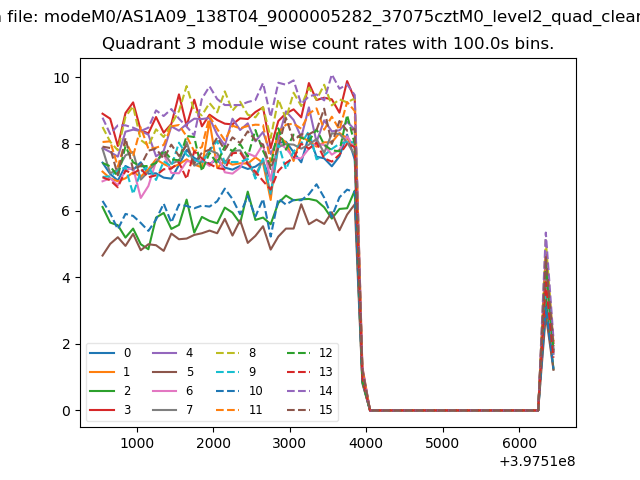
| Module-wise count rates for Quadrant A Data is divided into 100 sec bins |
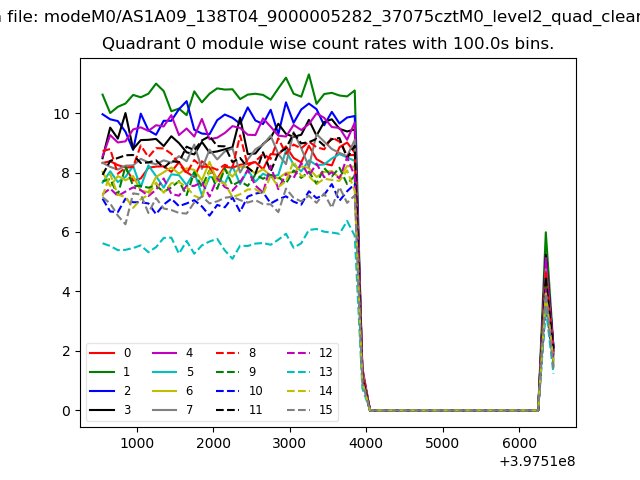 |
 |
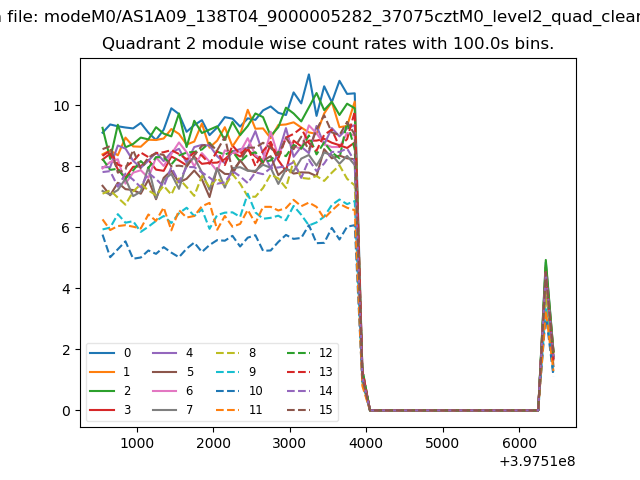
| Module-wise count rates for Quadrant B Data is divided into 100 sec bins |
 |
 |
| Module-wise count rates for Quadrant C Data is divided into 100 sec bins |
 |
 |
| Module-wise count rates for Quadrant D Data is divided into 100 sec bins |
 |
 |
| Parameter | Plot |
|---|---|
| CZT HV Monitor | 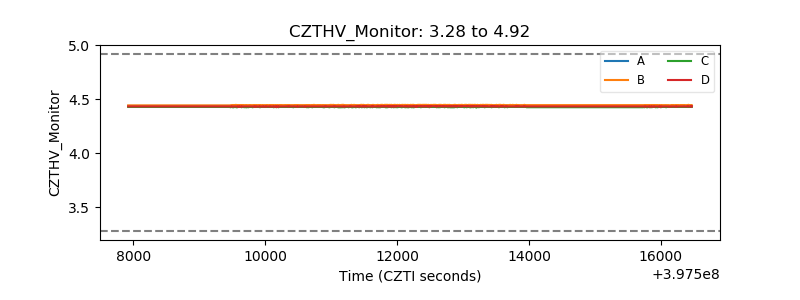 |
| D_VDD | 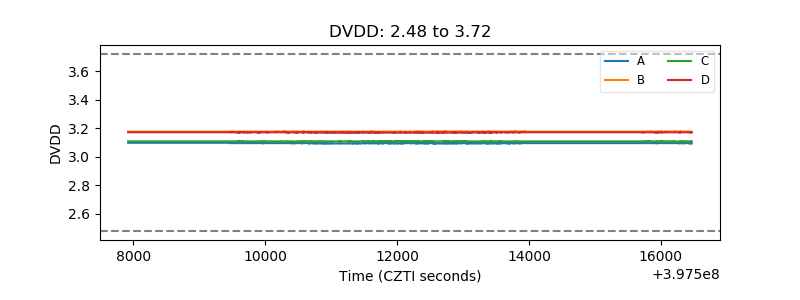 |
| Temperature 1 | 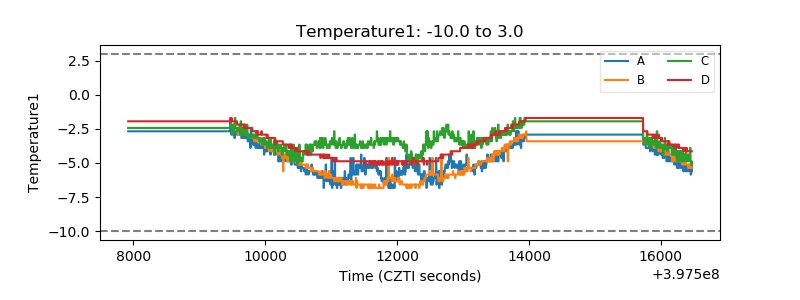 |
| Veto HV Monitor | 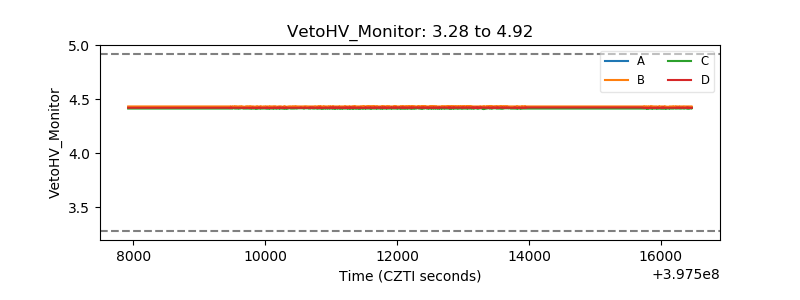 |
| Veto LLD | 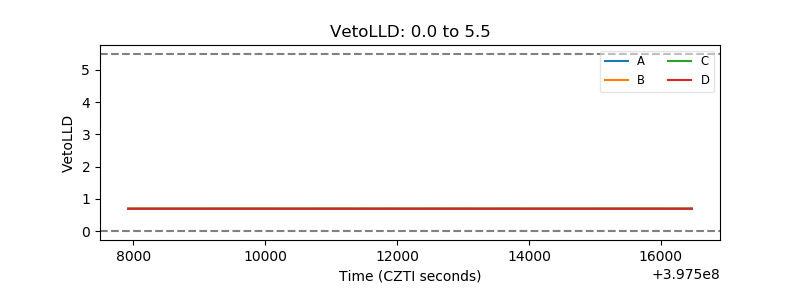 |
| Alpha Counter | 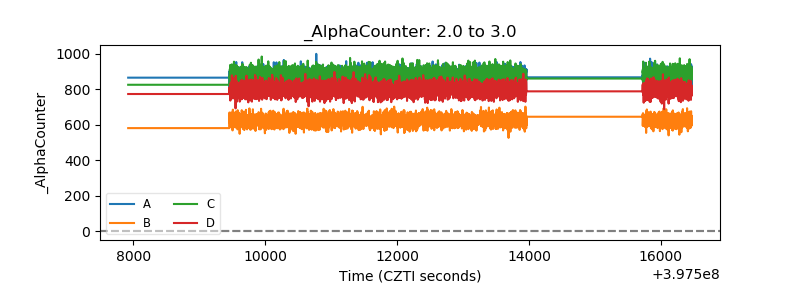 |
| _CPM_Rate | 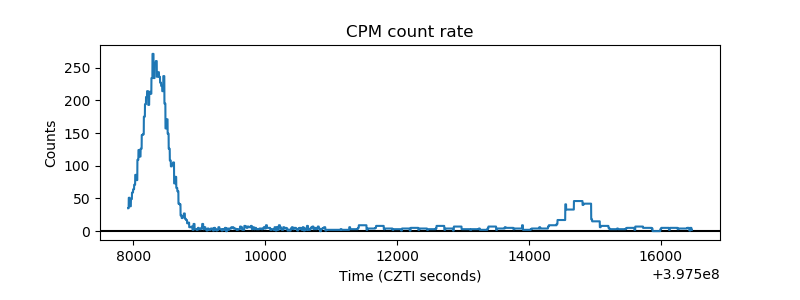 |
| CZT Counter | 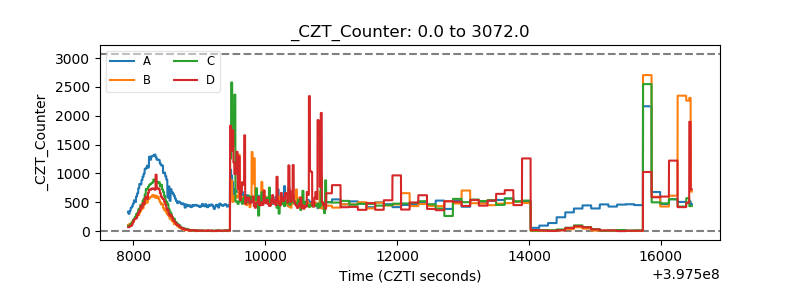 |
| +2.5 Volts monitor | 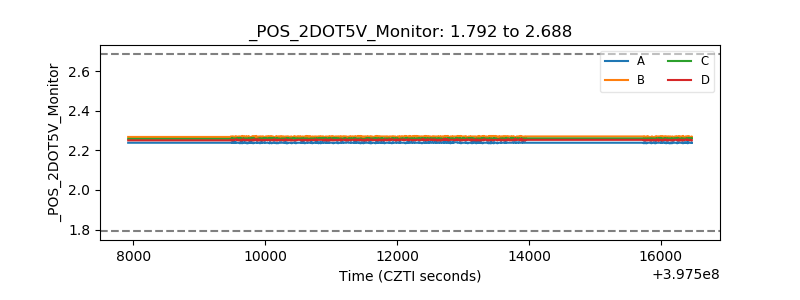 |
| +5 Volts monitor |  |
| _ROLL_ROT | 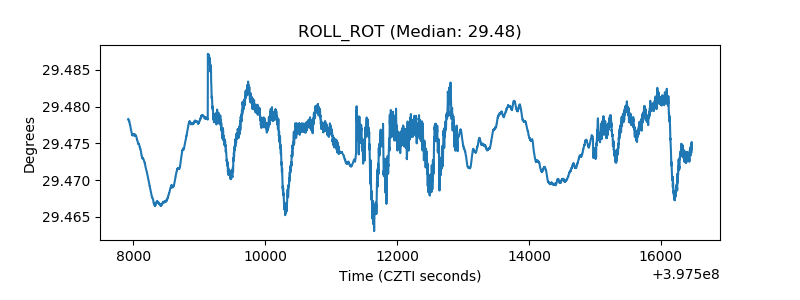 |
| _Roll_DEC | 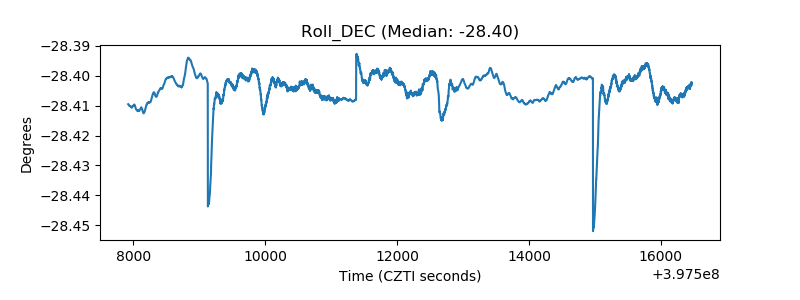 |
| _Roll_RA |  |
| Veto Counter | 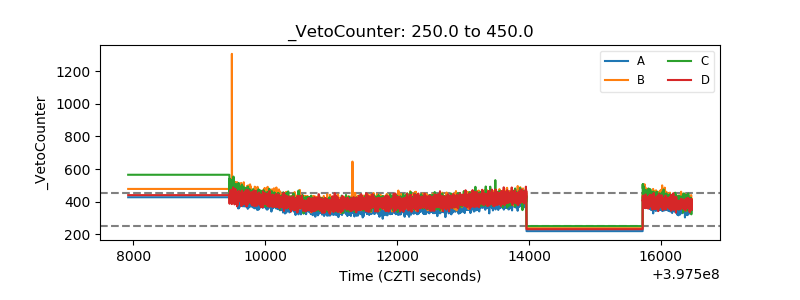 |