| Param | Original file | Final file |
|---|---|---|
| Filename | modeM0/AS1A09_138T04_9000005282_37076cztM0_level2.evt | modeM0/AS1A09_138T04_9000005282_37076cztM0_level2_quad_clean.evt |
| Size (bytes) | 445,392,000 | 79,977,600 |
| Size | 424.8 MB | 76.3 MB |
| Events in quadrant A | 2,846,961 | 523,089 |
| Events in quadrant B | 3,745,459 | 512,359 |
| Events in quadrant C | 3,012,835 | 507,418 |
| Events in quadrant D | 3,504,380 | 488,541 |
| Mode SS | |||
|---|---|---|---|
| Quadrant | BADHDUFLAG | Total packets | Discarded packets |
| A | 0 | 114 | 0 |
| B | 0 | 114 | 0 |
| C | 0 | 114 | 0 |
| D | 0 | 114 | 0 |
| Mode M0 | |||
|---|---|---|---|
| Quadrant | BADHDUFLAG | Total packets | Discarded packets |
| A | 0 | 11859 | 3 |
| B | 0 | 14717 | 2 |
| C | 0 | 12208 | 2 |
| D | 0 | 14130 | 2 |
| Mode M9 | |||
|---|---|---|---|
| Quadrant | BADHDUFLAG | Total packets | Discarded packets |
| A | 0 | 22 | 0 |
| B | 0 | 22 | 0 |
| C | 0 | 22 | 0 |
| D | 0 | 23 | 0 |
| Quadrant | Total seconds | Saturated seconds | Saturation percentage |
|---|---|---|---|
| A | 5579 | 20 | 0.358487% |
| B | 5579 | 379 | 6.793332% |
| C | 5579 | 51 | 0.914142% |
| D | 5579 | 66 | 1.183008% |
Noise dominated data is calculated using 1-second bins in cleaned event files. If a bin has >2000 counts, and if more than 50% of those come from <1% of pixels, then it is considered to be noise-dominated and hence unusable.
| Quadrant | # 1 sec bins | Bins with >0 counts | Bins with >2000 counts | High rate bins dominated by noise | Noise dominated (total time) | Noise dominated (detector-on time) | Marked lightcurve |
|---|---|---|---|---|---|---|---|
| A | 7013 | 5580 | 8 | 8 | 0.11% | 0.14% | 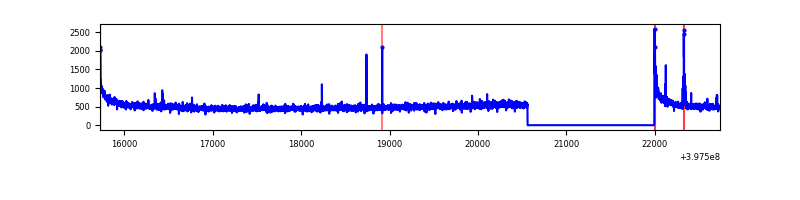 |
| B | 7013 | 5580 | 328 | 328 | 4.68% | 5.88% | 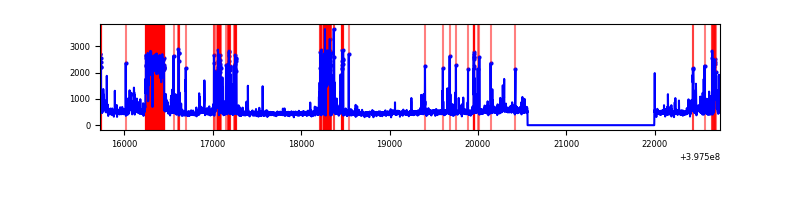 |
| C | 7013 | 5580 | 41 | 41 | 0.58% | 0.73% | 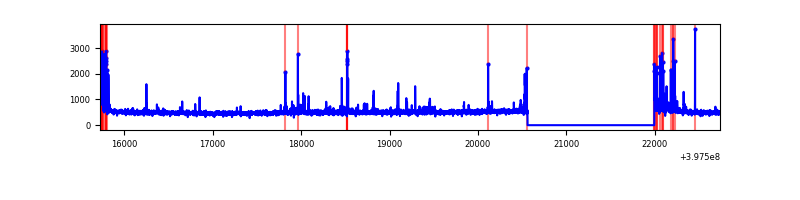 |
| D | 7013 | 5580 | 46 | 46 | 0.66% | 0.82% | 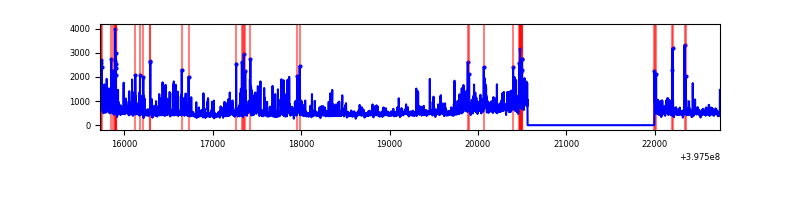 |
Top three noisy pixels from each quadrant. If the there are fewer than three noisy pixels in the level2.evt file, extra rows are filled as -1
| Pixel properties | Quadrant properties | ||||||
|---|---|---|---|---|---|---|---|
| Quadrant | DetID | PixID | Counts | Sigma | Mean | Median | Sigma |
| A | 10 | 83 | 268461 | 2032.45 | 650 | 635 | 131.8 |
| A | 7 | 3 | 36521 | 272.33 | 650 | 635 | 131.8 |
| A | 13 | 6 | 16928 | 123.64 | 650 | 635 | 131.8 |
| B | 0 | 229 | 885371 | 7339.18 | 629 | 613 | 120.6 |
| B | 5 | 172 | 134754 | 1112.72 | 629 | 613 | 120.6 |
| B | 5 | 200 | 126779 | 1046.56 | 629 | 613 | 120.6 |
| C | 15 | 214 | 235555 | 1588.24 | 630 | 634 | 147.9 |
| C | 0 | 10 | 110906 | 745.52 | 630 | 634 | 147.9 |
| C | 1 | 23 | 55849 | 373.3 | 630 | 634 | 147.9 |
| D | 1 | 52 | 386447 | 2517.39 | 629 | 613 | 153.3 |
| D | 2 | 249 | 208066 | 1353.54 | 629 | 613 | 153.3 |
| D | 13 | 171 | 142483 | 925.64 | 629 | 613 | 153.3 |
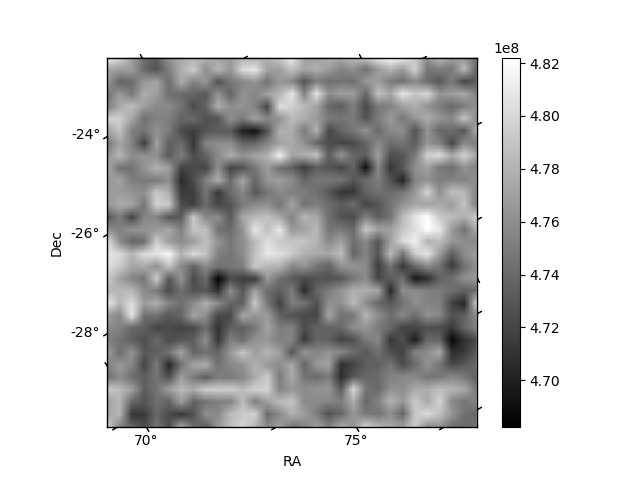
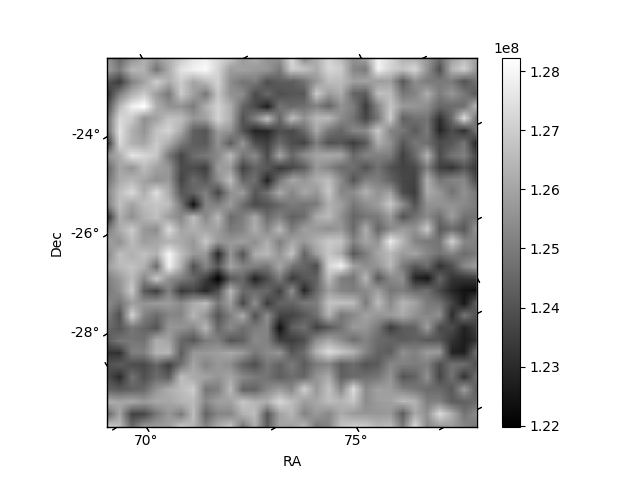
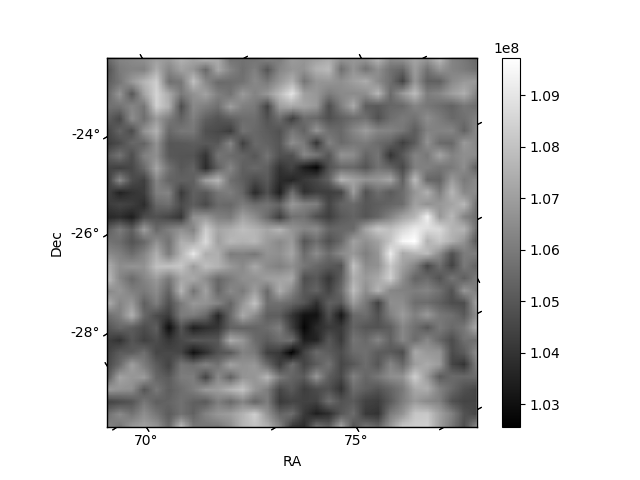
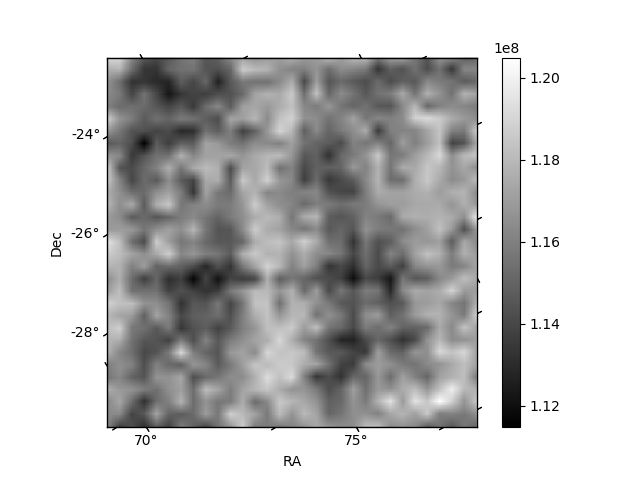
Histogram calculated using DETX and DETY for each event in the final _common_clean file
| Quadrant A | 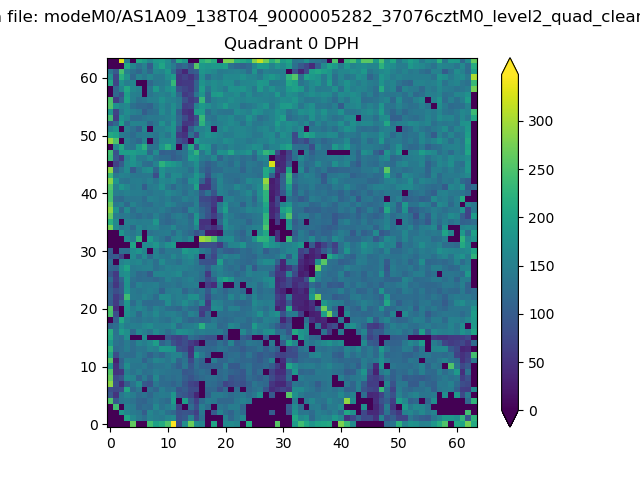 |
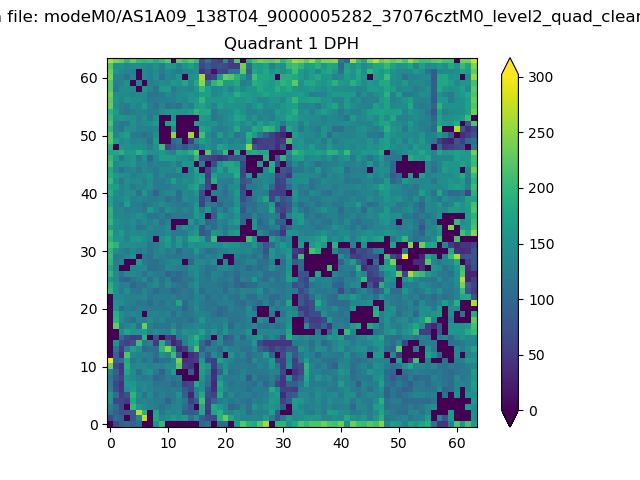 |
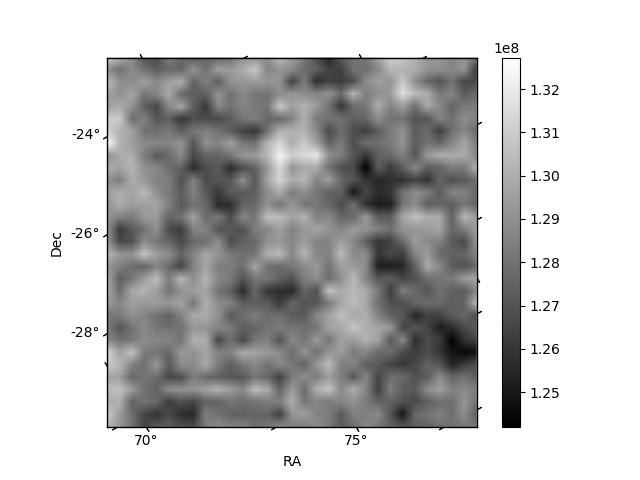
Quadrant B |
|---|---|---|---|
| Quadrant D | 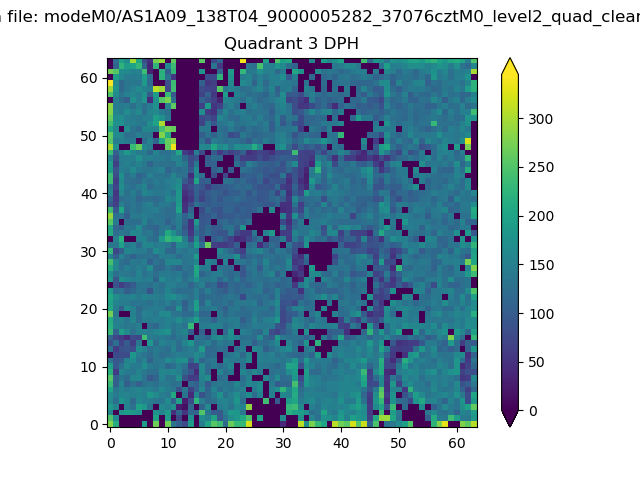 |
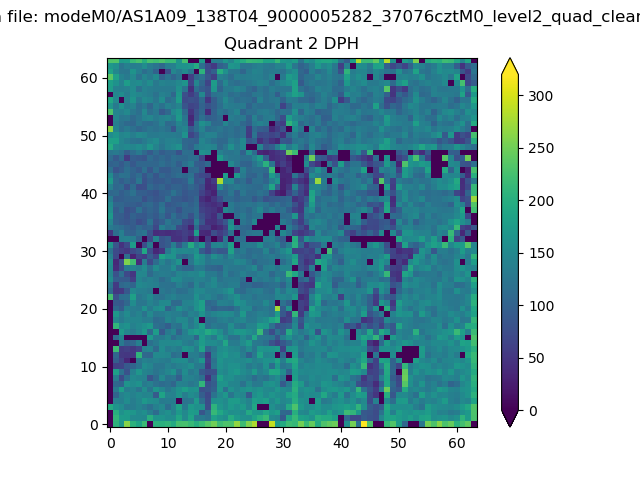 |
Quadrant C |
| Plot type | Count rate plots | Images |
|---|---|---|
| Comparison with Poisson distribution Blue bars denote a histogram of data divided into 1 sec bins. Red curve is a Poisson curve with rate = median count rate of data. |
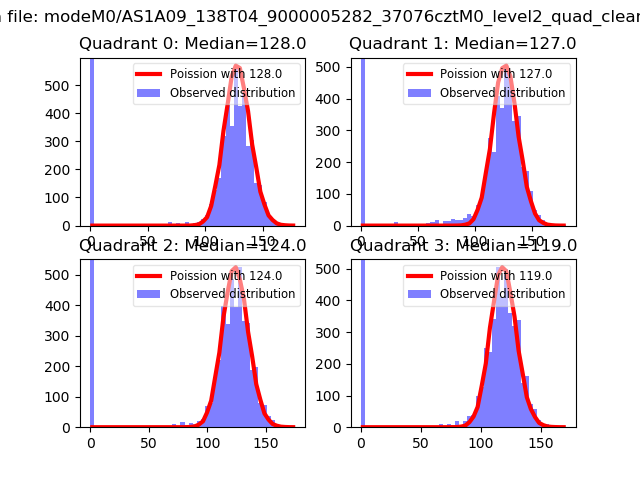 |
 |
| Quadrant-wise count rates Data is divided into 100 sec bins |
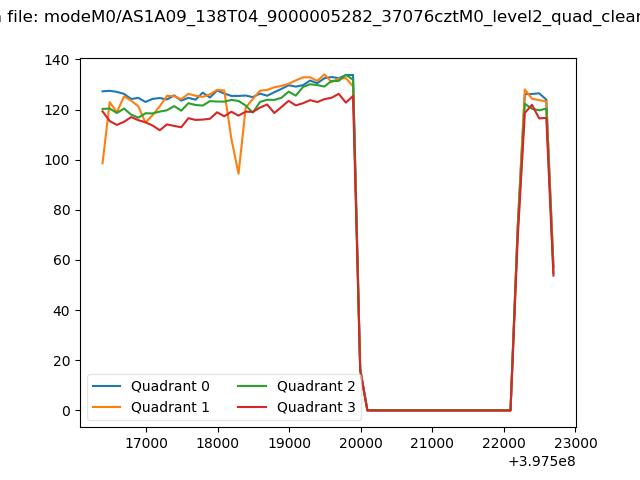 |
|
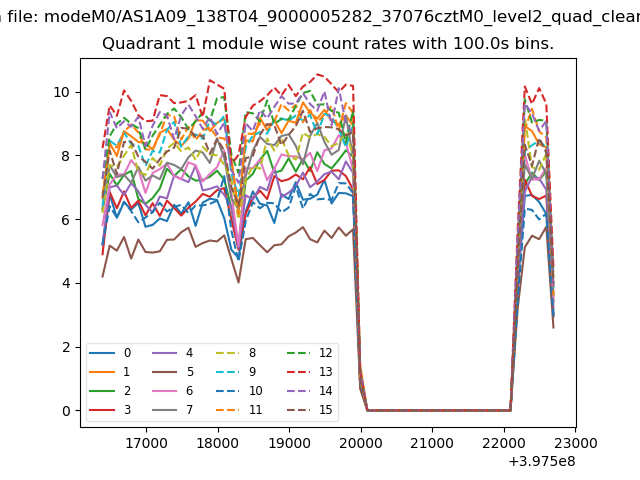
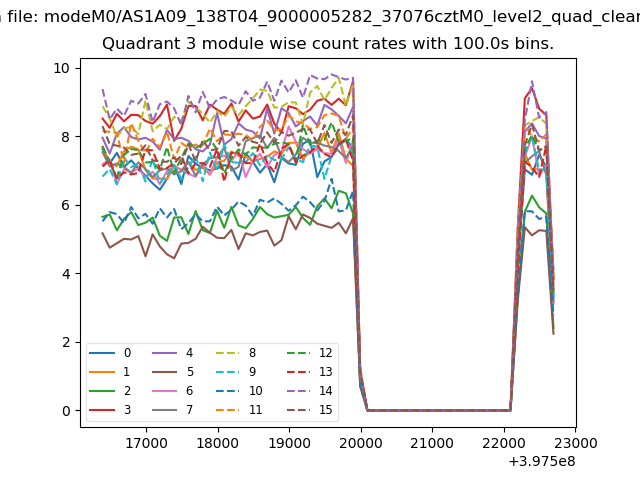
| Module-wise count rates for Quadrant A Data is divided into 100 sec bins |
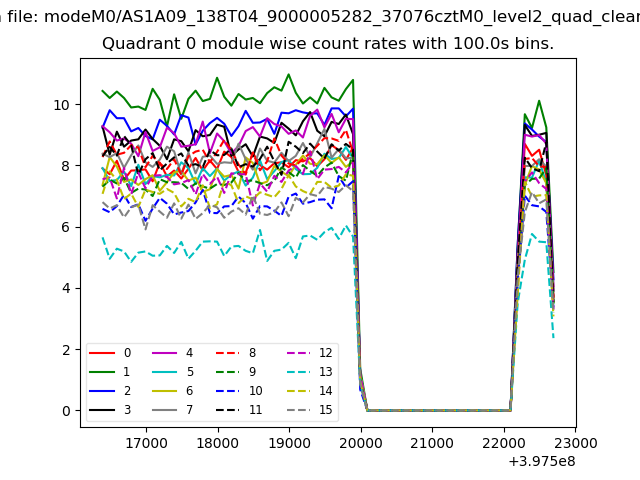 |
 |
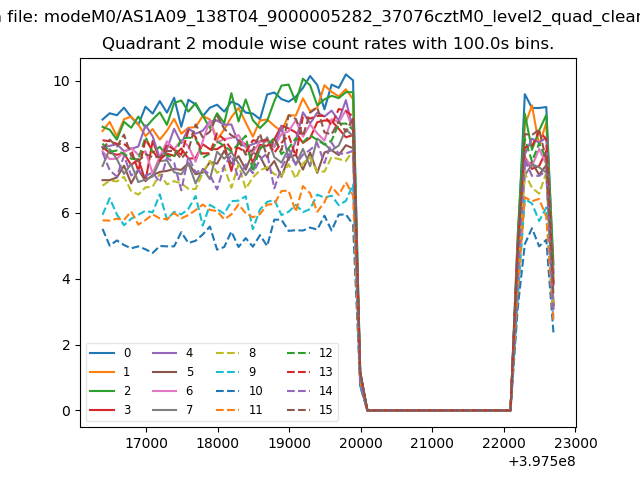
| Module-wise count rates for Quadrant B Data is divided into 100 sec bins |
 |
 |
| Module-wise count rates for Quadrant C Data is divided into 100 sec bins |
 |
 |
| Module-wise count rates for Quadrant D Data is divided into 100 sec bins |
 |
 |
| Parameter | Plot |
|---|---|
| CZT HV Monitor | 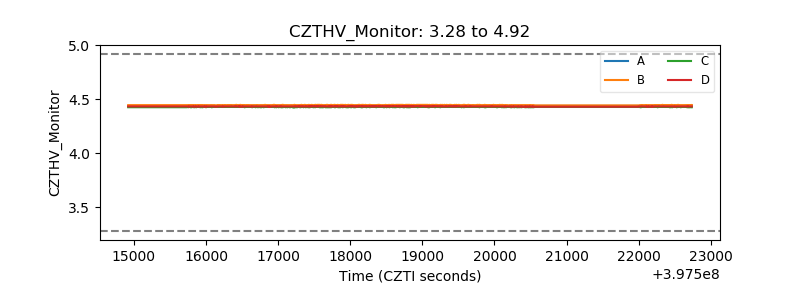 |
| D_VDD | 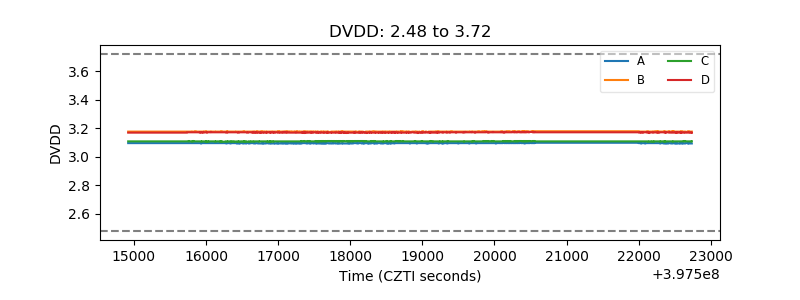 |
| Temperature 1 | 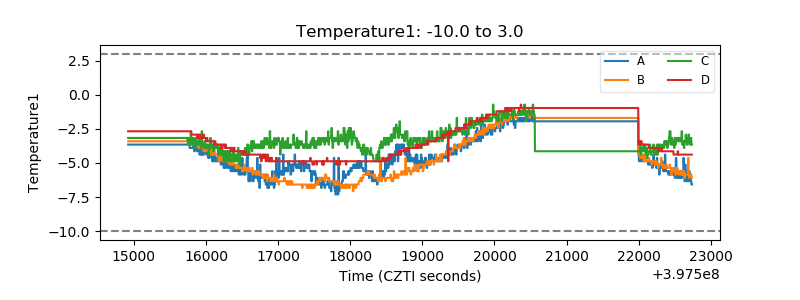 |
| Veto HV Monitor | 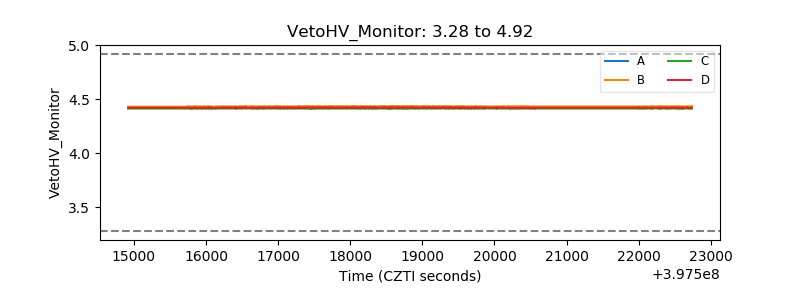 |
| Veto LLD | 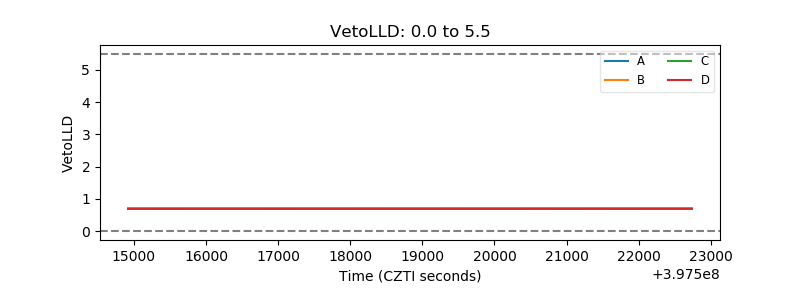 |
| Alpha Counter | 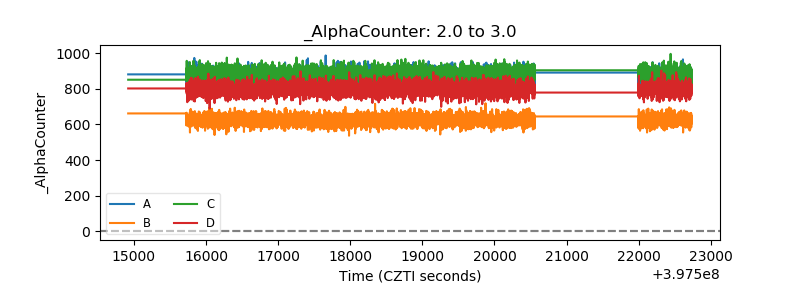 |
| _CPM_Rate | 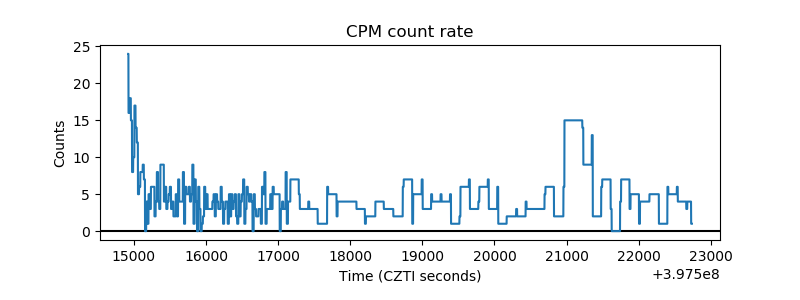 |
| CZT Counter | 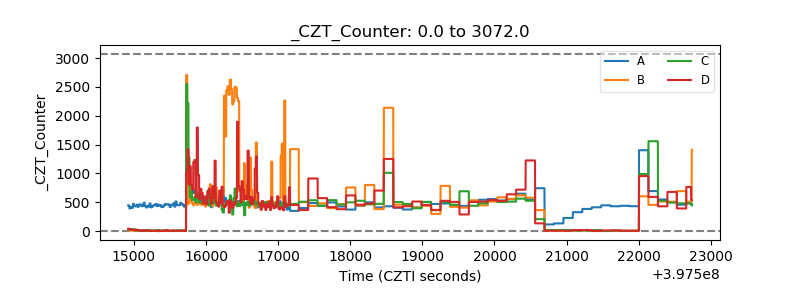 |
| +2.5 Volts monitor | 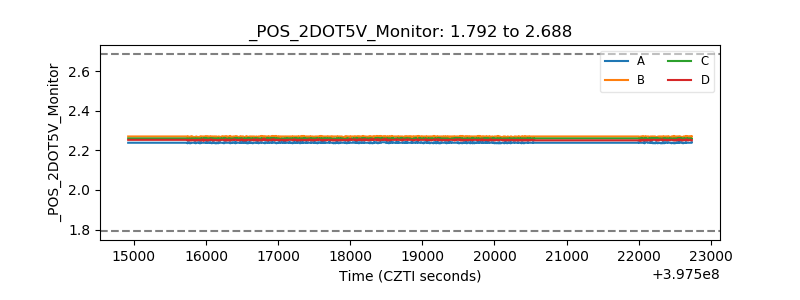 |
| +5 Volts monitor | 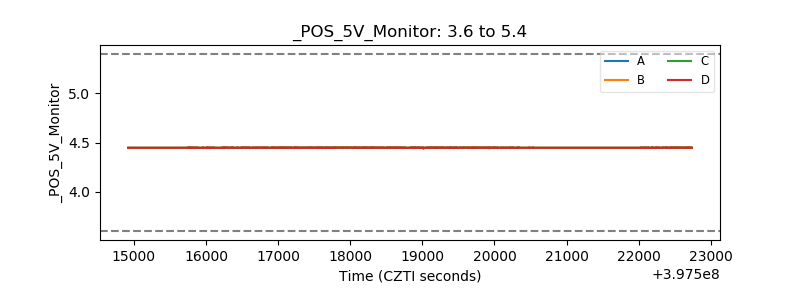 |
| _ROLL_ROT | 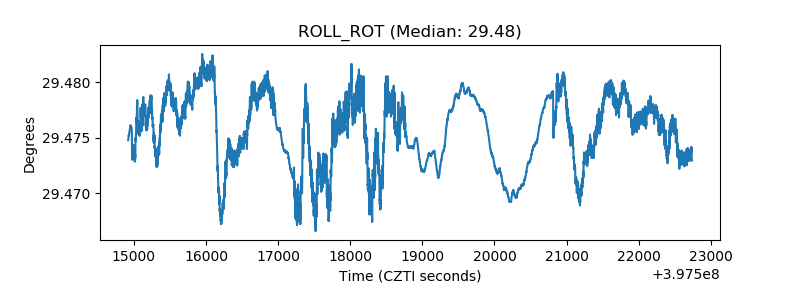 |
| _Roll_DEC | 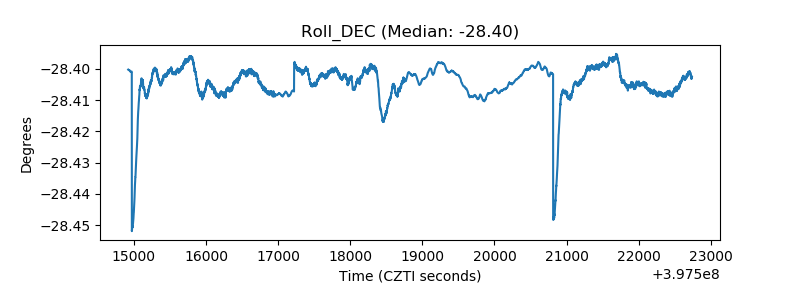 |
| _Roll_RA | 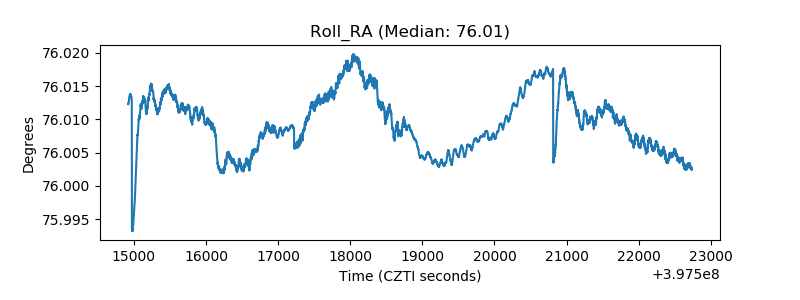 |
| Veto Counter | 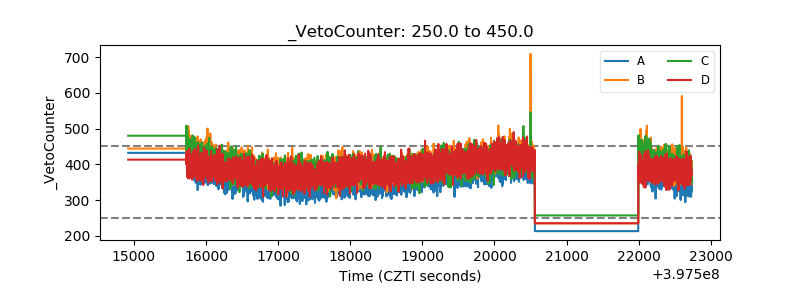 |