| Param | Original file | Final file |
|---|---|---|
| Filename | modeM0/AS1A09_138T04_9000005282_37077cztM0_level2.evt | modeM0/AS1A09_138T04_9000005282_37077cztM0_level2_quad_clean.evt |
| Size (bytes) | 487,022,400 | 87,842,880 |
| Size | 464.5 MB | 83.8 MB |
| Events in quadrant A | 3,366,240 | 564,925 |
| Events in quadrant B | 3,437,056 | 568,025 |
| Events in quadrant C | 3,397,184 | 553,926 |
| Events in quadrant D | 4,115,432 | 527,339 |
| Mode SS | |||
|---|---|---|---|
| Quadrant | BADHDUFLAG | Total packets | Discarded packets |
| A | 0 | 132 | 0 |
| B | 0 | 132 | 0 |
| C | 0 | 132 | 0 |
| D | 0 | 132 | 0 |
| Mode M0 | |||
|---|---|---|---|
| Quadrant | BADHDUFLAG | Total packets | Discarded packets |
| A | 0 | 13966 | 3 |
| B | 0 | 14464 | 2 |
| C | 0 | 13786 | 2 |
| D | 0 | 16480 | 2 |
| Mode M9 | |||
|---|---|---|---|
| Quadrant | BADHDUFLAG | Total packets | Discarded packets |
| A | 0 | 27 | 0 |
| B | 0 | 27 | 0 |
| C | 0 | 27 | 0 |
| D | 0 | 27 | 0 |
| Quadrant | Total seconds | Saturated seconds | Saturation percentage |
|---|---|---|---|
| A | 6390 | 34 | 0.532081% |
| B | 6390 | 74 | 1.158059% |
| C | 6390 | 43 | 0.672926% |
| D | 6390 | 145 | 2.269171% |
Noise dominated data is calculated using 1-second bins in cleaned event files. If a bin has >2000 counts, and if more than 50% of those come from <1% of pixels, then it is considered to be noise-dominated and hence unusable.
| Quadrant | # 1 sec bins | Bins with >0 counts | Bins with >2000 counts | High rate bins dominated by noise | Noise dominated (total time) | Noise dominated (detector-on time) | Marked lightcurve |
|---|---|---|---|---|---|---|---|
| A | 9137 | 6392 | 18 | 18 | 0.20% | 0.28% | 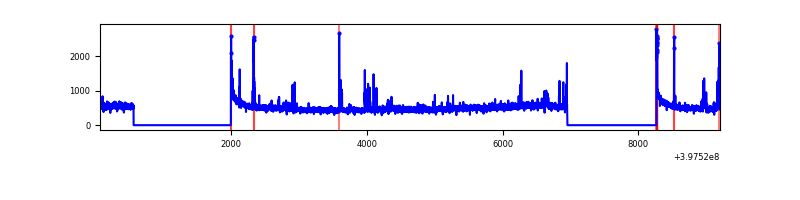 |
| B | 9137 | 6392 | 36 | 36 | 0.39% | 0.56% | 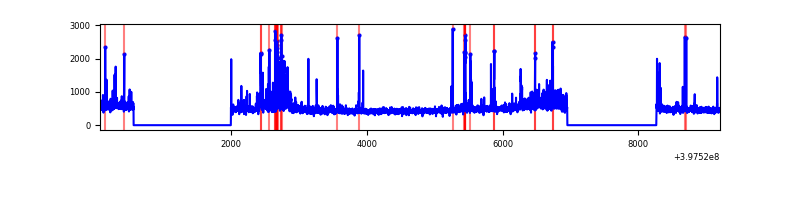 |
| C | 9137 | 6392 | 30 | 30 | 0.33% | 0.47% | 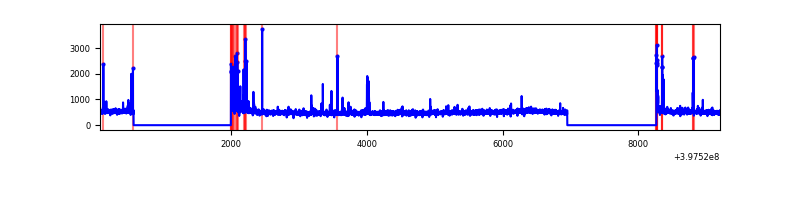 |
| D | 9137 | 6391 | 128 | 128 | 1.40% | 2.00% | 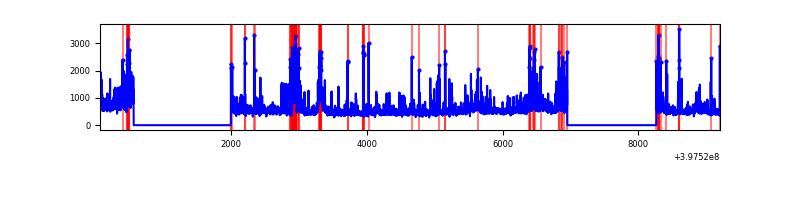 |
Top three noisy pixels from each quadrant. If the there are fewer than three noisy pixels in the level2.evt file, extra rows are filled as -1
| Pixel properties | Quadrant properties | ||||||
|---|---|---|---|---|---|---|---|
| Quadrant | DetID | PixID | Counts | Sigma | Mean | Median | Sigma |
| A | 10 | 83 | 290939 | 1927.82 | 747 | 734 | 150.5 |
| A | 9 | 143 | 91110 | 600.36 | 747 | 734 | 150.5 |
| A | 7 | 3 | 75139 | 494.27 | 747 | 734 | 150.5 |
| B | 5 | 200 | 180975 | 1261.55 | 739 | 718 | 142.9 |
| B | 0 | 190 | 94664 | 657.49 | 739 | 718 | 142.9 |
| B | 5 | 172 | 90554 | 628.73 | 739 | 718 | 142.9 |
| C | 15 | 214 | 269777 | 1580.8 | 725 | 730 | 170.2 |
| C | 1 | 23 | 115532 | 674.53 | 725 | 730 | 170.2 |
| C | 0 | 10 | 95790 | 558.53 | 725 | 730 | 170.2 |
| D | 2 | 249 | 325015 | 1833.93 | 723 | 703 | 176.8 |
| D | 2 | 153 | 317100 | 1789.18 | 723 | 703 | 176.8 |
| D | 1 | 52 | 212036 | 1195.05 | 723 | 703 | 176.8 |
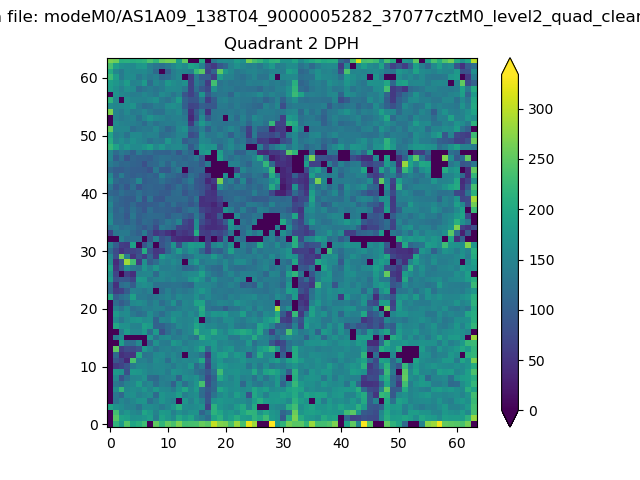
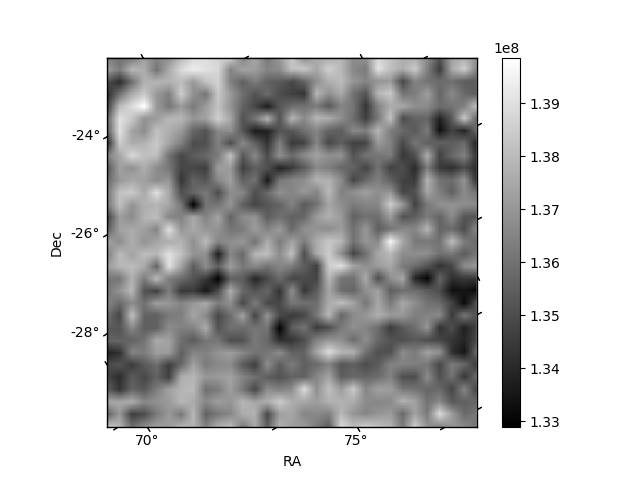
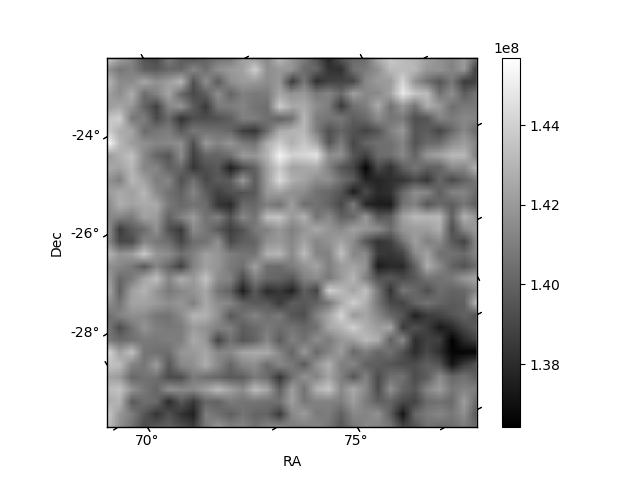
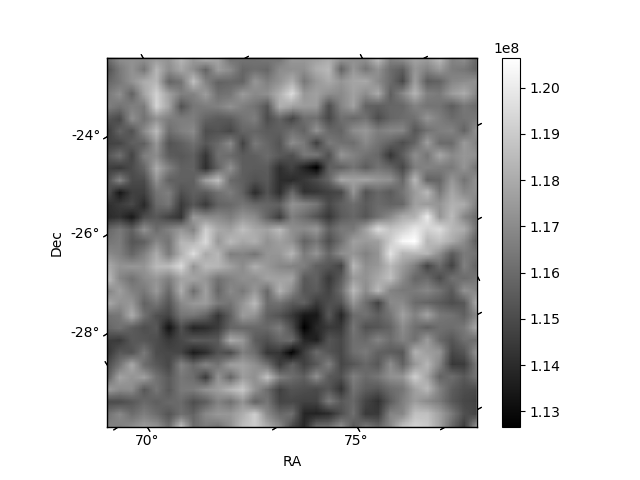
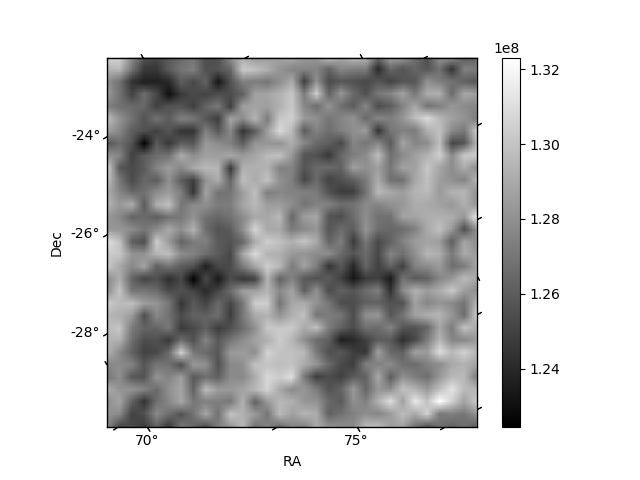
Histogram calculated using DETX and DETY for each event in the final _common_clean file
| Quadrant A | 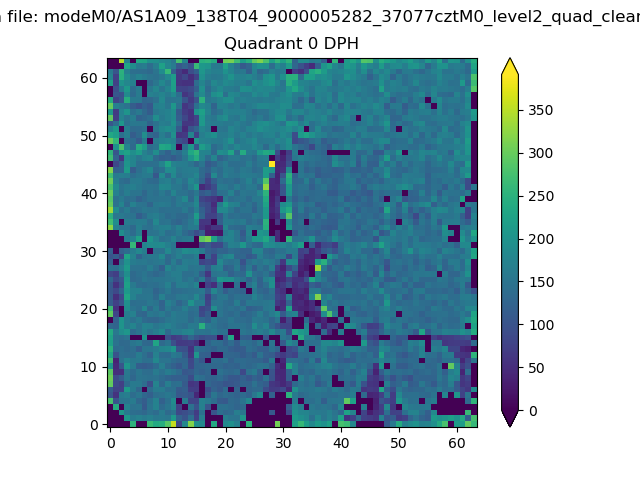 |
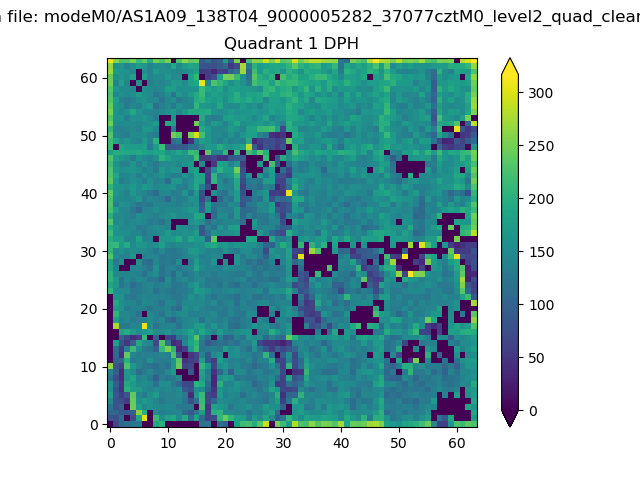 |
Quadrant B |
|---|---|---|---|
| Quadrant D | 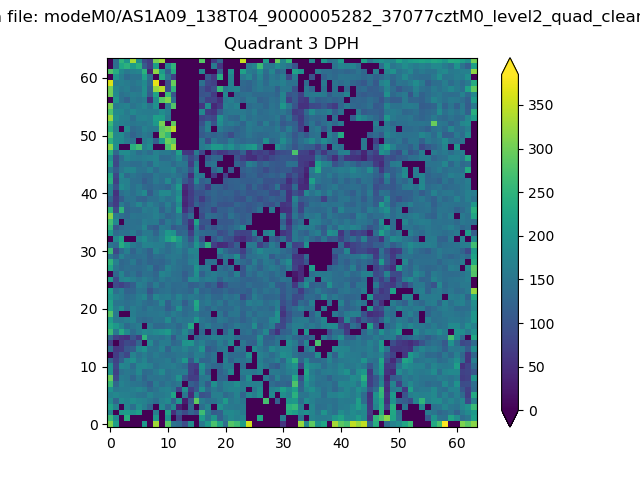 |
 |
Quadrant C |
| Plot type | Count rate plots | Images |
|---|---|---|
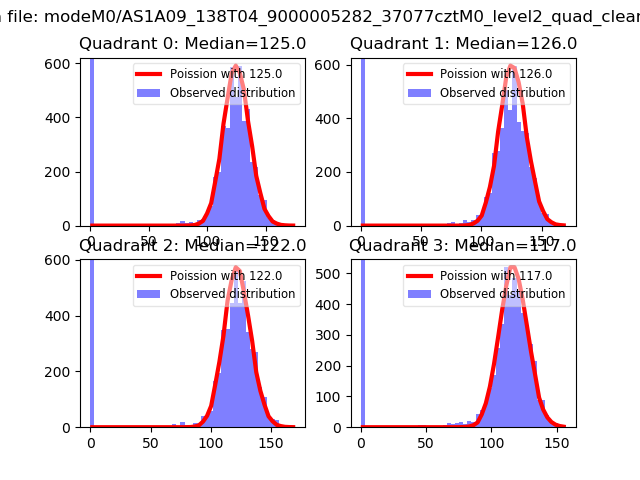
| Comparison with Poisson distribution Blue bars denote a histogram of data divided into 1 sec bins. Red curve is a Poisson curve with rate = median count rate of data. |
 |
 |
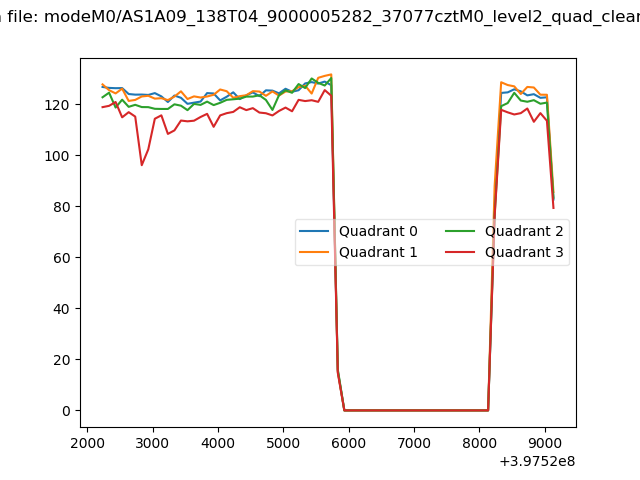
| Quadrant-wise count rates Data is divided into 100 sec bins |
 |
|
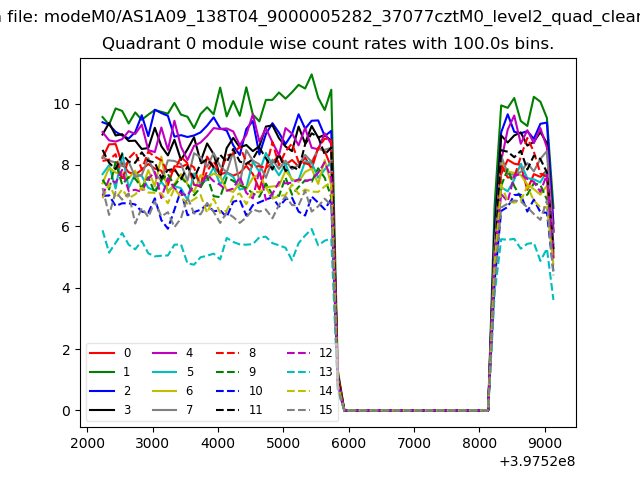
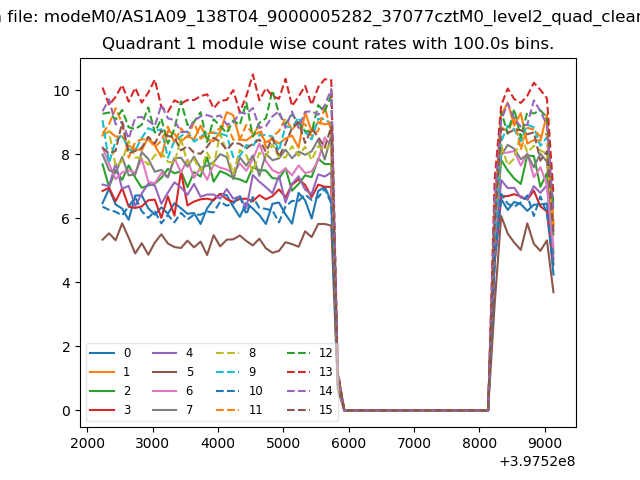
| Module-wise count rates for Quadrant A Data is divided into 100 sec bins |
 |
 |
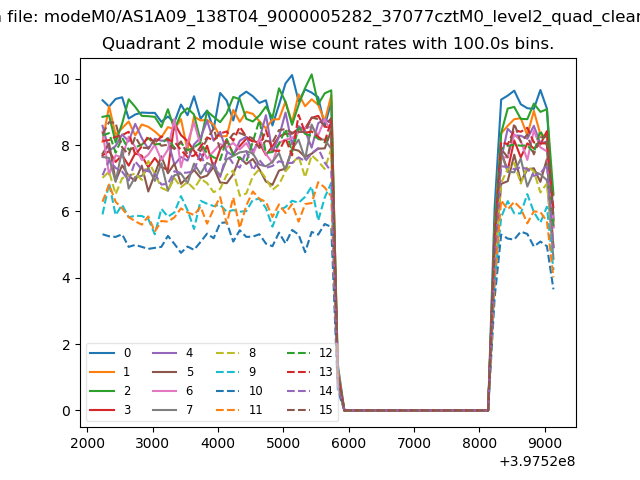
| Module-wise count rates for Quadrant B Data is divided into 100 sec bins |
 |
 |
| Module-wise count rates for Quadrant C Data is divided into 100 sec bins |
 |
 |
| Module-wise count rates for Quadrant D Data is divided into 100 sec bins |
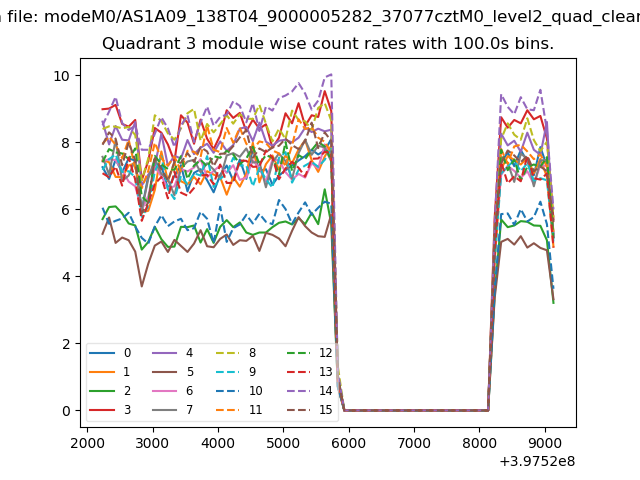 |
 |
| Parameter | Plot |
|---|---|
| CZT HV Monitor | 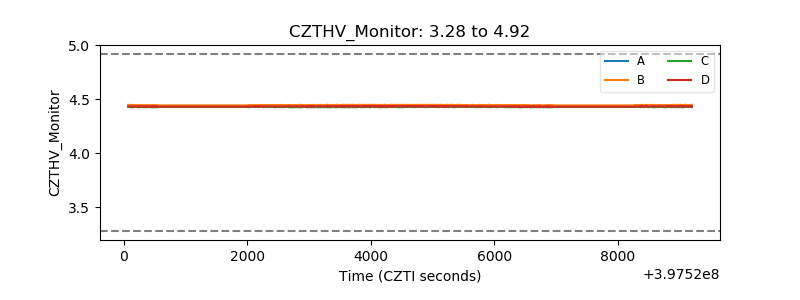 |
| D_VDD | 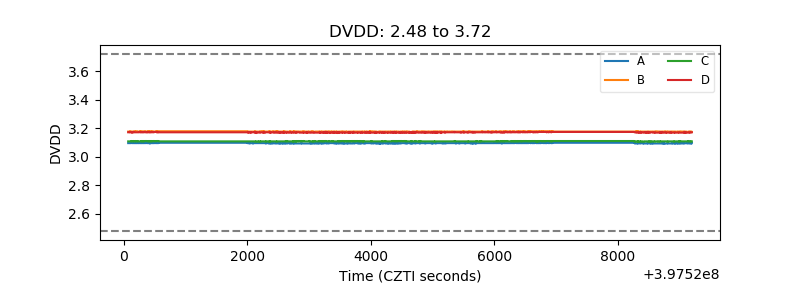 |
| Temperature 1 | 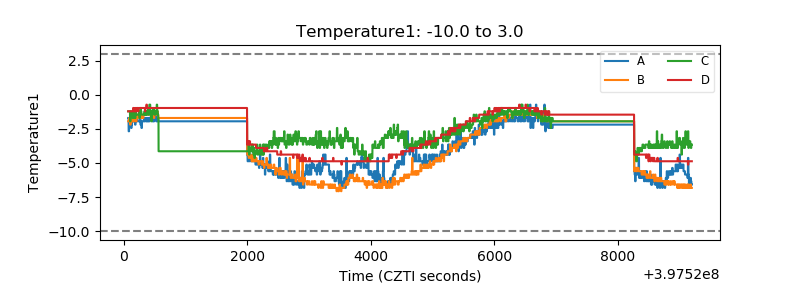 |
| Veto HV Monitor | 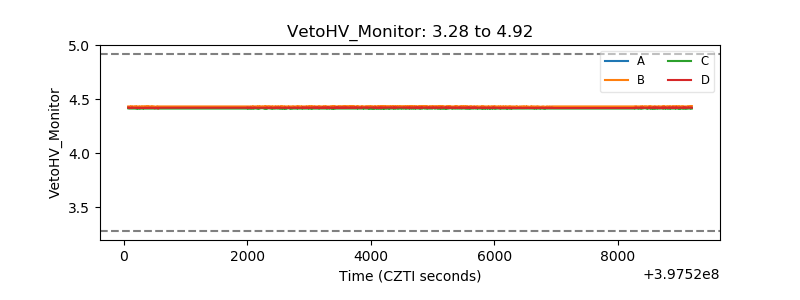 |
| Veto LLD | 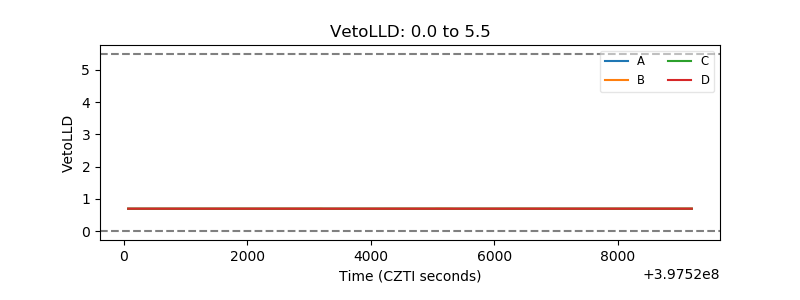 |
| Alpha Counter | 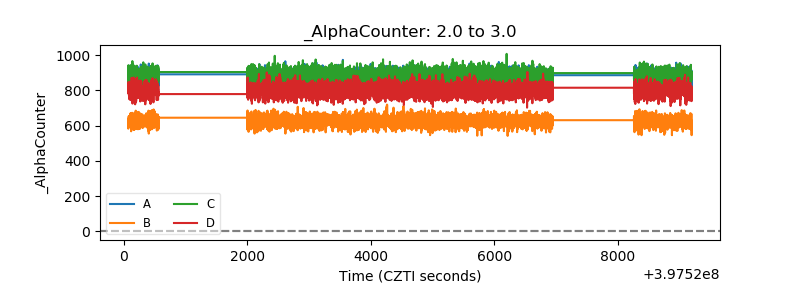 |
| _CPM_Rate | 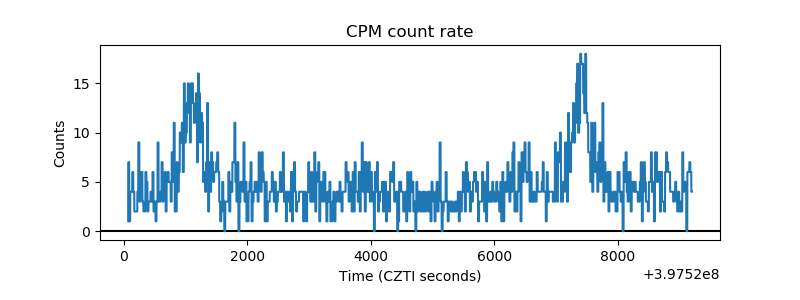 |
| CZT Counter | 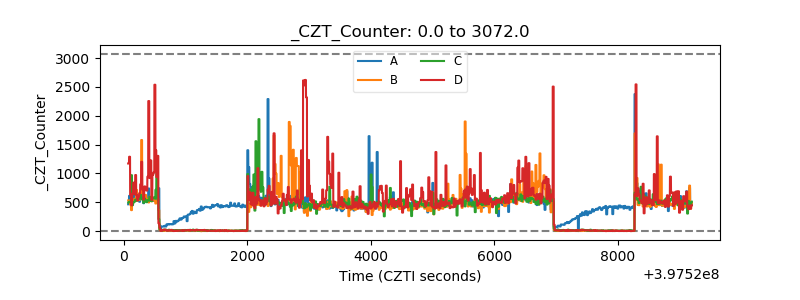 |
| +2.5 Volts monitor | 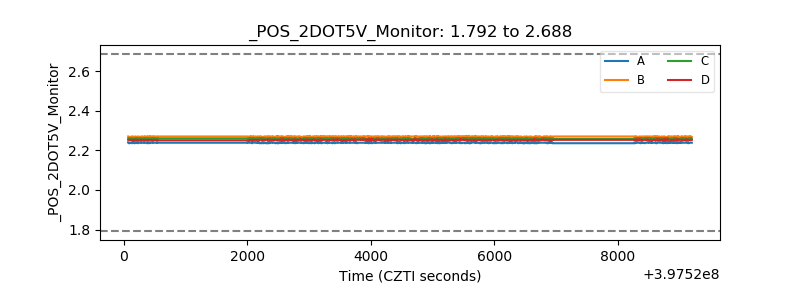 |
| +5 Volts monitor | 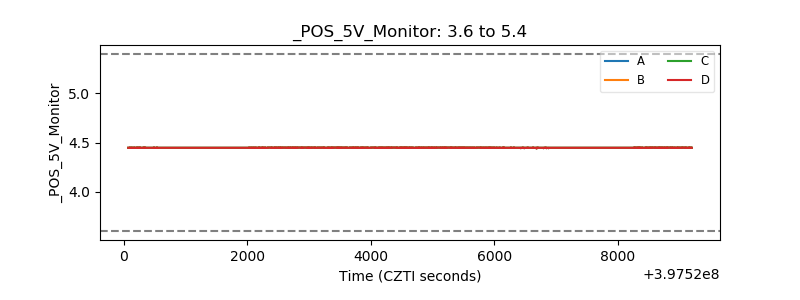 |
| _ROLL_ROT | 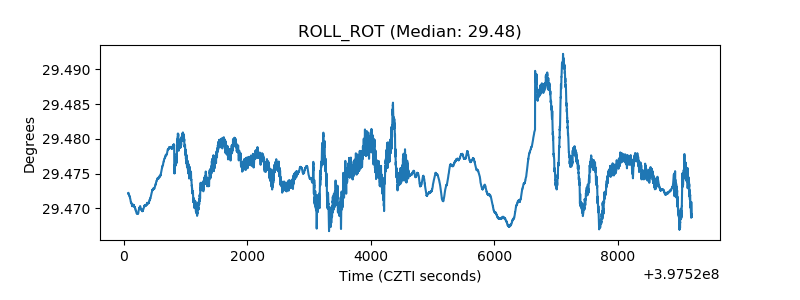 |
| _Roll_DEC | 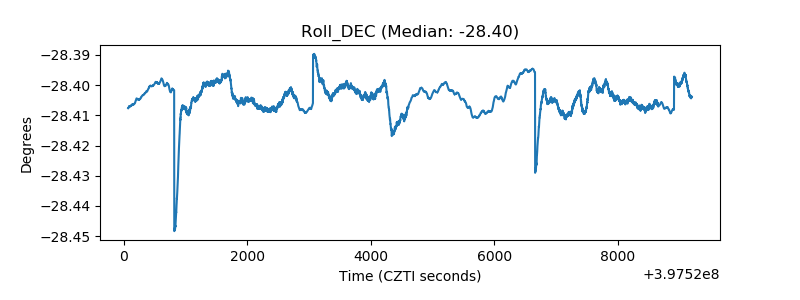 |
| _Roll_RA | 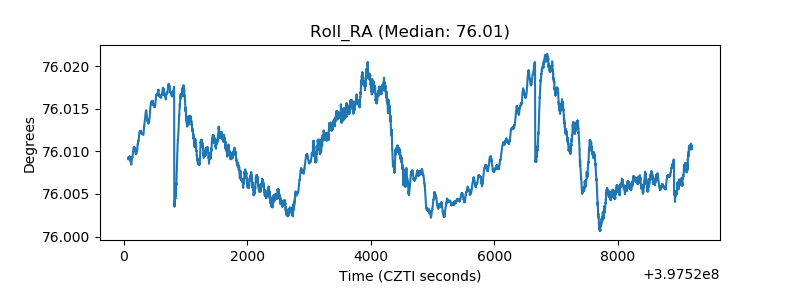 |
| Veto Counter | 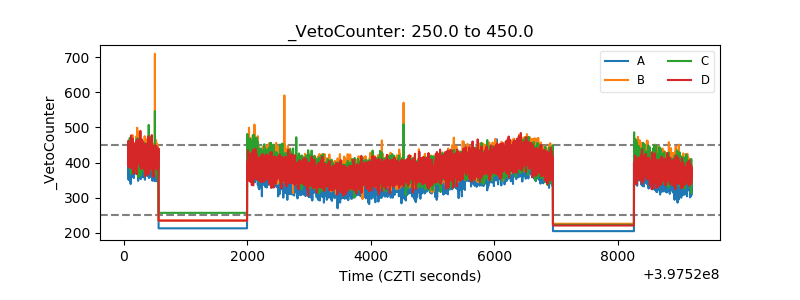 |