| Param | Original file | Final file |
|---|---|---|
| Filename | modeM0/AS1A09_138T04_9000005282_37080cztM0_level2.evt | modeM0/AS1A09_138T04_9000005282_37080cztM0_level2_quad_clean.evt |
| Size (bytes) | 1,201,838,400 | 195,068,160 |
| Size | 1.1 GB | 186.0 MB |
| Events in quadrant A | 8,262,679 | 1,219,237 |
| Events in quadrant B | 9,227,979 | 1,225,604 |
| Events in quadrant C | 8,106,172 | 1,212,860 |
| Events in quadrant D | 9,732,238 | 1,158,956 |
| Mode SS | |||
|---|---|---|---|
| Quadrant | BADHDUFLAG | Total packets | Discarded packets |
| A | 0 | 326 | 0 |
| B | 0 | 326 | 0 |
| C | 0 | 326 | 0 |
| D | 0 | 326 | 0 |
| Mode M0 | |||
|---|---|---|---|
| Quadrant | BADHDUFLAG | Total packets | Discarded packets |
| A | 0 | 34332 | 5 |
| B | 0 | 37838 | 4 |
| C | 0 | 33472 | 4 |
| D | 0 | 39969 | 4 |
| Mode M9 | |||
|---|---|---|---|
| Quadrant | BADHDUFLAG | Total packets | Discarded packets |
| A | 0 | 54 | 0 |
| B | 0 | 54 | 0 |
| C | 0 | 54 | 0 |
| D | 0 | 54 | 0 |
| Quadrant | Total seconds | Saturated seconds | Saturation percentage |
|---|---|---|---|
| A | 15815 | 103 | 0.651280% |
| B | 15815 | 568 | 3.591527% |
| C | 15815 | 61 | 0.385710% |
| D | 15815 | 388 | 2.453367% |
Noise dominated data is calculated using 1-second bins in cleaned event files. If a bin has >2000 counts, and if more than 50% of those come from <1% of pixels, then it is considered to be noise-dominated and hence unusable.
| Quadrant | # 1 sec bins | Bins with >0 counts | Bins with >2000 counts | High rate bins dominated by noise | Noise dominated (total time) | Noise dominated (detector-on time) | Marked lightcurve |
|---|---|---|---|---|---|---|---|
| A | 21246 | 15819 | 63 | 63 | 0.30% | 0.40% | 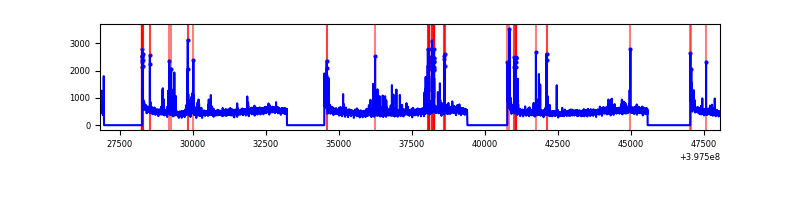 |
| B | 21246 | 15819 | 370 | 370 | 1.74% | 2.34% | 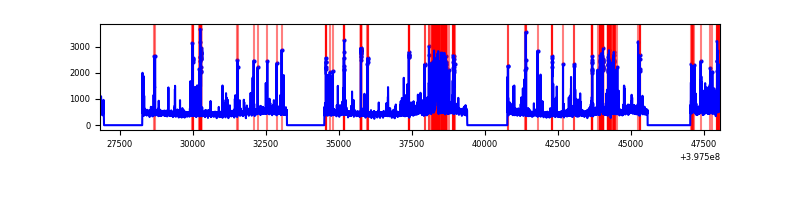 |
| C | 21246 | 15819 | 43 | 43 | 0.20% | 0.27% | 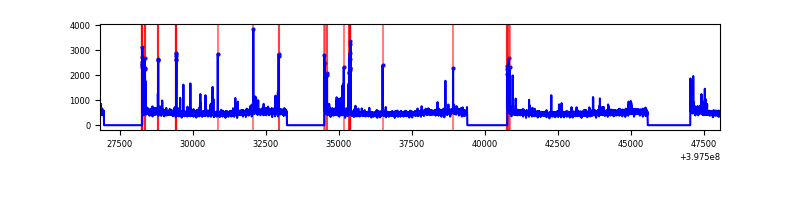 |
| D | 21246 | 15818 | 317 | 317 | 1.49% | 2.00% | 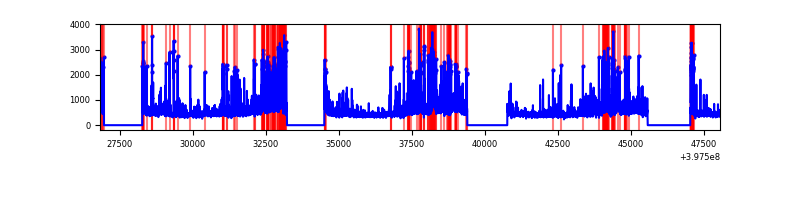 |
Top three noisy pixels from each quadrant. If the there are fewer than three noisy pixels in the level2.evt file, extra rows are filled as -1
| Pixel properties | Quadrant properties | ||||||
|---|---|---|---|---|---|---|---|
| Quadrant | DetID | PixID | Counts | Sigma | Mean | Median | Sigma |
| A | 10 | 83 | 661045 | 1785.32 | 1828 | 1789 | 369.3 |
| A | 9 | 143 | 332441 | 895.43 | 1828 | 1789 | 369.3 |
| A | 7 | 3 | 151142 | 404.46 | 1828 | 1789 | 369.3 |
| B | 5 | 184 | 1260681 | 3696.67 | 1791 | 1741 | 340.6 |
| B | 5 | 172 | 457504 | 1338.27 | 1791 | 1741 | 340.6 |
| B | 5 | 255 | 137977 | 400.03 | 1791 | 1741 | 340.6 |
| C | 15 | 214 | 661564 | 1598.89 | 1779 | 1796 | 412.6 |
| C | 0 | 10 | 183025 | 439.19 | 1779 | 1796 | 412.6 |
| C | 14 | 254 | 137958 | 329.98 | 1779 | 1796 | 412.6 |
| D | 2 | 153 | 561008 | 1307.06 | 1770 | 1726 | 427.9 |
| D | 1 | 52 | 391645 | 911.25 | 1770 | 1726 | 427.9 |
| D | 2 | 250 | 372385 | 866.24 | 1770 | 1726 | 427.9 |
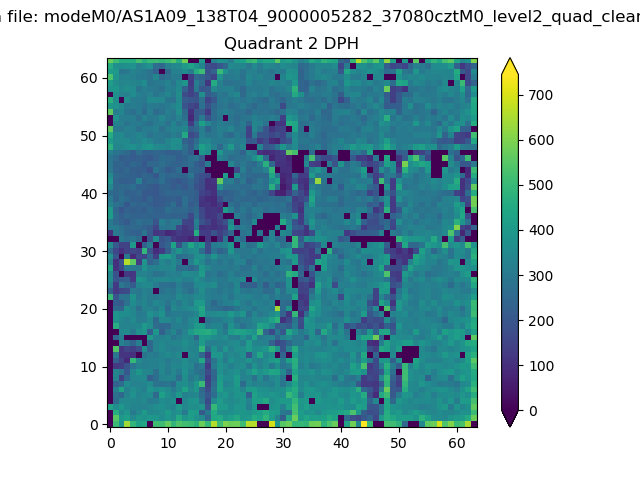
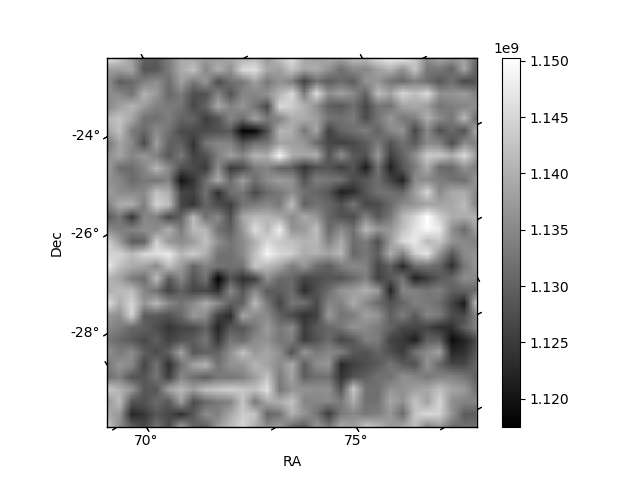
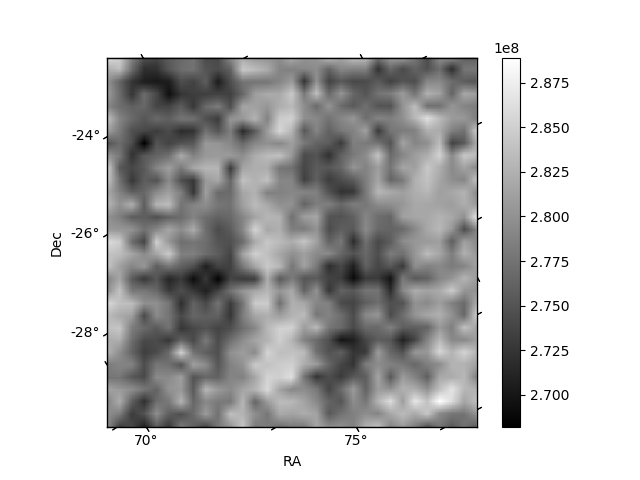
Histogram calculated using DETX and DETY for each event in the final _common_clean file
| Quadrant A | 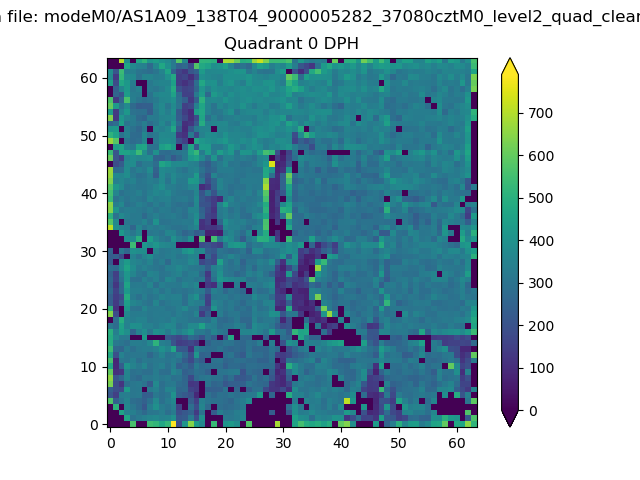 |
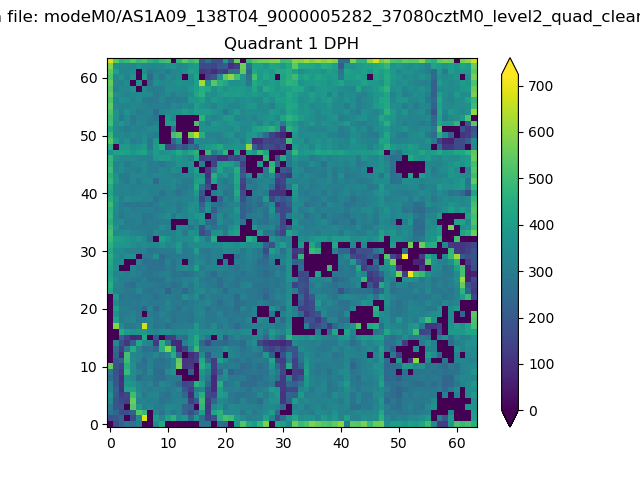 |
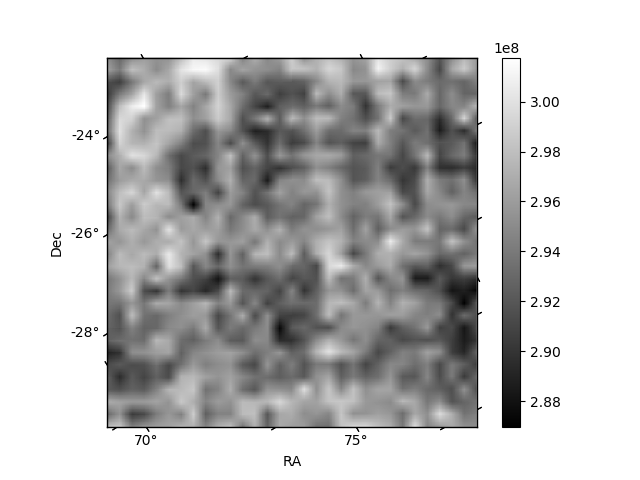
Quadrant B |
|---|---|---|---|
| Quadrant D | 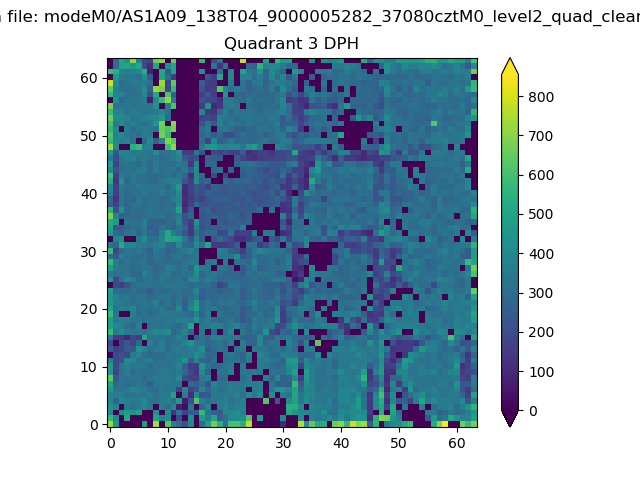 |
 |
Quadrant C |
| Plot type | Count rate plots | Images |
|---|---|---|
| Comparison with Poisson distribution Blue bars denote a histogram of data divided into 1 sec bins. Red curve is a Poisson curve with rate = median count rate of data. |
 |
 |
| Quadrant-wise count rates Data is divided into 100 sec bins |
 |
|
| Module-wise count rates for Quadrant A Data is divided into 100 sec bins |
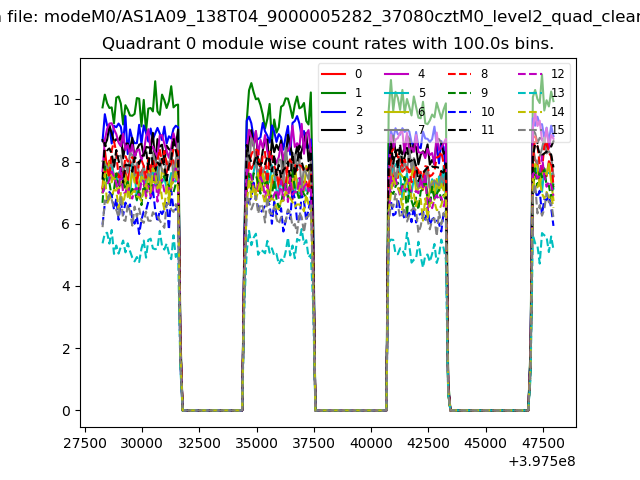 |
 |
| Module-wise count rates for Quadrant B Data is divided into 100 sec bins |
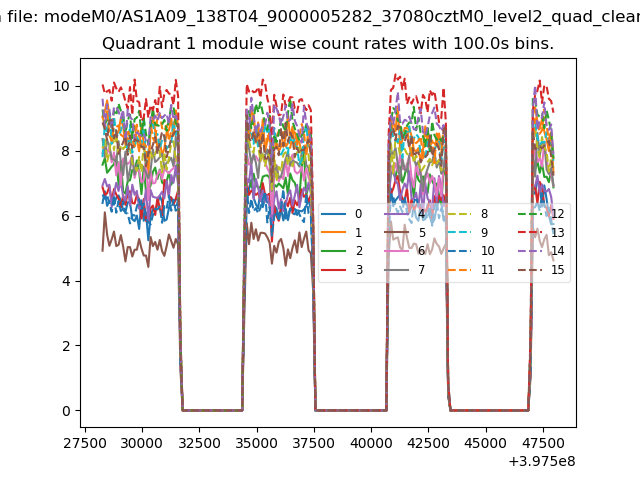 |
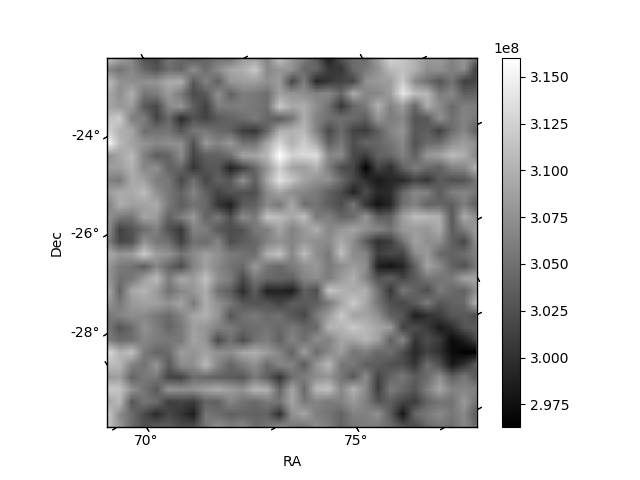 |
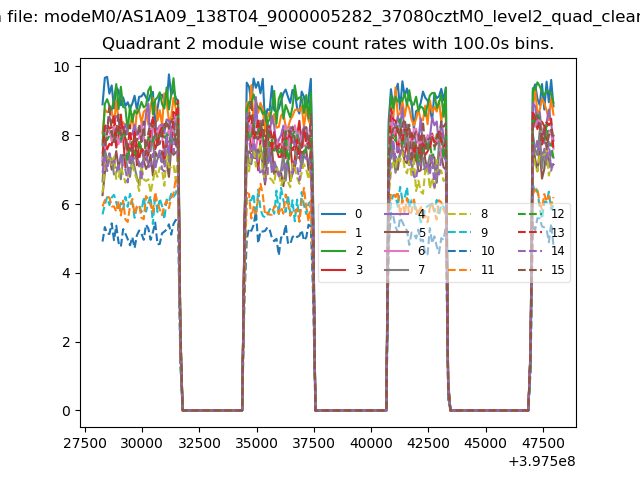
| Module-wise count rates for Quadrant C Data is divided into 100 sec bins |
 |
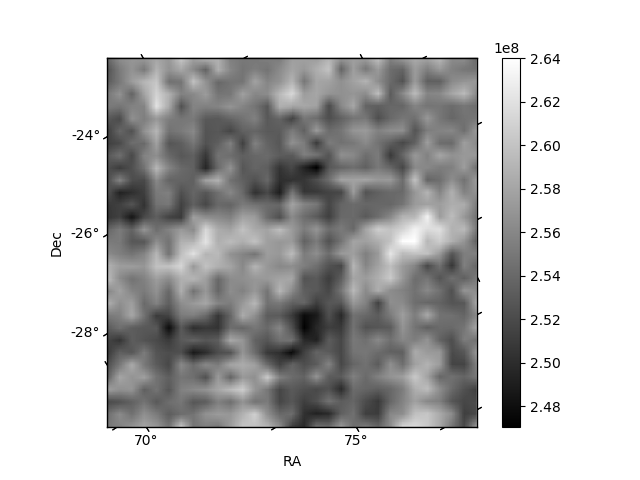 |
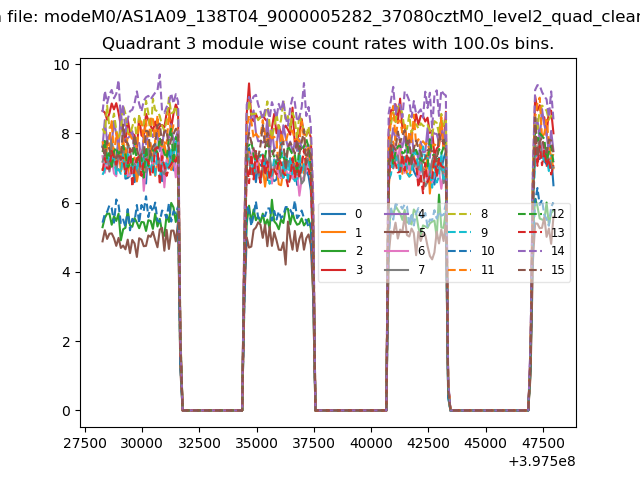
| Module-wise count rates for Quadrant D Data is divided into 100 sec bins |
 |
 |
| Parameter | Plot |
|---|---|
| CZT HV Monitor | 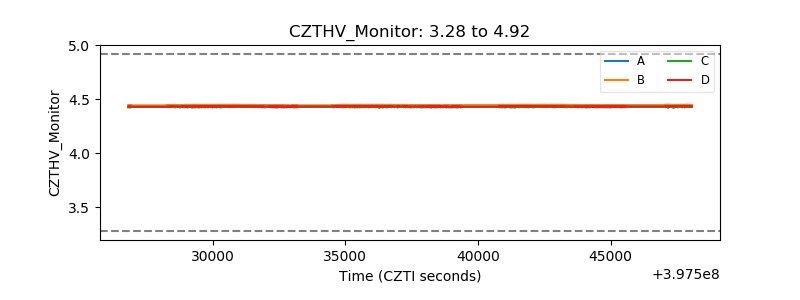 |
| D_VDD | 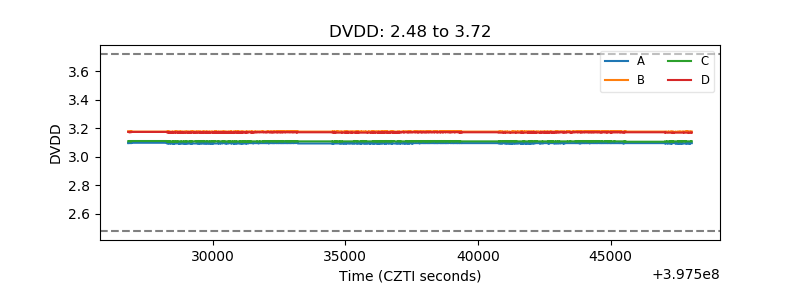 |
| Temperature 1 | 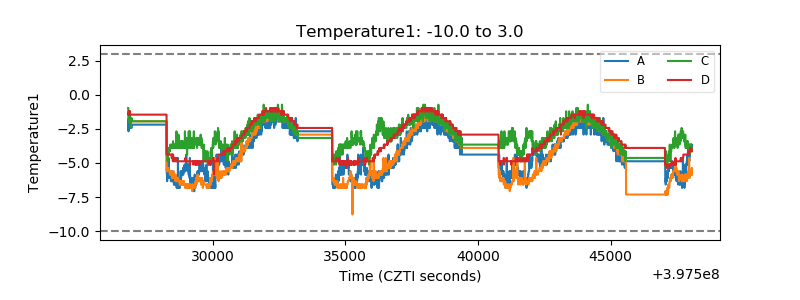 |
| Veto HV Monitor |  |
| Veto LLD | 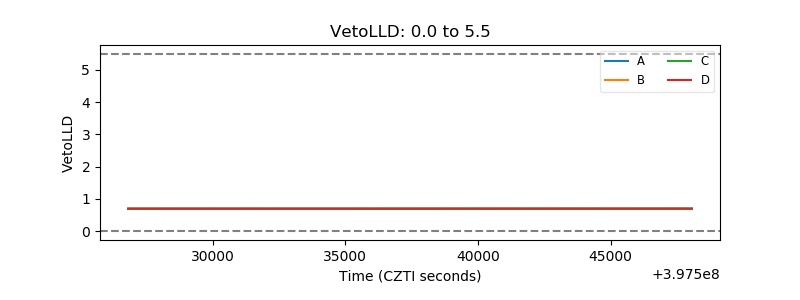 |
| Alpha Counter | 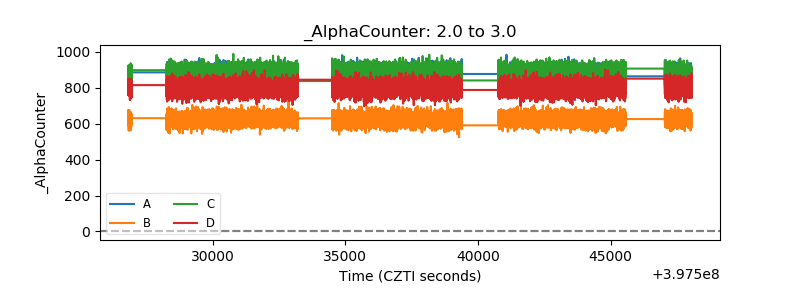 |
| _CPM_Rate |  |
| CZT Counter | 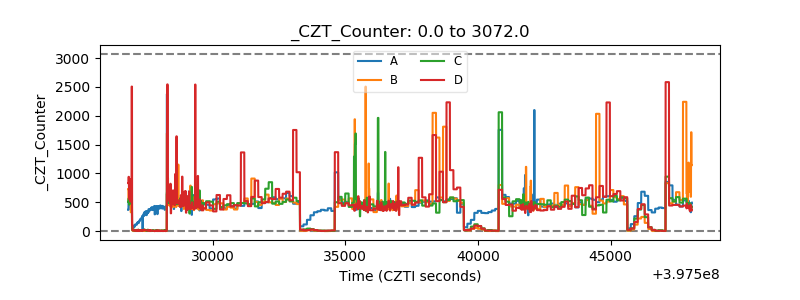 |
| +2.5 Volts monitor |  |
| +5 Volts monitor |  |
| _ROLL_ROT | 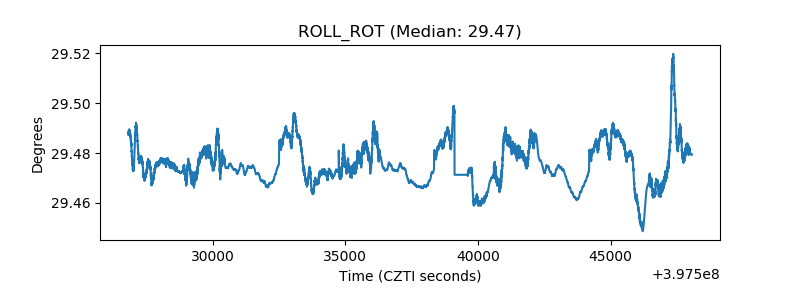 |
| _Roll_DEC | 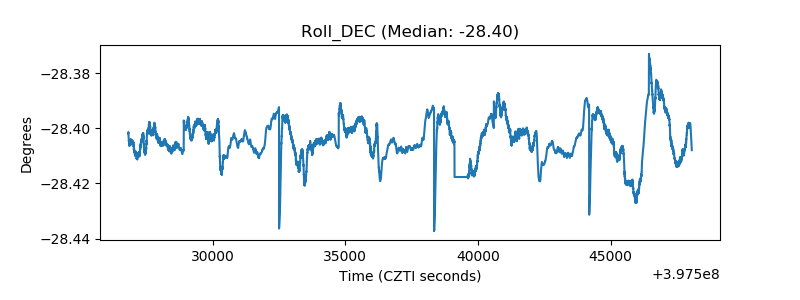 |
| _Roll_RA | 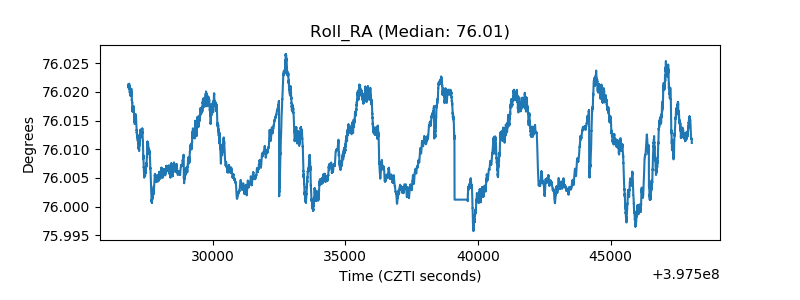 |
| Veto Counter | 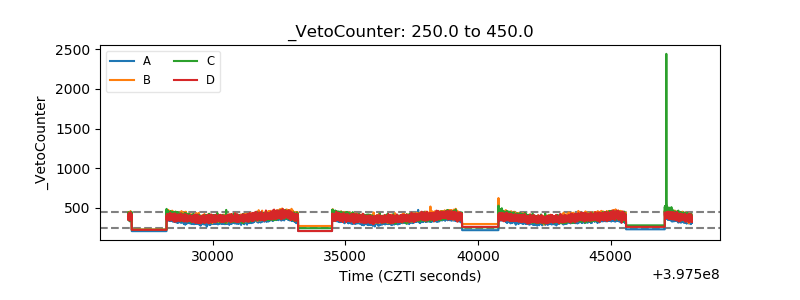 |