| Param | Original file | Final file |
|---|---|---|
| Filename | modeM0/AS1A09_138T04_9000005282_37081cztM0_level2.evt | modeM0/AS1A09_138T04_9000005282_37081cztM0_level2_quad_clean.evt |
| Size (bytes) | 464,886,720 | 66,936,960 |
| Size | 443.4 MB | 63.8 MB |
| Events in quadrant A | 2,867,814 | 419,761 |
| Events in quadrant B | 4,623,551 | 403,754 |
| Events in quadrant C | 2,786,528 | 416,856 |
| Events in quadrant D | 3,421,699 | 395,166 |
| Mode SS | |||
|---|---|---|---|
| Quadrant | BADHDUFLAG | Total packets | Discarded packets |
| A | 0 | 114 | 0 |
| B | 0 | 114 | 0 |
| C | 0 | 114 | 0 |
| D | 0 | 114 | 0 |
| Mode M0 | |||
|---|---|---|---|
| Quadrant | BADHDUFLAG | Total packets | Discarded packets |
| A | 0 | 11924 | 3 |
| B | 0 | 17431 | 2 |
| C | 0 | 11589 | 2 |
| D | 0 | 13929 | 2 |
| Mode M9 | |||
|---|---|---|---|
| Quadrant | BADHDUFLAG | Total packets | Discarded packets |
| A | 0 | 16 | 0 |
| B | 0 | 16 | 0 |
| C | 0 | 16 | 0 |
| D | 0 | 17 | 0 |
| Quadrant | Total seconds | Saturated seconds | Saturation percentage |
|---|---|---|---|
| A | 5591 | 16 | 0.286174% |
| B | 5591 | 464 | 8.299052% |
| C | 5591 | 13 | 0.232517% |
| D | 5591 | 138 | 2.468253% |
Noise dominated data is calculated using 1-second bins in cleaned event files. If a bin has >2000 counts, and if more than 50% of those come from <1% of pixels, then it is considered to be noise-dominated and hence unusable.
| Quadrant | # 1 sec bins | Bins with >0 counts | Bins with >2000 counts | High rate bins dominated by noise | Noise dominated (total time) | Noise dominated (detector-on time) | Marked lightcurve |
|---|---|---|---|---|---|---|---|
| A | 7203 | 5592 | 8 | 8 | 0.11% | 0.14% | 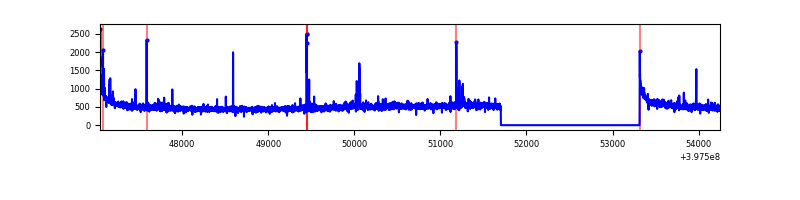 |
| B | 7203 | 5592 | 351 | 351 | 4.87% | 6.28% | 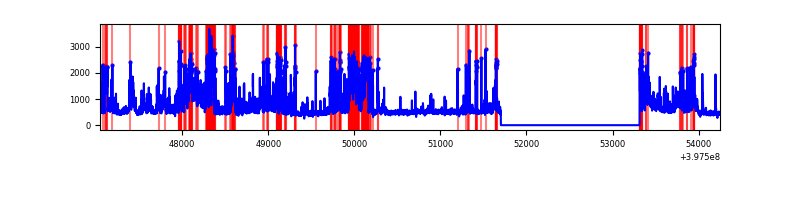 |
| C | 7203 | 5592 | 5 | 5 | 0.07% | 0.09% | 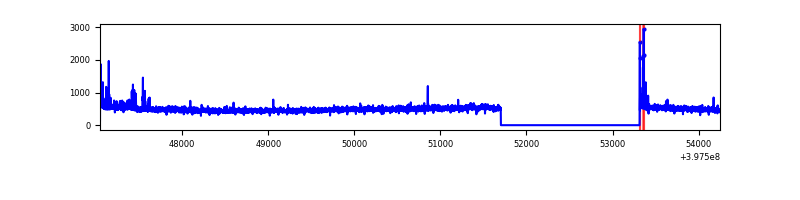 |
| D | 7203 | 5592 | 129 | 129 | 1.79% | 2.31% | 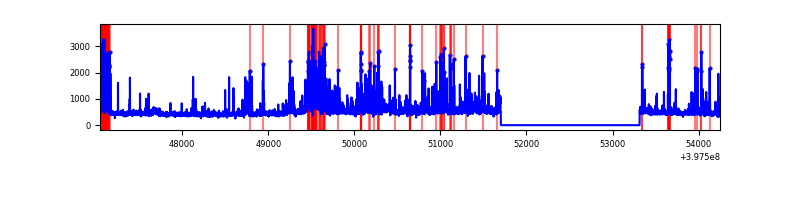 |
Top three noisy pixels from each quadrant. If the there are fewer than three noisy pixels in the level2.evt file, extra rows are filled as -1
| Pixel properties | Quadrant properties | ||||||
|---|---|---|---|---|---|---|---|
| Quadrant | DetID | PixID | Counts | Sigma | Mean | Median | Sigma |
| A | 10 | 83 | 273595 | 2088.21 | 648 | 636 | 130.7 |
| A | 7 | 3 | 38600 | 290.43 | 648 | 636 | 130.7 |
| A | 9 | 143 | 31590 | 236.81 | 648 | 636 | 130.7 |
| B | 5 | 184 | 1580514 | 13155.32 | 621 | 605 | 120.1 |
| B | 5 | 172 | 228158 | 1894.75 | 621 | 605 | 120.1 |
| B | 4 | 171 | 121290 | 1004.9 | 621 | 605 | 120.1 |
| C | 15 | 214 | 237133 | 1580.98 | 631 | 635 | 149.6 |
| C | 0 | 10 | 78101 | 517.86 | 631 | 635 | 149.6 |
| C | 12 | 249 | 4461 | 25.58 | 631 | 635 | 149.6 |
| D | 1 | 47 | 220145 | 1424.88 | 629 | 612 | 154.1 |
| D | 1 | 52 | 188494 | 1219.45 | 629 | 612 | 154.1 |
| D | 2 | 249 | 147525 | 953.54 | 629 | 612 | 154.1 |
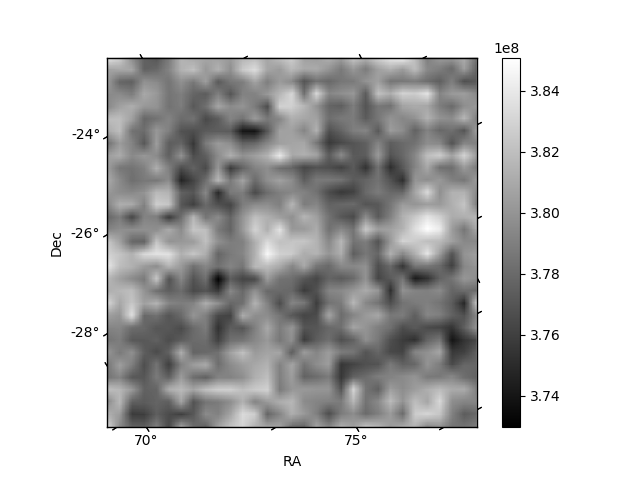
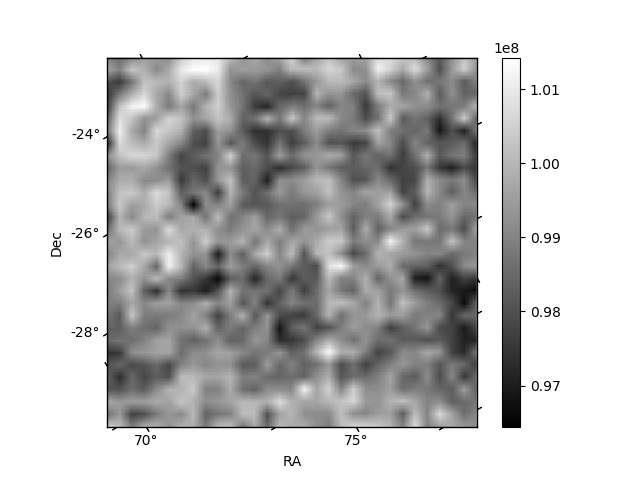
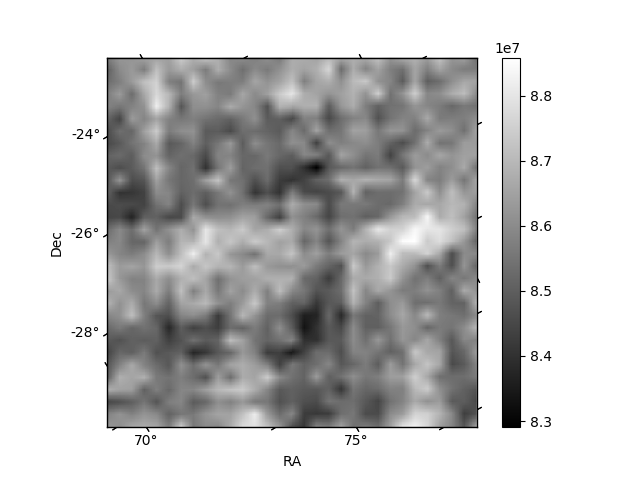
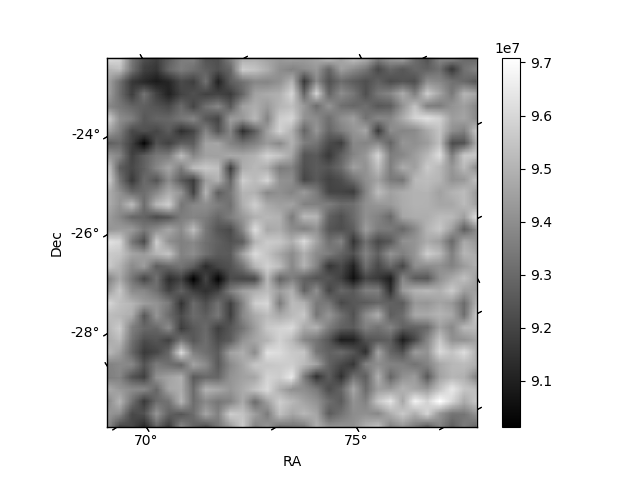
Histogram calculated using DETX and DETY for each event in the final _common_clean file
| Quadrant A | 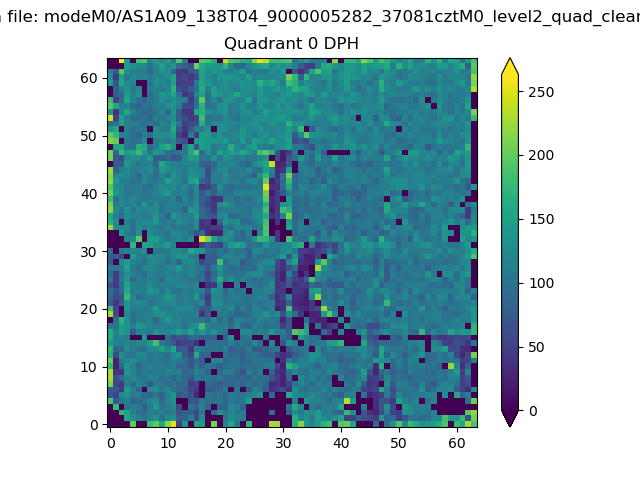 |
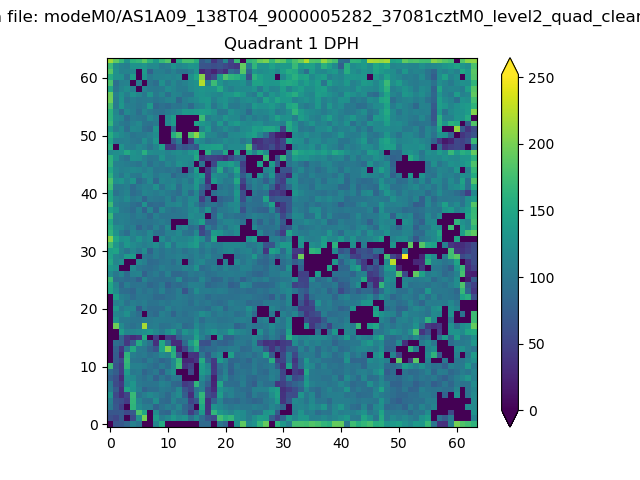 |
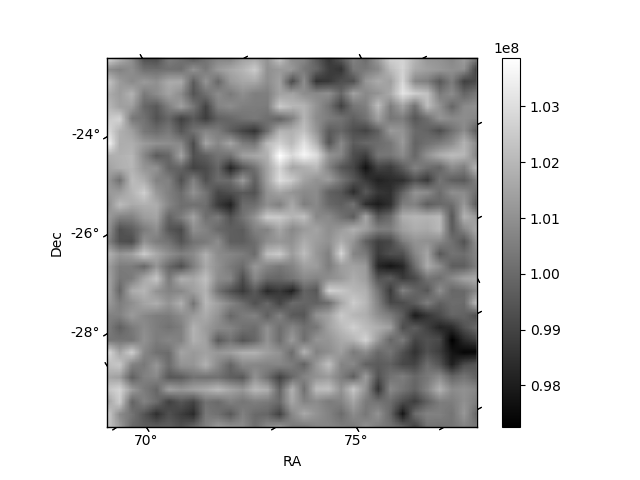
Quadrant B |
|---|---|---|---|
| Quadrant D | 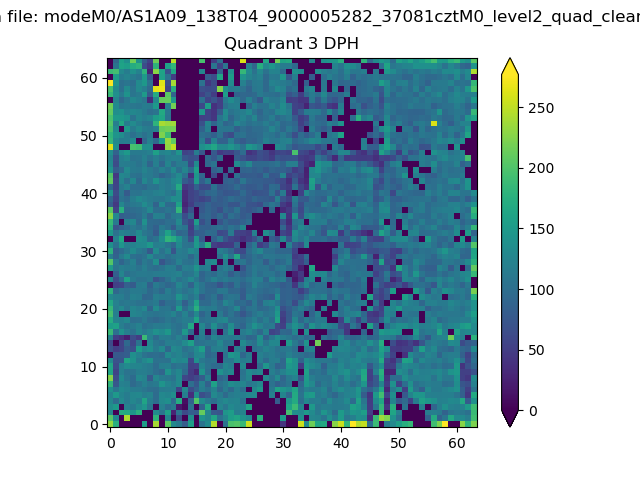 |
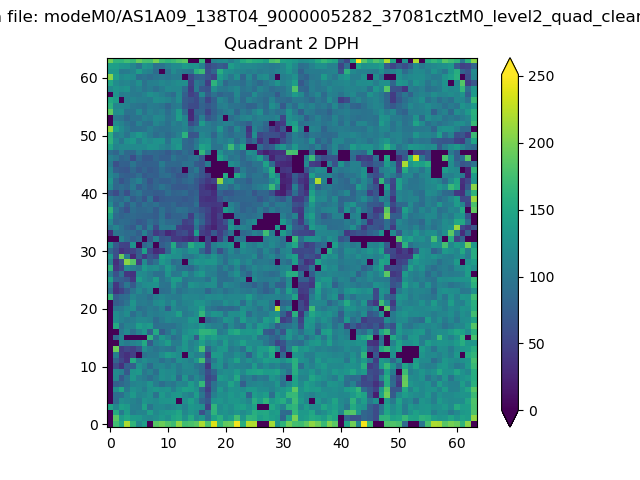 |
Quadrant C |
| Plot type | Count rate plots | Images |
|---|---|---|
| Comparison with Poisson distribution Blue bars denote a histogram of data divided into 1 sec bins. Red curve is a Poisson curve with rate = median count rate of data. |
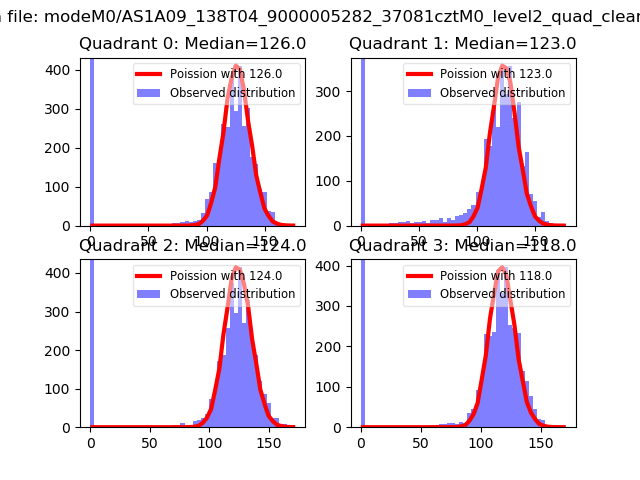 |
 |
| Quadrant-wise count rates Data is divided into 100 sec bins |
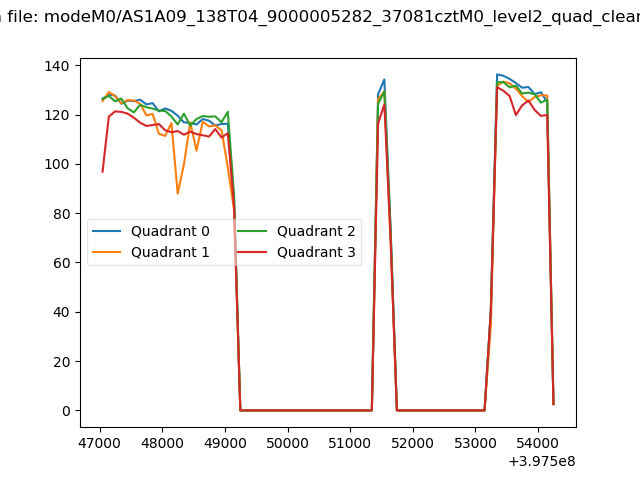 |
|
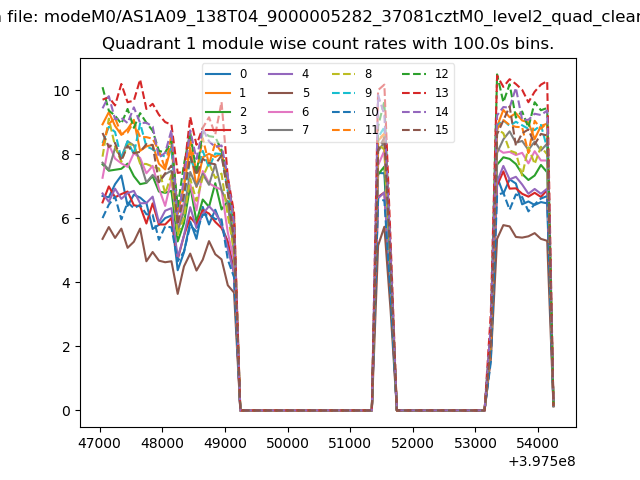
| Module-wise count rates for Quadrant A Data is divided into 100 sec bins |
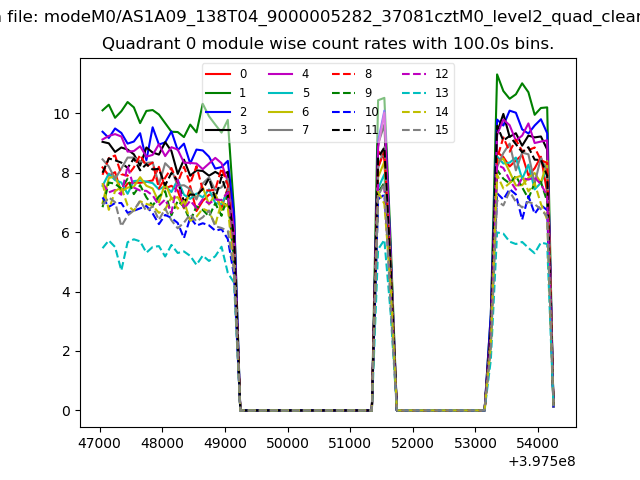 |
 |
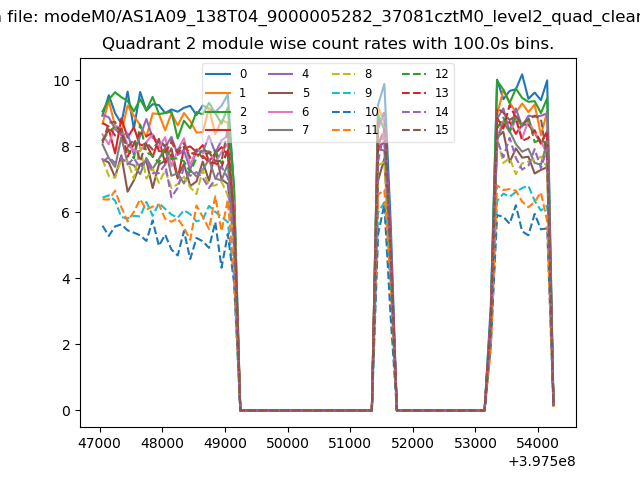
| Module-wise count rates for Quadrant B Data is divided into 100 sec bins |
 |
 |
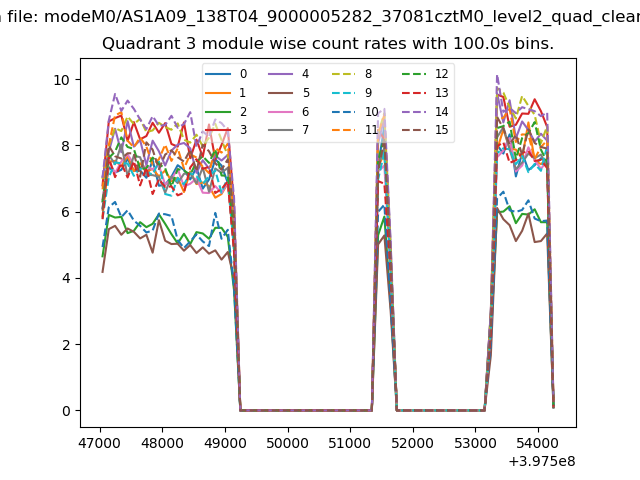
| Module-wise count rates for Quadrant C Data is divided into 100 sec bins |
 |
 |
| Module-wise count rates for Quadrant D Data is divided into 100 sec bins |
 |
 |
| Parameter | Plot |
|---|---|
| CZT HV Monitor | 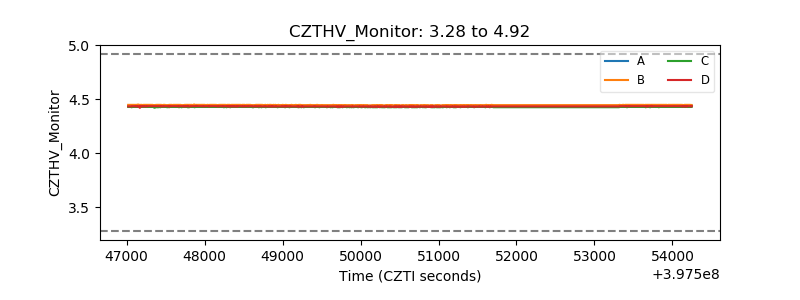 |
| D_VDD | 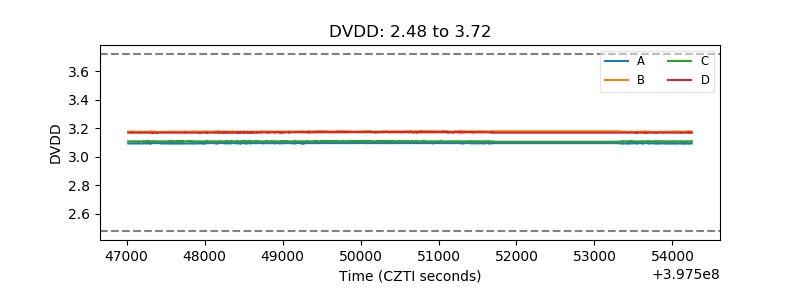 |
| Temperature 1 | 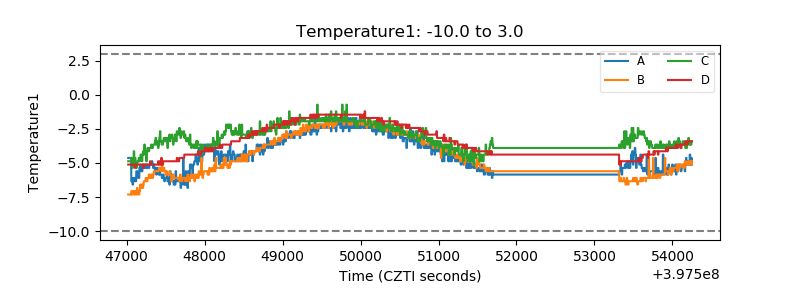 |
| Veto HV Monitor | 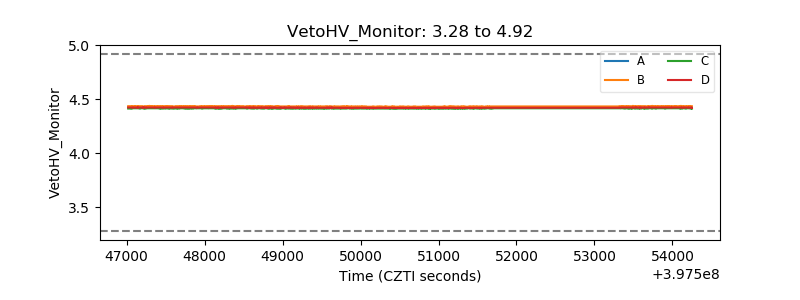 |
| Veto LLD | 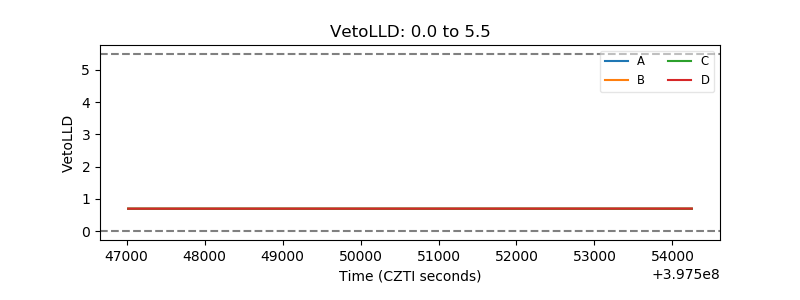 |
| Alpha Counter | 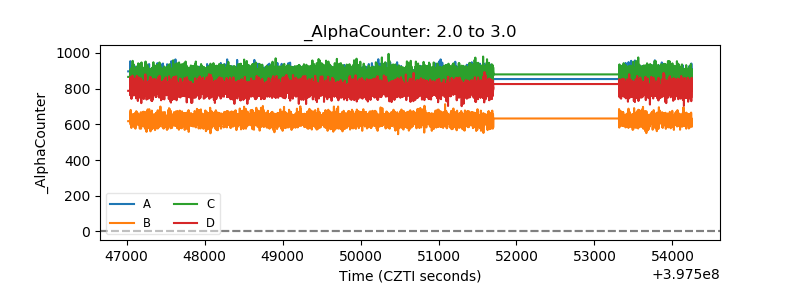 |
| _CPM_Rate | 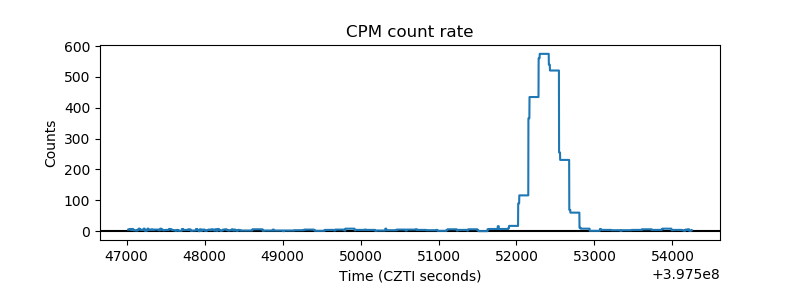 |
| CZT Counter | 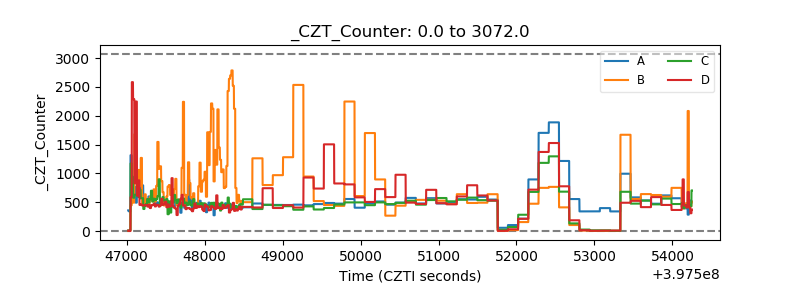 |
| +2.5 Volts monitor | 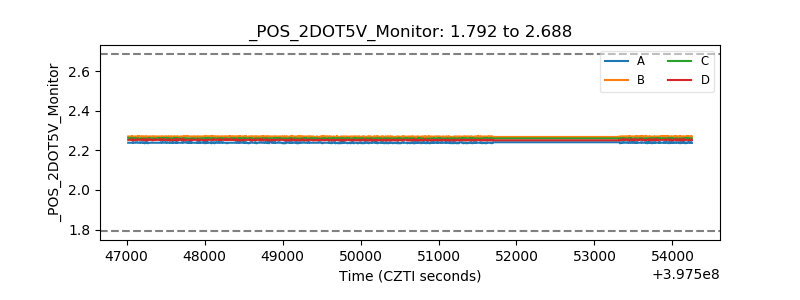 |
| +5 Volts monitor | 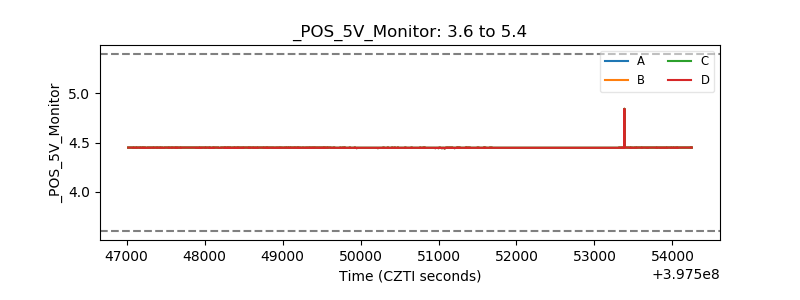 |
| _ROLL_ROT | 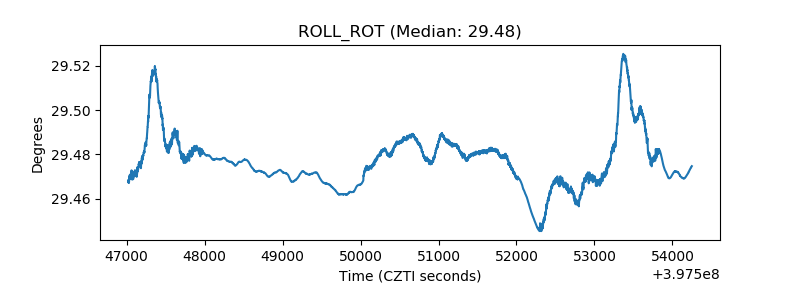 |
| _Roll_DEC | 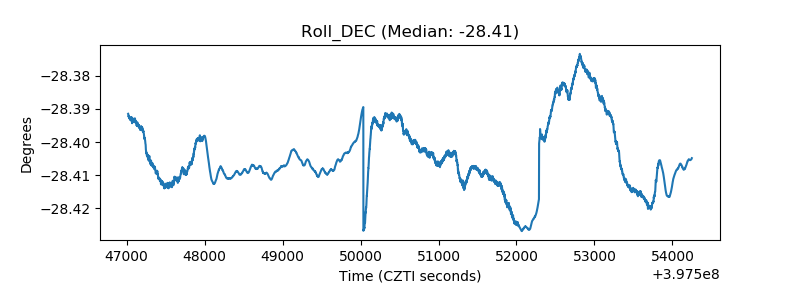 |
| _Roll_RA | 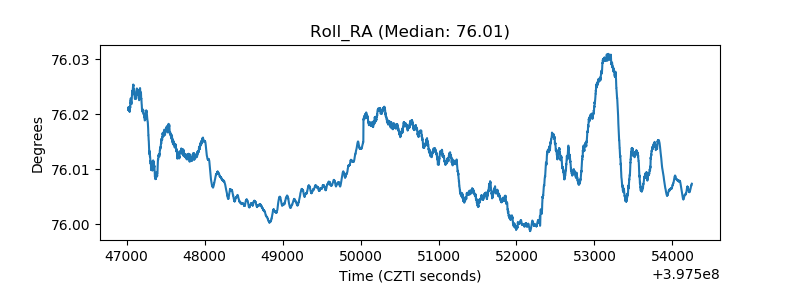 |
| Veto Counter | 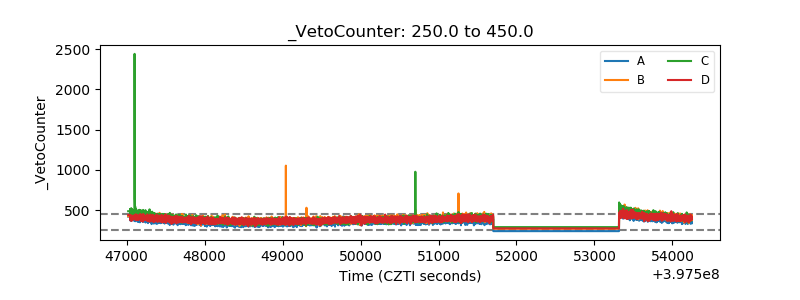 |