| Param | Original file | Final file |
|---|---|---|
| Filename | modeM0/AS1A09_138T04_9000005282_37083cztM0_level2.evt | modeM0/AS1A09_138T04_9000005282_37083cztM0_level2_quad_clean.evt |
| Size (bytes) | 443,712,960 | 71,769,600 |
| Size | 423.2 MB | 68.4 MB |
| Events in quadrant A | 2,987,206 | 454,509 |
| Events in quadrant B | 3,475,810 | 451,840 |
| Events in quadrant C | 2,849,551 | 448,340 |
| Events in quadrant D | 3,740,095 | 421,875 |
| Mode SS | |||
|---|---|---|---|
| Quadrant | BADHDUFLAG | Total packets | Discarded packets |
| A | 0 | 116 | 0 |
| B | 0 | 116 | 0 |
| C | 0 | 116 | 0 |
| D | 0 | 116 | 0 |
| Mode M0 | |||
|---|---|---|---|
| Quadrant | BADHDUFLAG | Total packets | Discarded packets |
| A | 0 | 12326 | 3 |
| B | 0 | 13863 | 2 |
| C | 0 | 11756 | 2 |
| D | 0 | 14777 | 2 |
| Mode M9 | |||
|---|---|---|---|
| Quadrant | BADHDUFLAG | Total packets | Discarded packets |
| A | 0 | 18 | 0 |
| B | 0 | 18 | 0 |
| C | 0 | 18 | 0 |
| D | 0 | 19 | 0 |
| Quadrant | Total seconds | Saturated seconds | Saturation percentage |
|---|---|---|---|
| A | 5668 | 14 | 0.247001% |
| B | 5668 | 149 | 2.628793% |
| C | 5668 | 14 | 0.247001% |
| D | 5668 | 206 | 3.634439% |
Noise dominated data is calculated using 1-second bins in cleaned event files. If a bin has >2000 counts, and if more than 50% of those come from <1% of pixels, then it is considered to be noise-dominated and hence unusable.
| Quadrant | # 1 sec bins | Bins with >0 counts | Bins with >2000 counts | High rate bins dominated by noise | Noise dominated (total time) | Noise dominated (detector-on time) | Marked lightcurve |
|---|---|---|---|---|---|---|---|
| A | 7401 | 5669 | 7 | 7 | 0.09% | 0.12% | 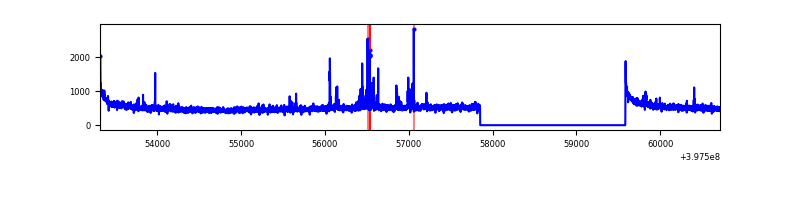 |
| B | 7401 | 5669 | 120 | 120 | 1.62% | 2.12% | 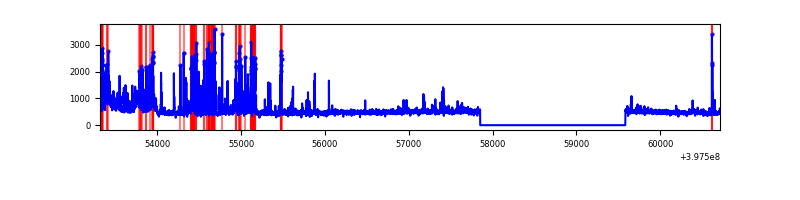 |
| C | 7401 | 5669 | 10 | 10 | 0.14% | 0.18% | 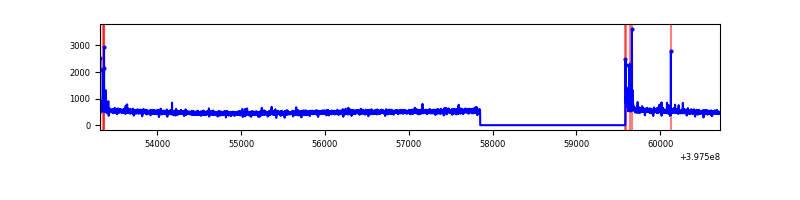 |
| D | 7401 | 5669 | 195 | 195 | 2.63% | 3.44% | 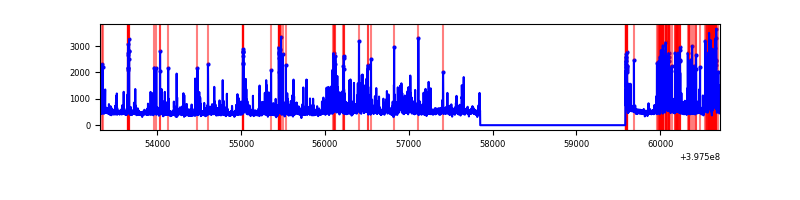 |
Top three noisy pixels from each quadrant. If the there are fewer than three noisy pixels in the level2.evt file, extra rows are filled as -1
| Pixel properties | Quadrant properties | ||||||
|---|---|---|---|---|---|---|---|
| Quadrant | DetID | PixID | Counts | Sigma | Mean | Median | Sigma |
| A | 10 | 83 | 266087 | 1979.02 | 672 | 661 | 134.1 |
| A | 7 | 3 | 97797 | 724.25 | 672 | 661 | 134.1 |
| A | 9 | 143 | 14906 | 106.21 | 672 | 661 | 134.1 |
| B | 5 | 184 | 739129 | 5826.55 | 657 | 639 | 126.7 |
| B | 4 | 232 | 59214 | 462.15 | 657 | 639 | 126.7 |
| B | 5 | 255 | 21701 | 166.18 | 657 | 639 | 126.7 |
| C | 15 | 214 | 242615 | 1599.38 | 647 | 652 | 151.3 |
| C | 0 | 10 | 62154 | 406.53 | 647 | 652 | 151.3 |
| C | 1 | 23 | 10118 | 62.57 | 647 | 652 | 151.3 |
| D | 1 | 47 | 410170 | 2568.52 | 649 | 629 | 159.4 |
| D | 12 | 17 | 173686 | 1085.36 | 649 | 629 | 159.4 |
| D | 1 | 52 | 131802 | 822.67 | 649 | 629 | 159.4 |
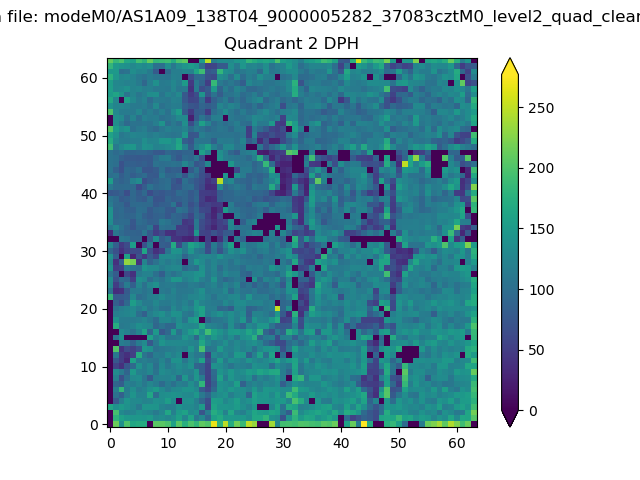
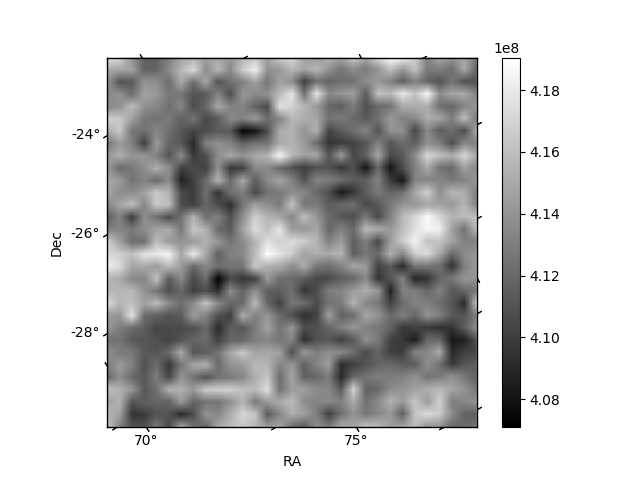
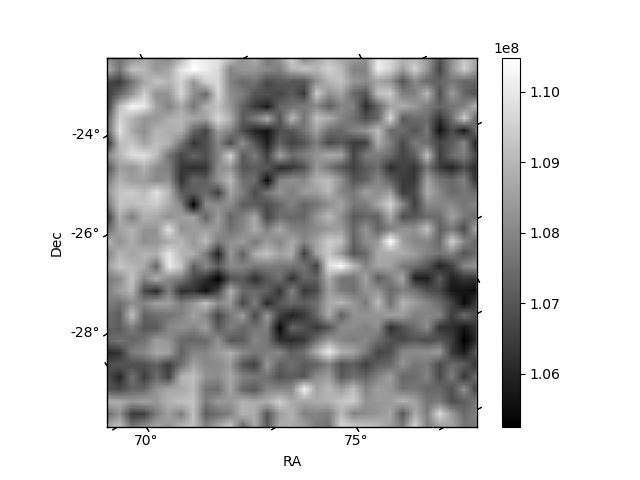
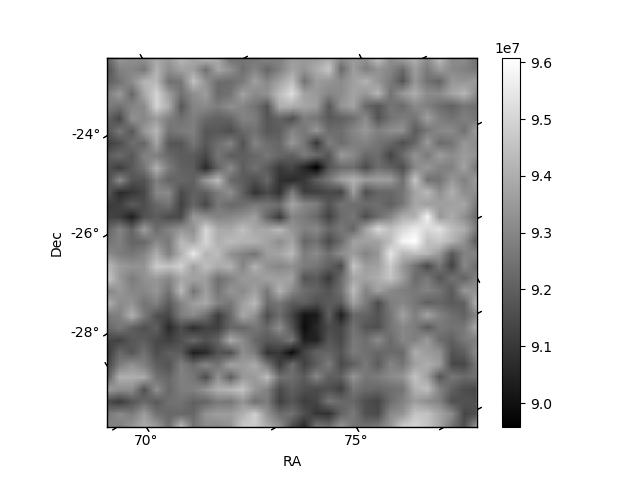
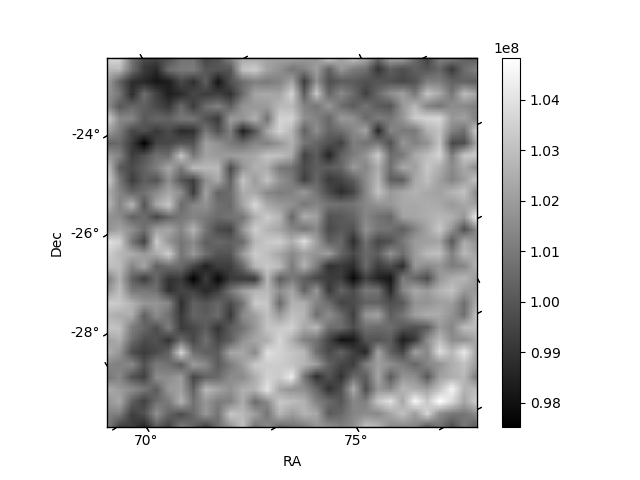
Histogram calculated using DETX and DETY for each event in the final _common_clean file
| Quadrant A | 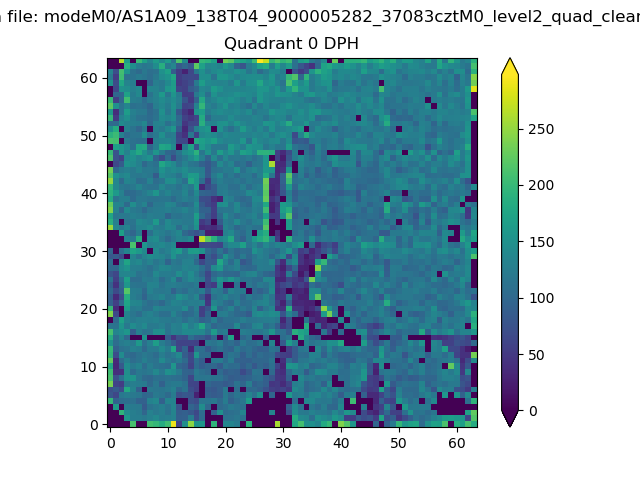 |
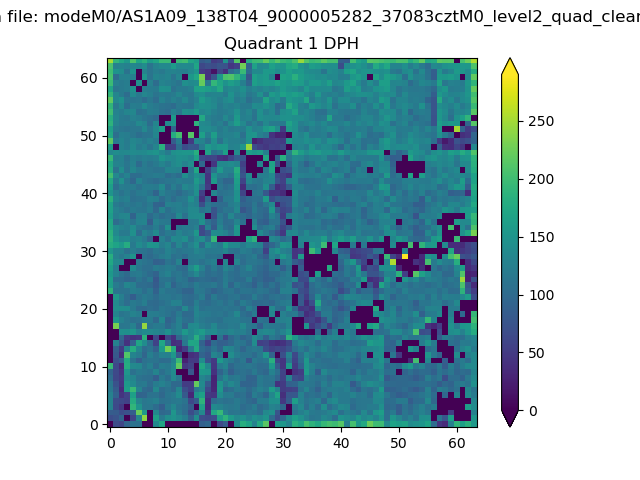 |
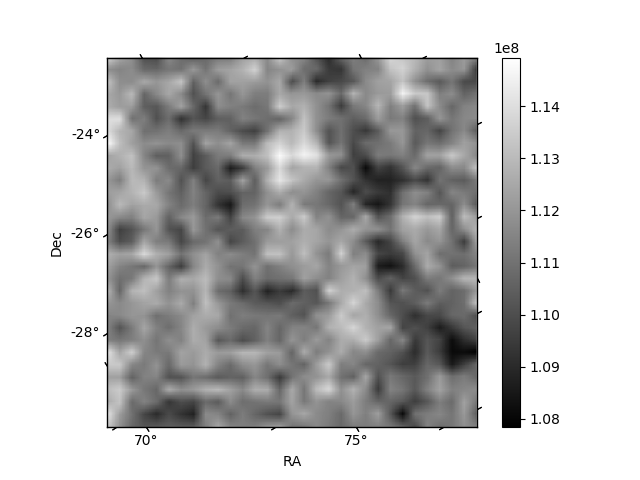
Quadrant B |
|---|---|---|---|
| Quadrant D | 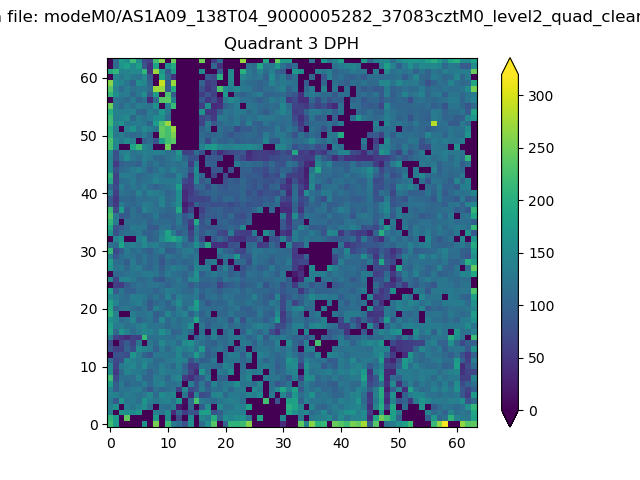 |
 |
Quadrant C |
| Plot type | Count rate plots | Images |
|---|---|---|
| Comparison with Poisson distribution Blue bars denote a histogram of data divided into 1 sec bins. Red curve is a Poisson curve with rate = median count rate of data. |
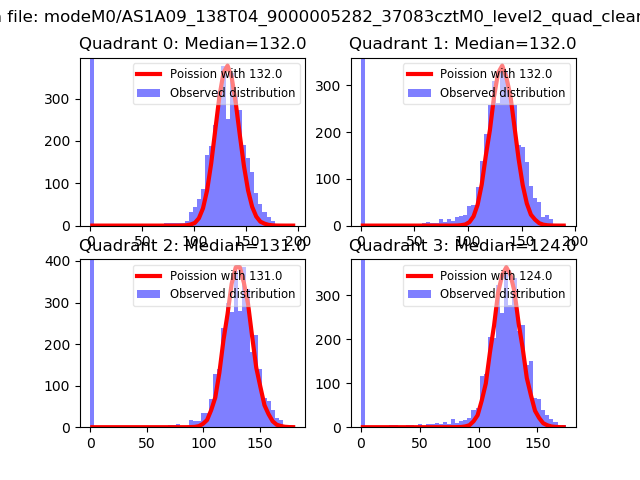 |
 |
| Quadrant-wise count rates Data is divided into 100 sec bins |
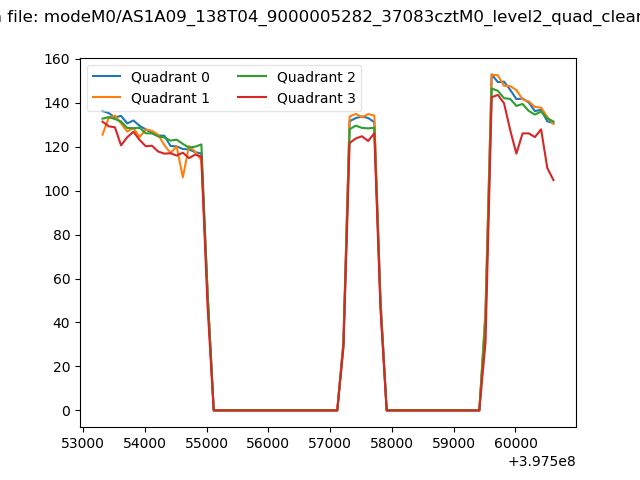 |
|
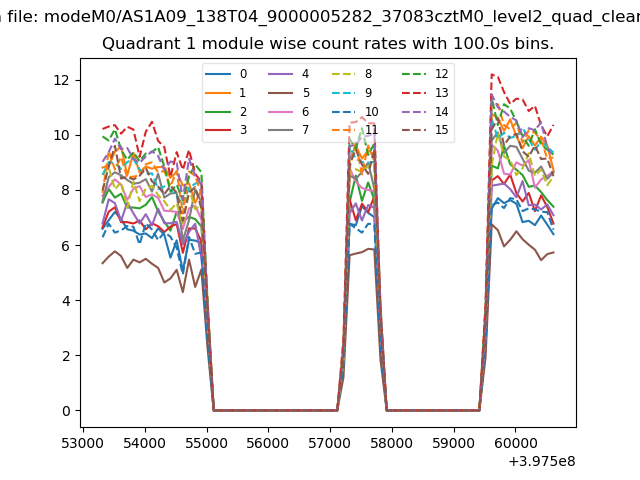
| Module-wise count rates for Quadrant A Data is divided into 100 sec bins |
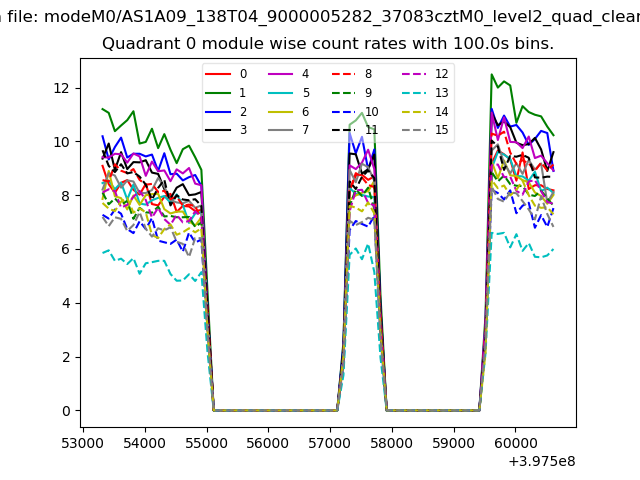 |
 |
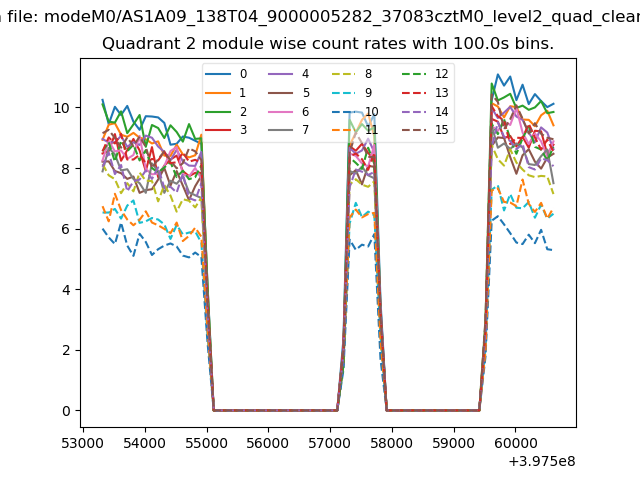
| Module-wise count rates for Quadrant B Data is divided into 100 sec bins |
 |
 |
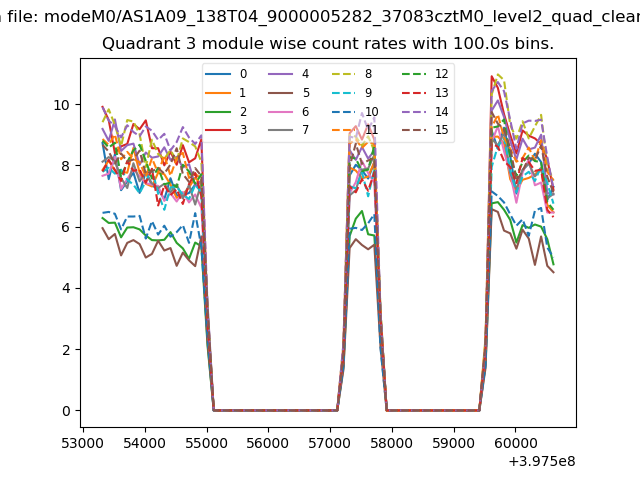
| Module-wise count rates for Quadrant C Data is divided into 100 sec bins |
 |
 |
| Module-wise count rates for Quadrant D Data is divided into 100 sec bins |
 |
 |
| Parameter | Plot |
|---|---|
| CZT HV Monitor | 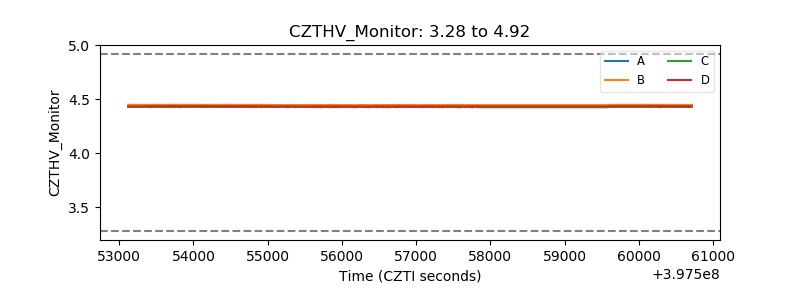 |
| D_VDD | 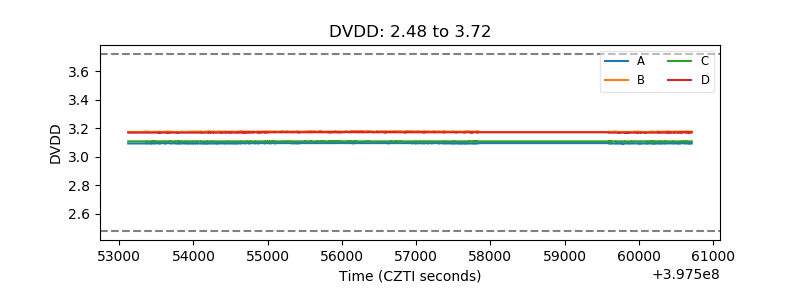 |
| Temperature 1 | 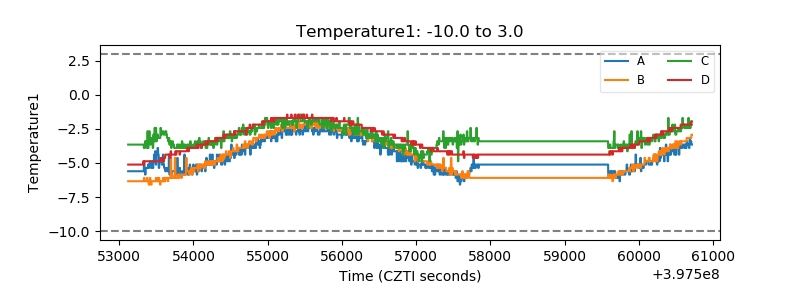 |
| Veto HV Monitor | 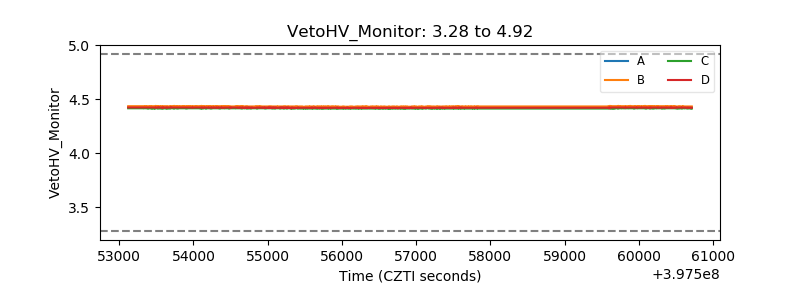 |
| Veto LLD | 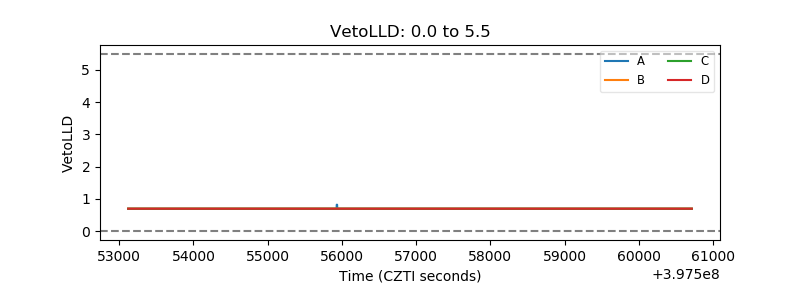 |
| Alpha Counter | 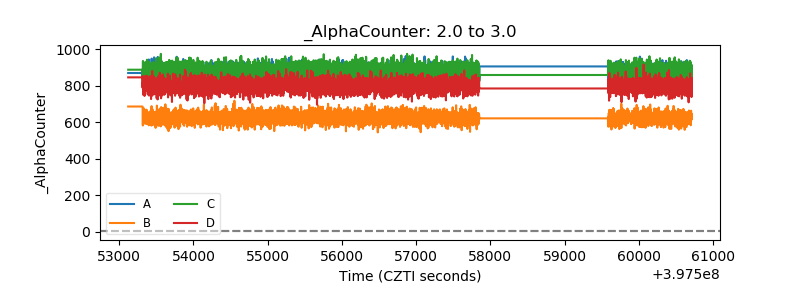 |
| _CPM_Rate | 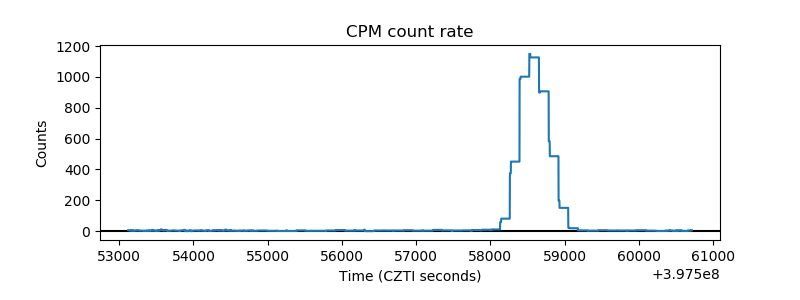 |
| CZT Counter | 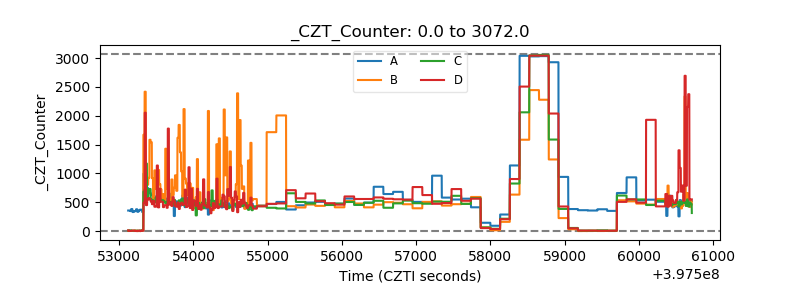 |
| +2.5 Volts monitor | 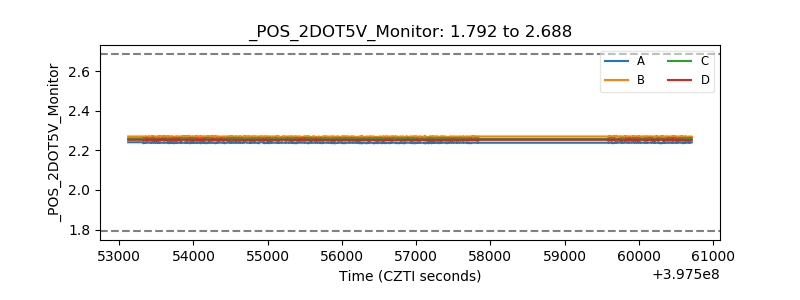 |
| +5 Volts monitor | 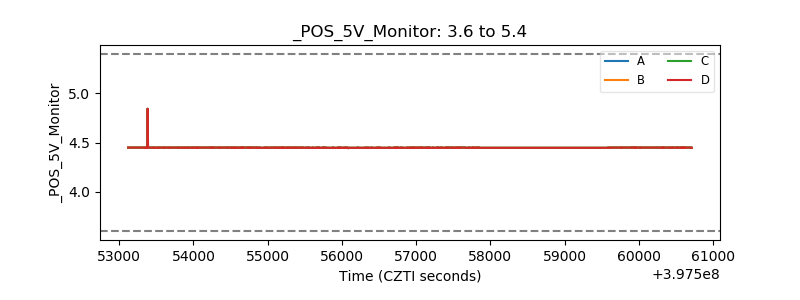 |
| _ROLL_ROT | 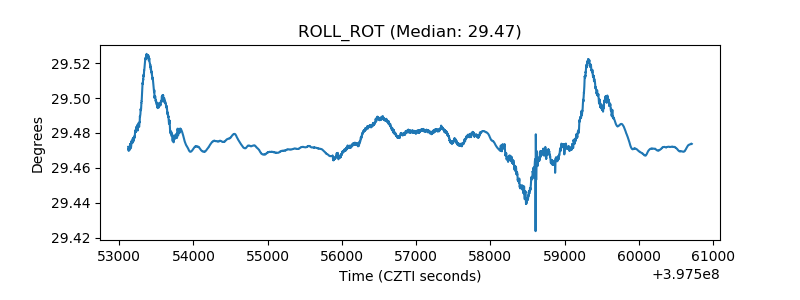 |
| _Roll_DEC | 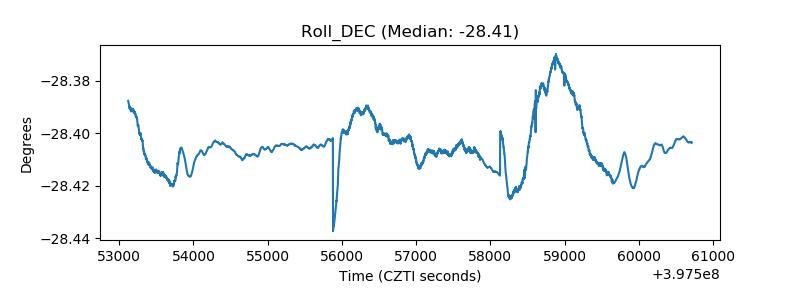 |
| _Roll_RA | 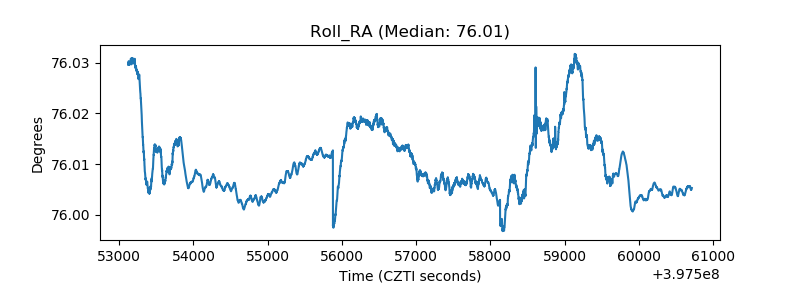 |
| Veto Counter | 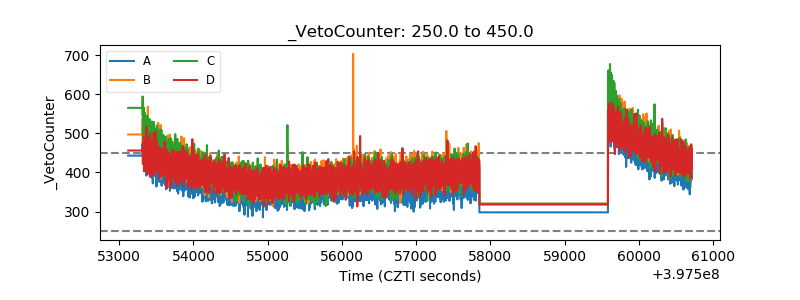 |