| Param | Original file | Final file |
|---|---|---|
| Filename | modeM0/AS1A09_138T04_9000005282_37084cztM0_level2.evt | modeM0/AS1A09_138T04_9000005282_37084cztM0_level2_quad_clean.evt |
| Size (bytes) | 532,549,440 | 67,622,400 |
| Size | 507.9 MB | 64.5 MB |
| Events in quadrant A | 2,941,493 | 442,611 |
| Events in quadrant B | 5,110,250 | 399,154 |
| Events in quadrant C | 2,887,420 | 429,509 |
| Events in quadrant D | 4,822,031 | 397,319 |
| Mode SS | |||
|---|---|---|---|
| Quadrant | BADHDUFLAG | Total packets | Discarded packets |
| A | 0 | 110 | 0 |
| B | 0 | 110 | 0 |
| C | 0 | 110 | 0 |
| D | 0 | 110 | 0 |
| Mode M0 | |||
|---|---|---|---|
| Quadrant | BADHDUFLAG | Total packets | Discarded packets |
| A | 0 | 11869 | 3 |
| B | 0 | 18555 | 2 |
| C | 0 | 11622 | 2 |
| D | 0 | 17981 | 2 |
| Mode M9 | |||
|---|---|---|---|
| Quadrant | BADHDUFLAG | Total packets | Discarded packets |
| A | 0 | 20 | 0 |
| B | 0 | 20 | 0 |
| C | 0 | 20 | 0 |
| D | 0 | 21 | 0 |
| Quadrant | Total seconds | Saturated seconds | Saturation percentage |
|---|---|---|---|
| A | 5409 | 18 | 0.332779% |
| B | 5409 | 1547 | 28.600481% |
| C | 5409 | 18 | 0.332779% |
| D | 5409 | 487 | 9.003513% |
Noise dominated data is calculated using 1-second bins in cleaned event files. If a bin has >2000 counts, and if more than 50% of those come from <1% of pixels, then it is considered to be noise-dominated and hence unusable.
| Quadrant | # 1 sec bins | Bins with >0 counts | Bins with >2000 counts | High rate bins dominated by noise | Noise dominated (total time) | Noise dominated (detector-on time) | Marked lightcurve |
|---|---|---|---|---|---|---|---|
| A | 7262 | 5410 | 5 | 5 | 0.07% | 0.09% | 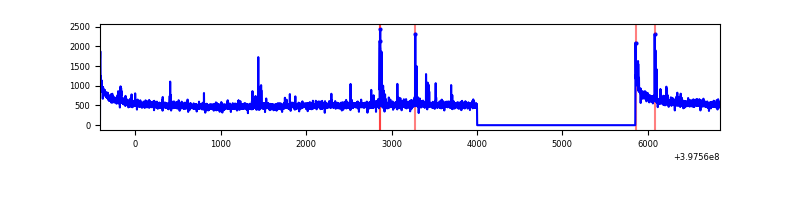 |
| B | 7262 | 5410 | 490 | 490 | 6.75% | 9.06% | 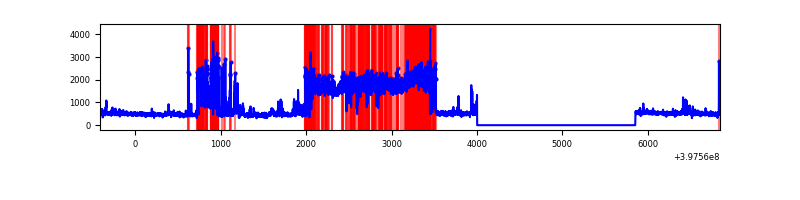 |
| C | 7262 | 5410 | 14 | 14 | 0.19% | 0.26% | 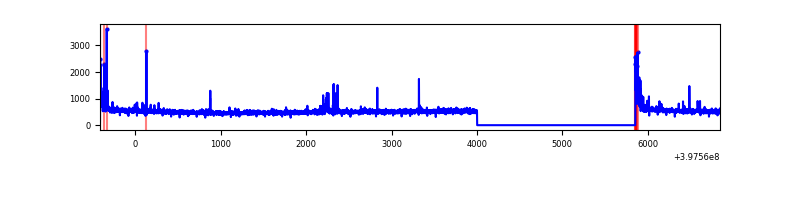 |
| D | 7262 | 5410 | 467 | 467 | 6.43% | 8.63% | 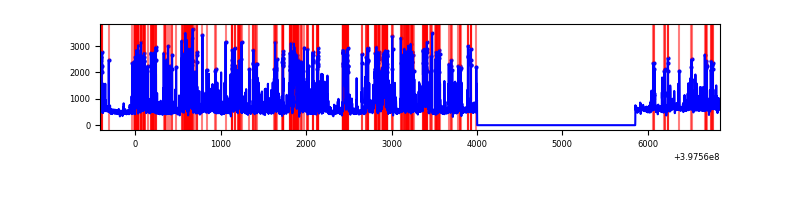 |
Top three noisy pixels from each quadrant. If the there are fewer than three noisy pixels in the level2.evt file, extra rows are filled as -1
| Pixel properties | Quadrant properties | ||||||
|---|---|---|---|---|---|---|---|
| Quadrant | DetID | PixID | Counts | Sigma | Mean | Median | Sigma |
| A | 10 | 83 | 261062 | 1936.7 | 670 | 658 | 134.5 |
| A | 7 | 3 | 65842 | 484.79 | 670 | 658 | 134.5 |
| A | 9 | 143 | 16562 | 118.28 | 670 | 658 | 134.5 |
| B | 5 | 184 | 3037742 | 31104.33 | 507 | 494 | 97.6 |
| B | 5 | 255 | 21095 | 210.97 | 507 | 494 | 97.6 |
| B | 4 | 81 | 13032 | 128.4 | 507 | 494 | 97.6 |
| C | 15 | 214 | 234245 | 1571.18 | 637 | 641 | 148.7 |
| C | 0 | 10 | 97822 | 653.62 | 637 | 641 | 148.7 |
| C | 10 | 20 | 43130 | 285.77 | 637 | 641 | 148.7 |
| D | 12 | 17 | 740162 | 4784.62 | 630 | 614 | 154.6 |
| D | 1 | 47 | 524899 | 3391.94 | 630 | 614 | 154.6 |
| D | 13 | 249 | 179607 | 1158.02 | 630 | 614 | 154.6 |
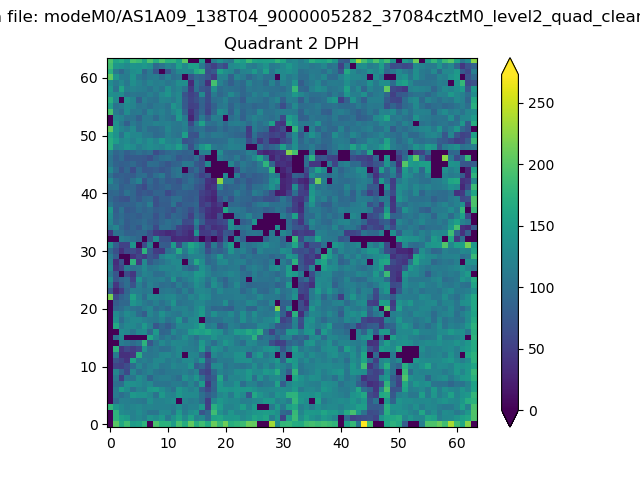
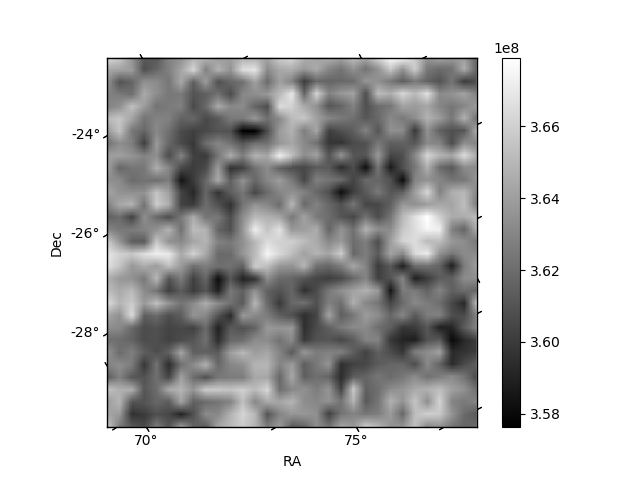
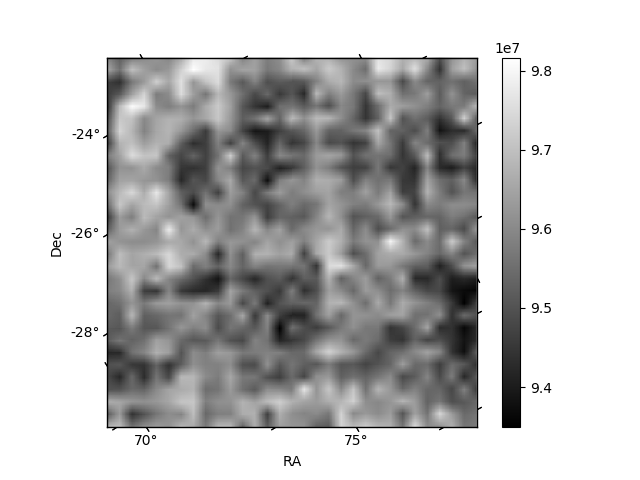
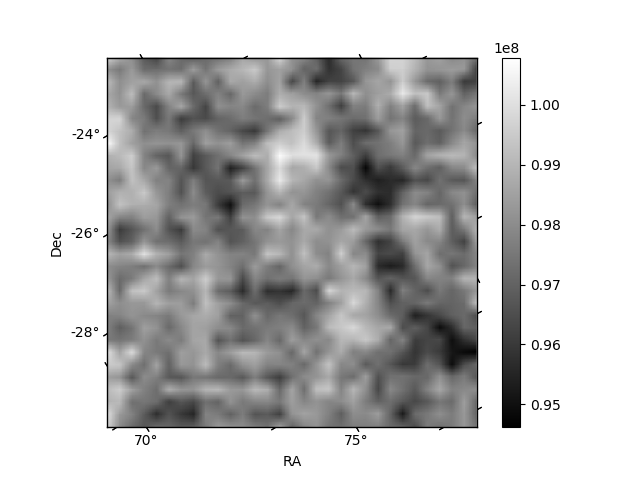
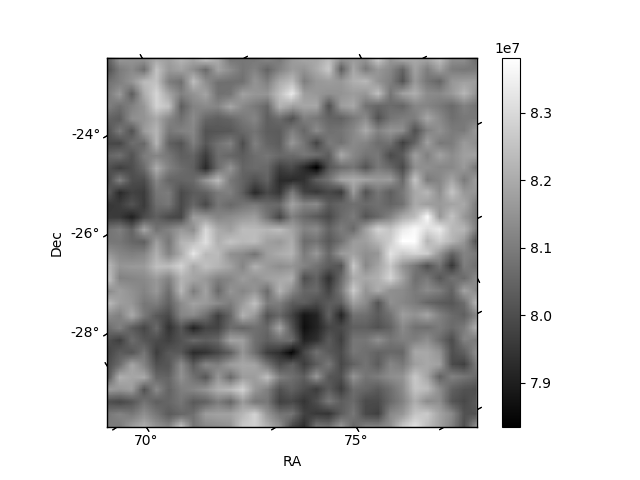
Histogram calculated using DETX and DETY for each event in the final _common_clean file
| Quadrant A | 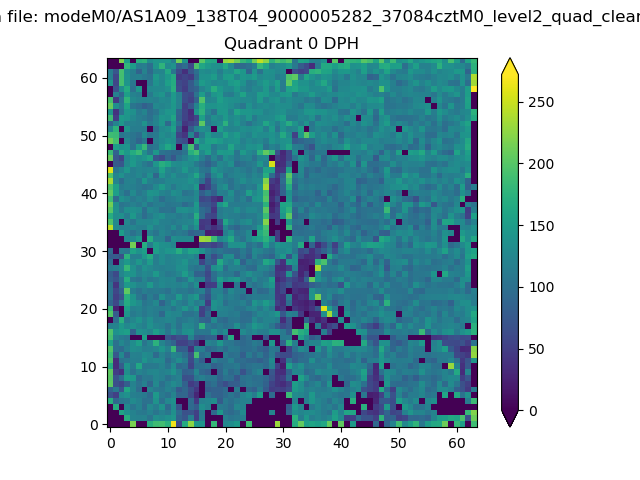 |
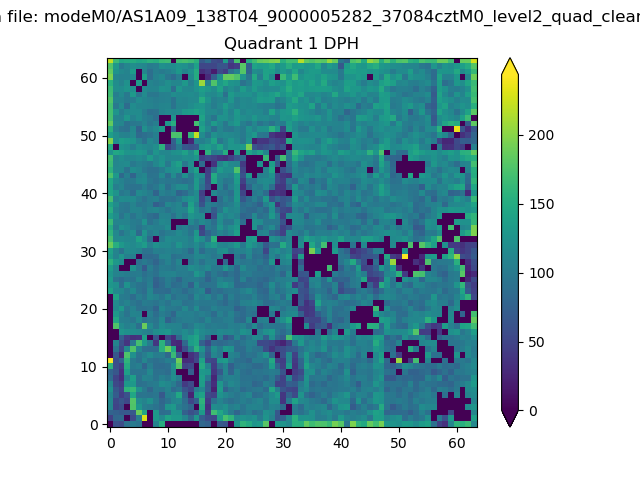 |
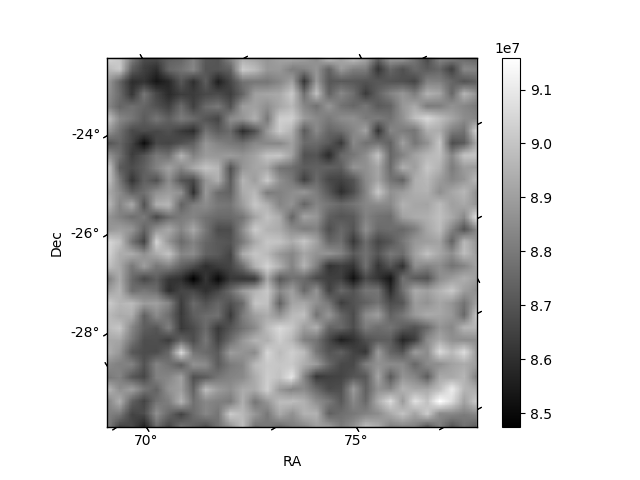
Quadrant B |
|---|---|---|---|
| Quadrant D | 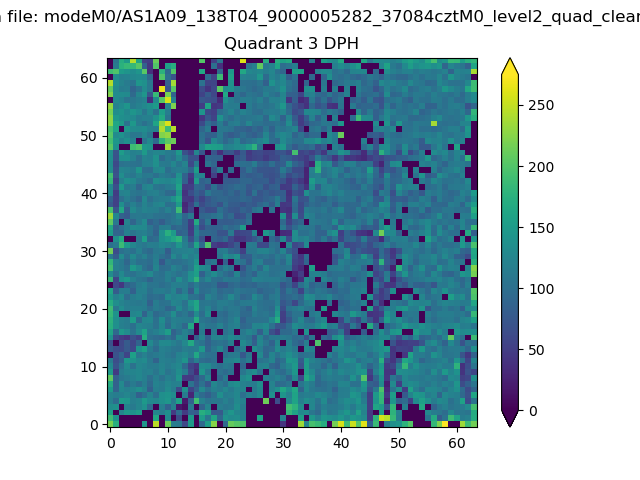 |
 |
Quadrant C |
| Plot type | Count rate plots | Images |
|---|---|---|
| Comparison with Poisson distribution Blue bars denote a histogram of data divided into 1 sec bins. Red curve is a Poisson curve with rate = median count rate of data. |
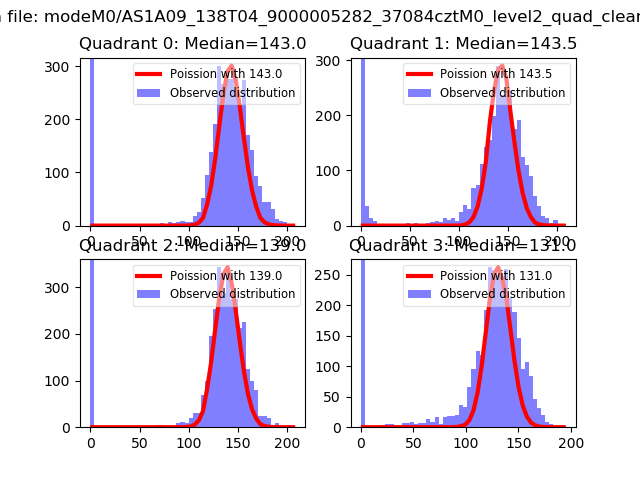 |
 |
| Quadrant-wise count rates Data is divided into 100 sec bins |
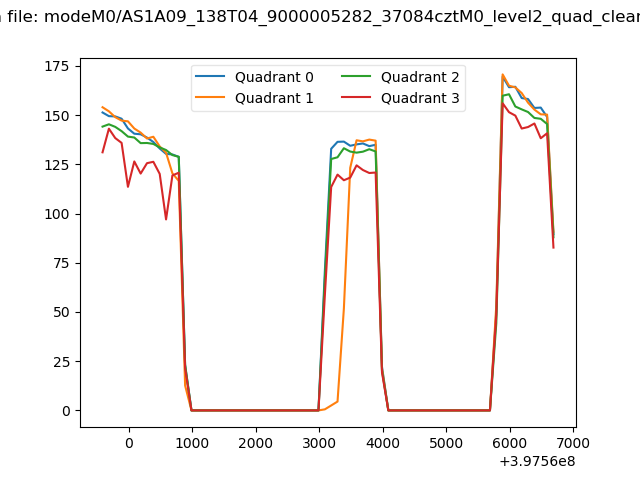 |
|
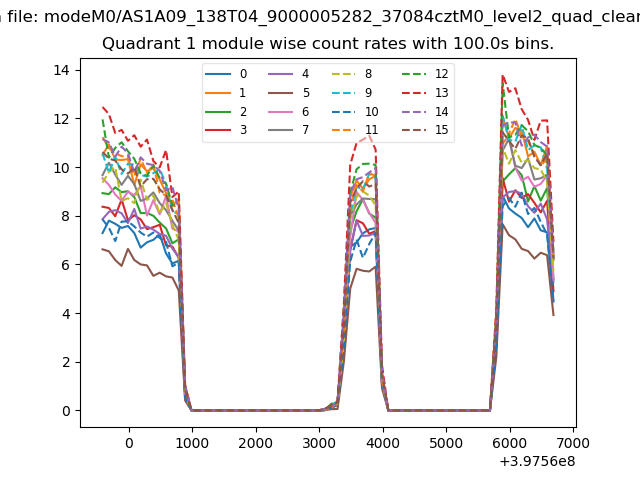
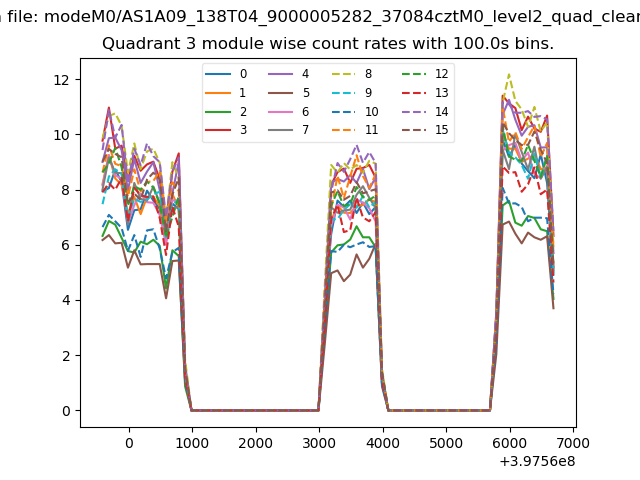
| Module-wise count rates for Quadrant A Data is divided into 100 sec bins |
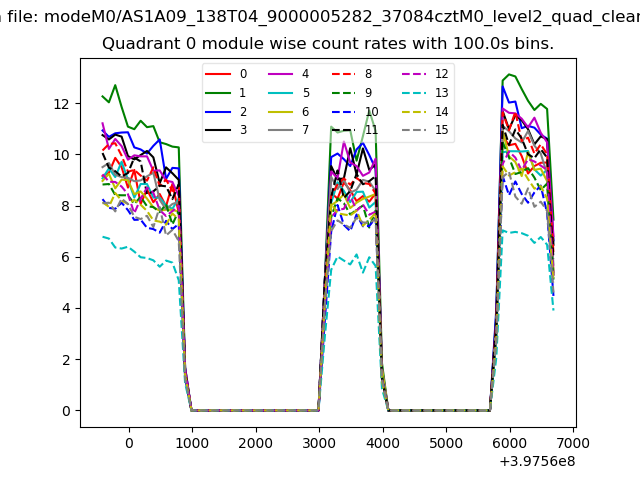 |
 |
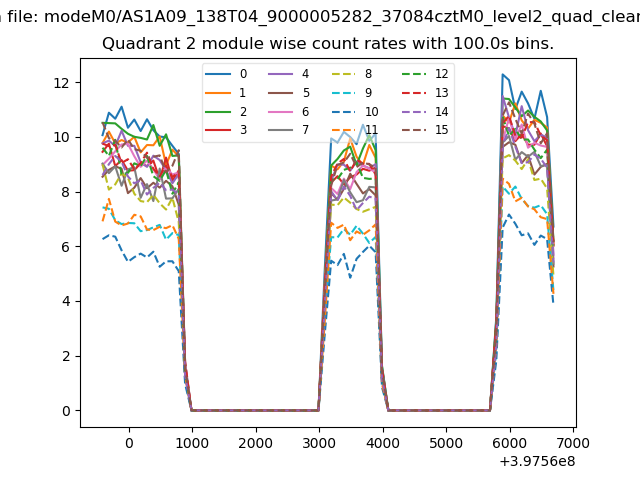
| Module-wise count rates for Quadrant B Data is divided into 100 sec bins |
 |
 |
| Module-wise count rates for Quadrant C Data is divided into 100 sec bins |
 |
 |
| Module-wise count rates for Quadrant D Data is divided into 100 sec bins |
 |
 |
| Parameter | Plot |
|---|---|
| CZT HV Monitor | 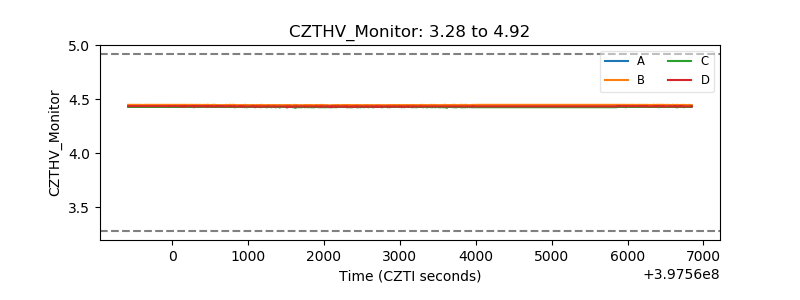 |
| D_VDD | 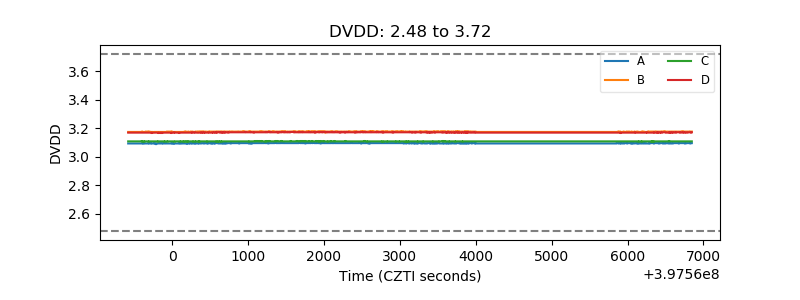 |
| Temperature 1 | 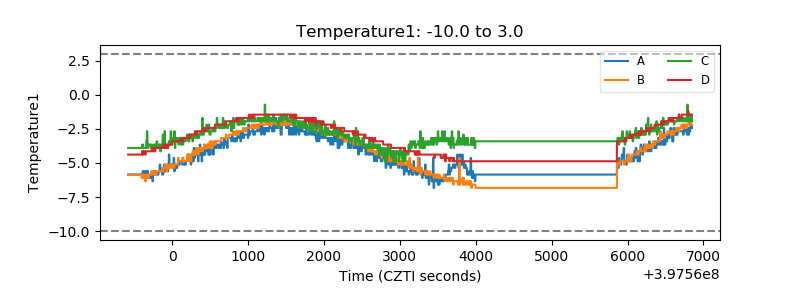 |
| Veto HV Monitor | 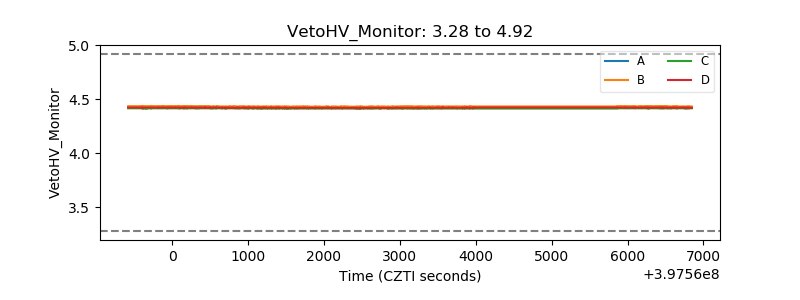 |
| Veto LLD | 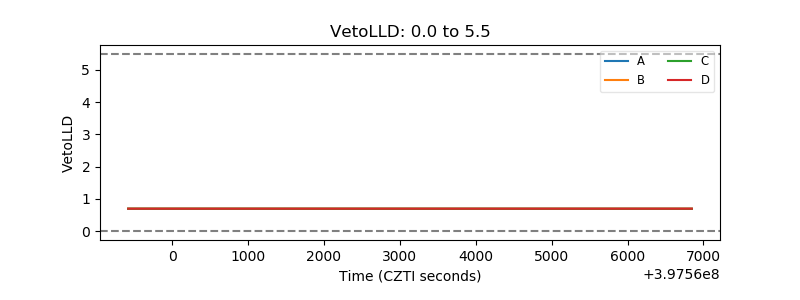 |
| Alpha Counter | 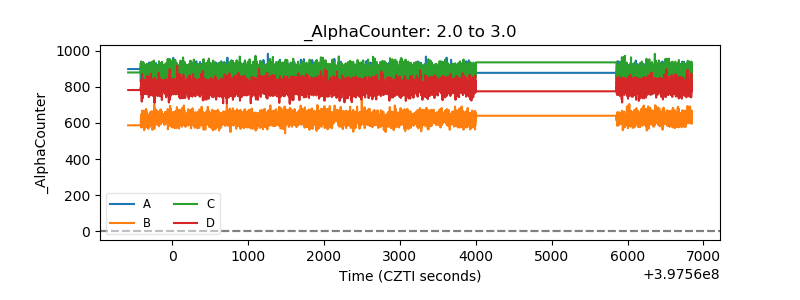 |
| _CPM_Rate | 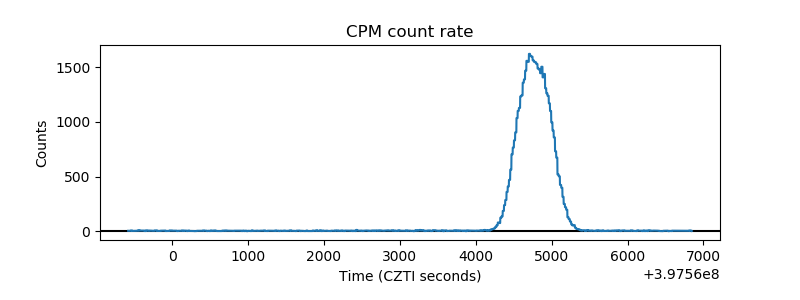 |
| CZT Counter | 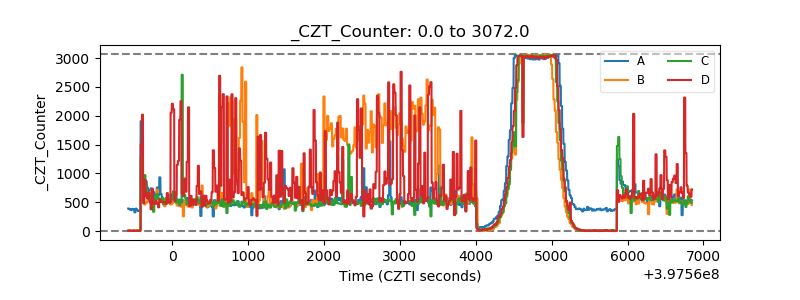 |
| +2.5 Volts monitor | 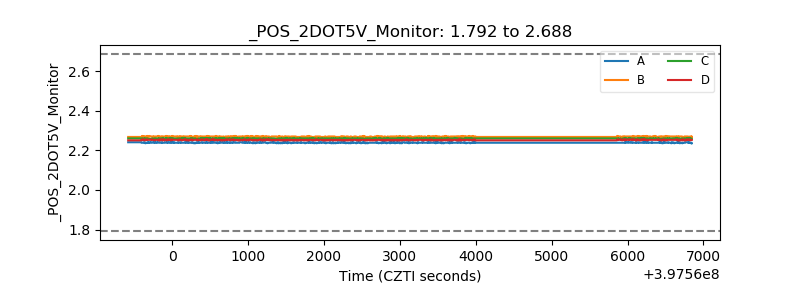 |
| +5 Volts monitor | 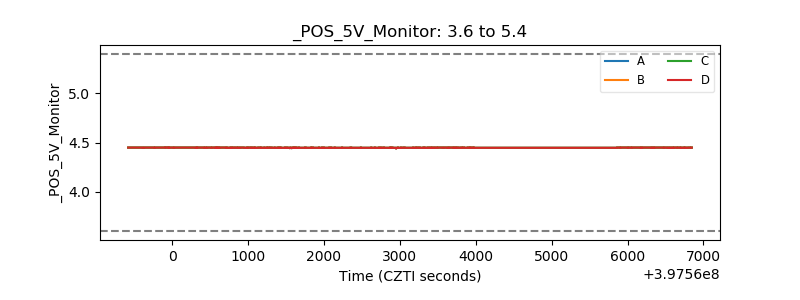 |
| _ROLL_ROT | 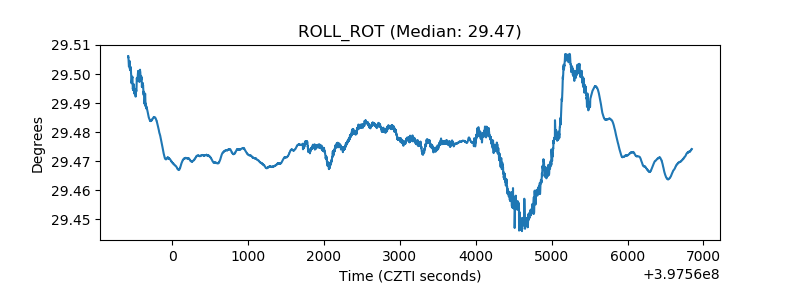 |
| _Roll_DEC | 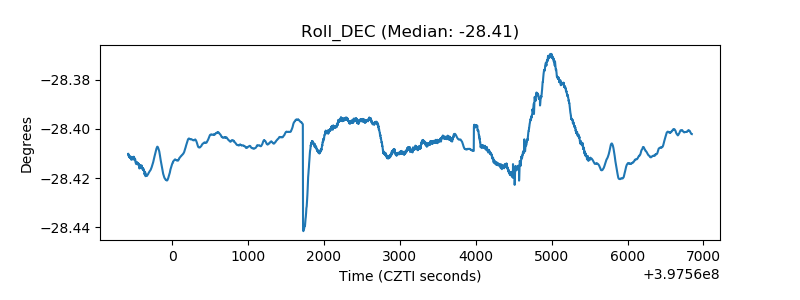 |
| _Roll_RA | 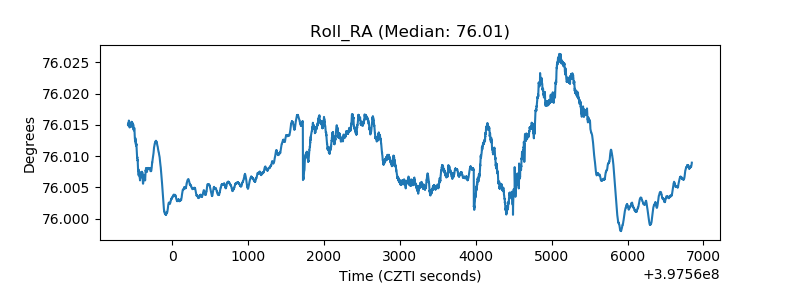 |
| Veto Counter |  |