| Param | Original file | Final file |
|---|---|---|
| Filename | modeM0/AS1A09_138T04_9000005282_37085cztM0_level2.evt | modeM0/AS1A09_138T04_9000005282_37085cztM0_level2_quad_clean.evt |
| Size (bytes) | 456,750,720 | 61,608,960 |
| Size | 435.6 MB | 58.8 MB |
| Events in quadrant A | 2,993,047 | 386,625 |
| Events in quadrant B | 3,018,672 | 388,092 |
| Events in quadrant C | 3,000,659 | 369,960 |
| Events in quadrant D | 4,458,354 | 346,709 |
| Mode SS | |||
|---|---|---|---|
| Quadrant | BADHDUFLAG | Total packets | Discarded packets |
| A | 0 | 108 | 0 |
| B | 0 | 108 | 0 |
| C | 0 | 108 | 0 |
| D | 0 | 108 | 0 |
| Mode M0 | |||
|---|---|---|---|
| Quadrant | BADHDUFLAG | Total packets | Discarded packets |
| A | 0 | 11923 | 3 |
| B | 0 | 12078 | 2 |
| C | 0 | 11848 | 2 |
| D | 0 | 16930 | 2 |
| Mode M9 | |||
|---|---|---|---|
| Quadrant | BADHDUFLAG | Total packets | Discarded packets |
| A | 0 | 24 | 0 |
| B | 0 | 24 | 0 |
| C | 0 | 24 | 0 |
| D | 0 | 25 | 0 |
| Quadrant | Total seconds | Saturated seconds | Saturation percentage |
|---|---|---|---|
| A | 5341 | 8 | 0.149785% |
| B | 5341 | 33 | 0.617862% |
| C | 5341 | 21 | 0.393185% |
| D | 5341 | 249 | 4.662048% |
Noise dominated data is calculated using 1-second bins in cleaned event files. If a bin has >2000 counts, and if more than 50% of those come from <1% of pixels, then it is considered to be noise-dominated and hence unusable.
| Quadrant | # 1 sec bins | Bins with >0 counts | Bins with >2000 counts | High rate bins dominated by noise | Noise dominated (total time) | Noise dominated (detector-on time) | Marked lightcurve |
|---|---|---|---|---|---|---|---|
| A | 7314 | 5342 | 4 | 4 | 0.05% | 0.07% | 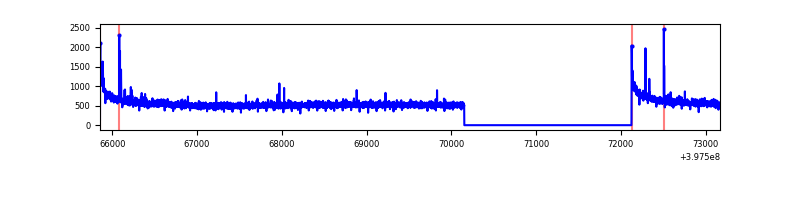 |
| B | 7314 | 5342 | 14 | 14 | 0.19% | 0.26% | 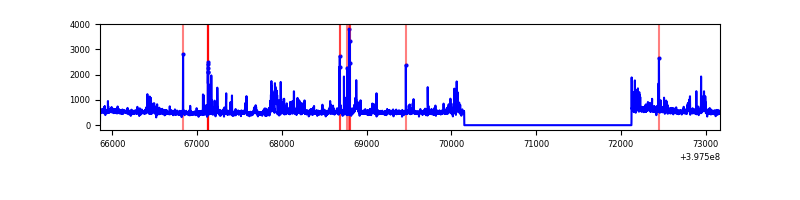 |
| C | 7314 | 5342 | 21 | 21 | 0.29% | 0.39% | 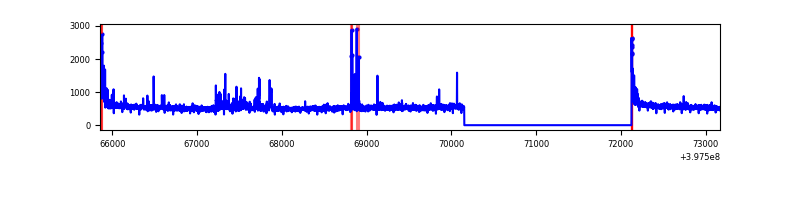 |
| D | 7314 | 5342 | 249 | 249 | 3.40% | 4.66% | 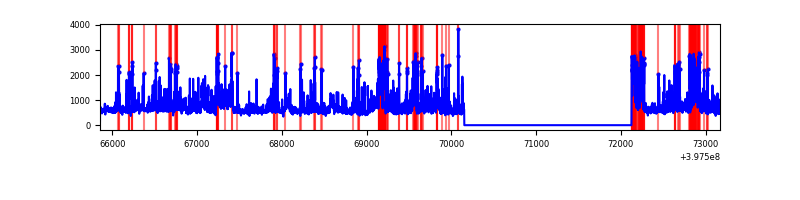 |
Top three noisy pixels from each quadrant. If the there are fewer than three noisy pixels in the level2.evt file, extra rows are filled as -1
| Pixel properties | Quadrant properties | ||||||
|---|---|---|---|---|---|---|---|
| Quadrant | DetID | PixID | Counts | Sigma | Mean | Median | Sigma |
| A | 10 | 83 | 267069 | 1926.22 | 691 | 679 | 138.3 |
| A | 9 | 143 | 23417 | 164.41 | 691 | 679 | 138.3 |
| A | 7 | 3 | 15022 | 103.71 | 691 | 679 | 138.3 |
| B | 5 | 184 | 186450 | 1454.44 | 676 | 661 | 127.7 |
| B | 5 | 255 | 37730 | 290.19 | 676 | 661 | 127.7 |
| B | 4 | 81 | 35473 | 272.52 | 676 | 661 | 127.7 |
| C | 15 | 214 | 231351 | 1533.51 | 652 | 659 | 150.4 |
| C | 0 | 10 | 168656 | 1116.75 | 652 | 659 | 150.4 |
| C | 1 | 23 | 34525 | 225.12 | 652 | 659 | 150.4 |
| D | 12 | 17 | 509272 | 3193.52 | 658 | 639 | 159.3 |
| D | 1 | 20 | 212100 | 1327.68 | 658 | 639 | 159.3 |
| D | 2 | 249 | 199323 | 1247.46 | 658 | 639 | 159.3 |
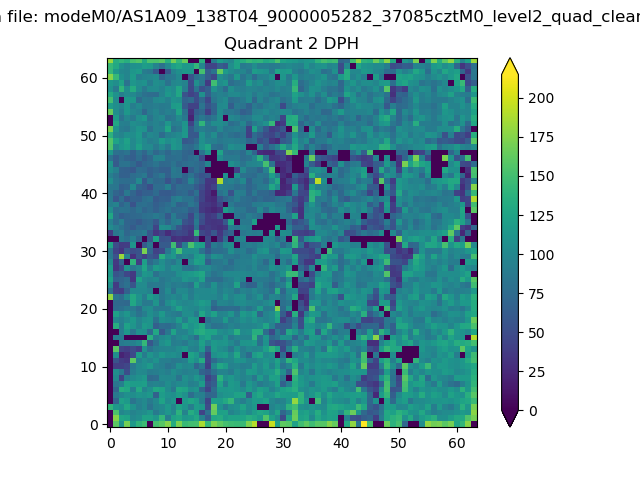
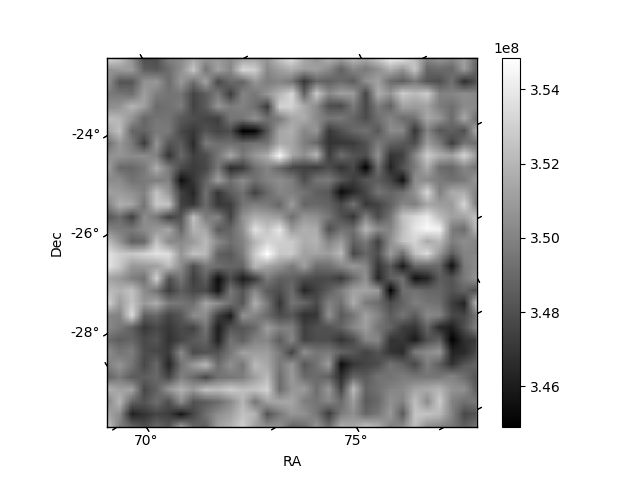
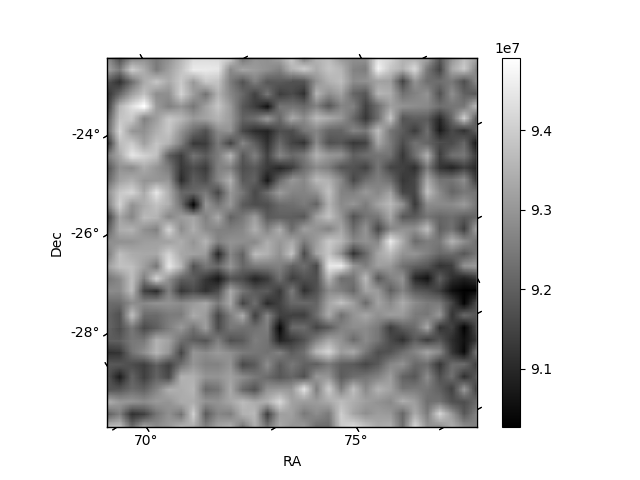
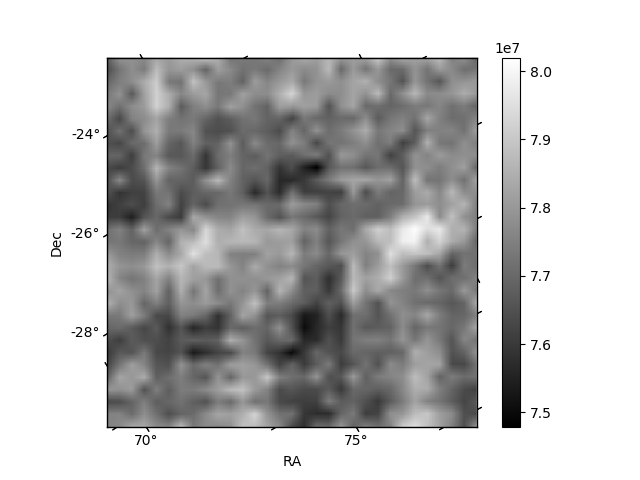
Histogram calculated using DETX and DETY for each event in the final _common_clean file
| Quadrant A | 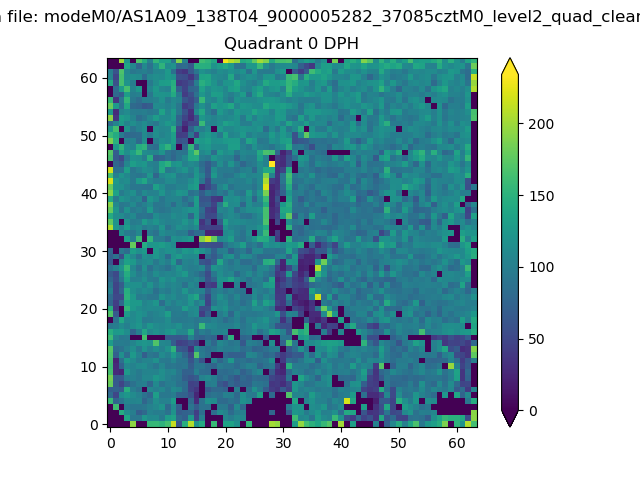 |
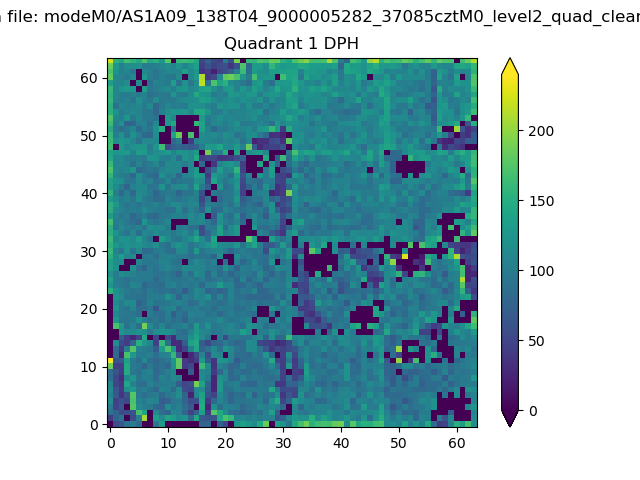 |
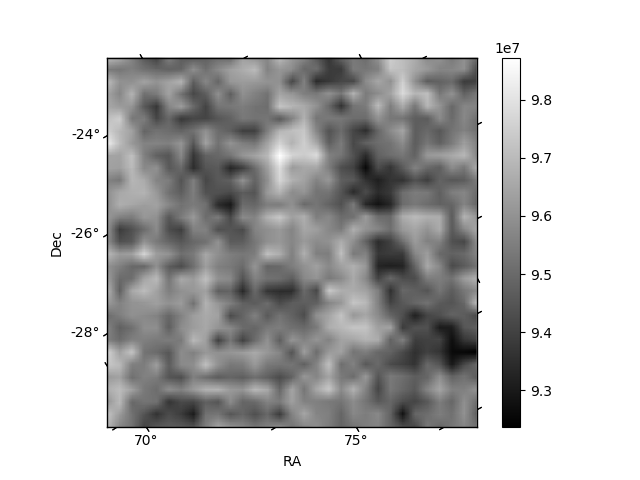
Quadrant B |
|---|---|---|---|
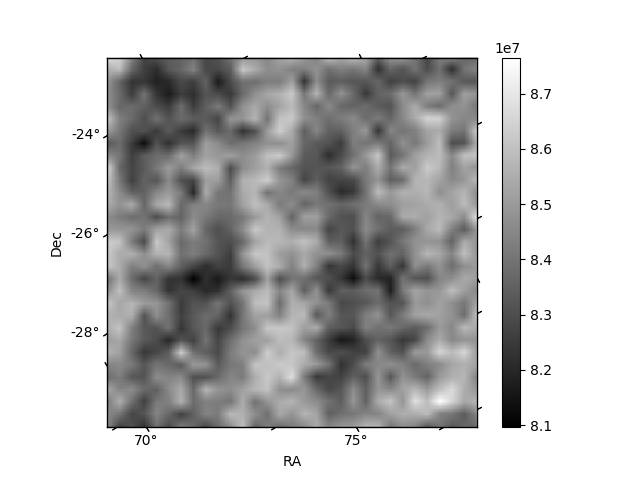
| Quadrant D | 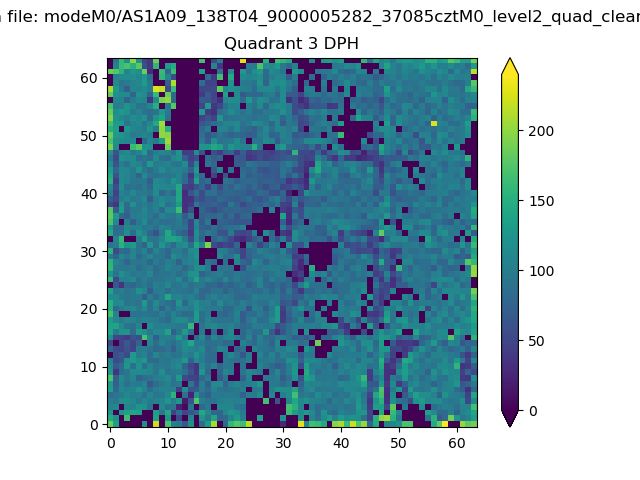 |
 |
Quadrant C |
| Plot type | Count rate plots | Images |
|---|---|---|
| Comparison with Poisson distribution Blue bars denote a histogram of data divided into 1 sec bins. Red curve is a Poisson curve with rate = median count rate of data. |
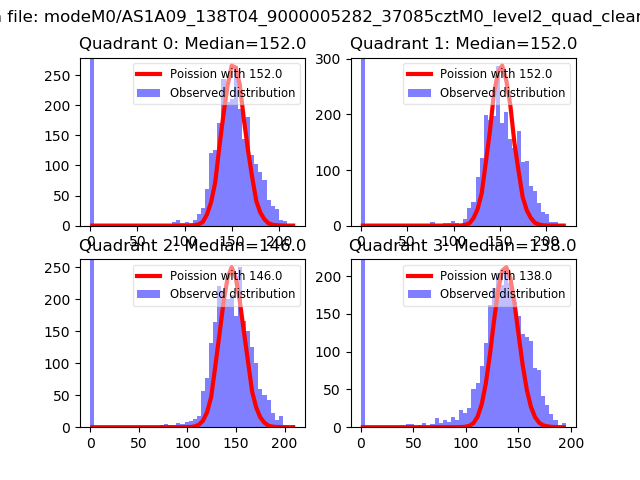 |
 |
| Quadrant-wise count rates Data is divided into 100 sec bins |
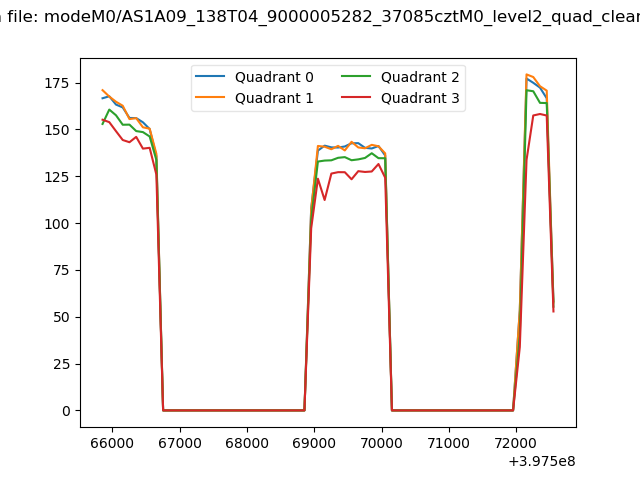 |
|
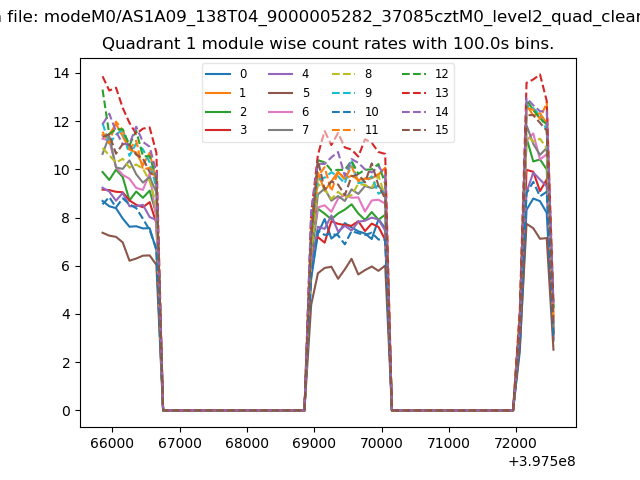
| Module-wise count rates for Quadrant A Data is divided into 100 sec bins |
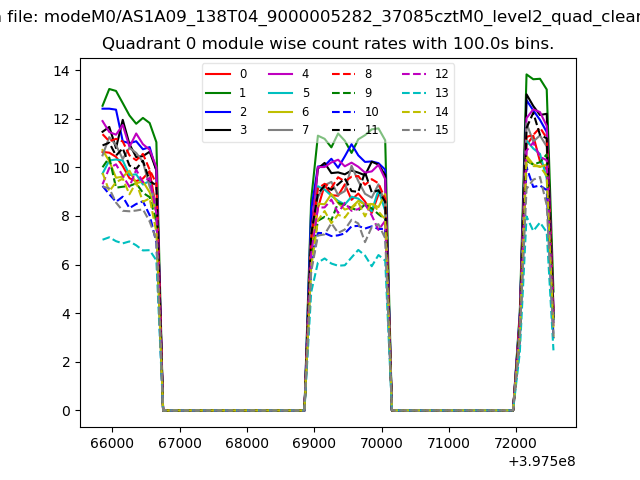 |
 |
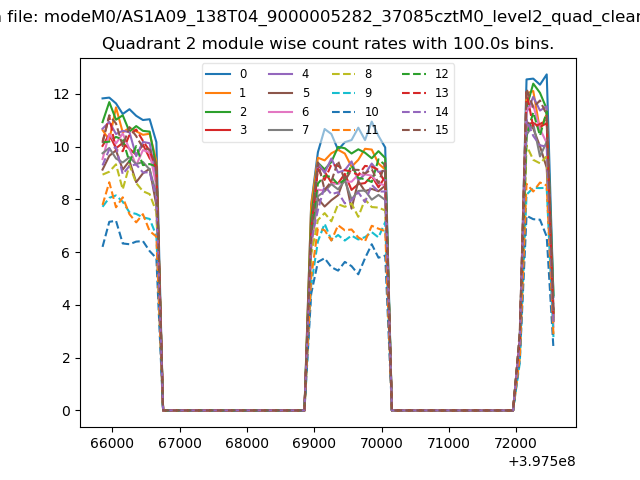
| Module-wise count rates for Quadrant B Data is divided into 100 sec bins |
 |
 |
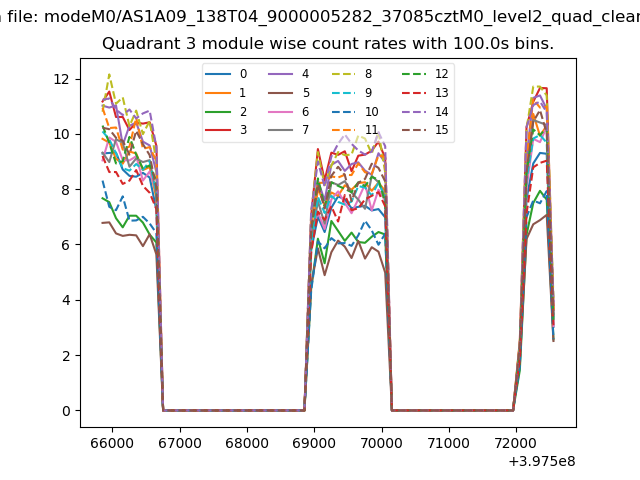
| Module-wise count rates for Quadrant C Data is divided into 100 sec bins |
 |
 |
| Module-wise count rates for Quadrant D Data is divided into 100 sec bins |
 |
 |
| Parameter | Plot |
|---|---|
| CZT HV Monitor | 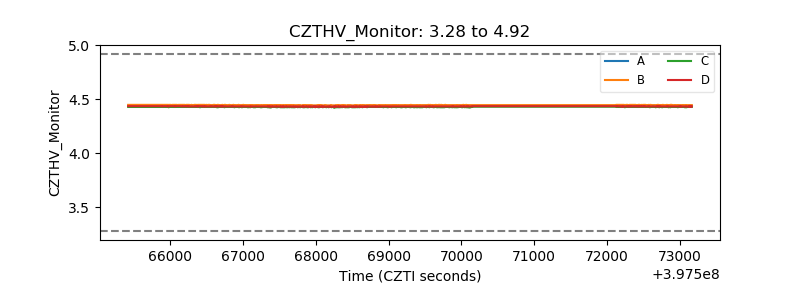 |
| D_VDD | 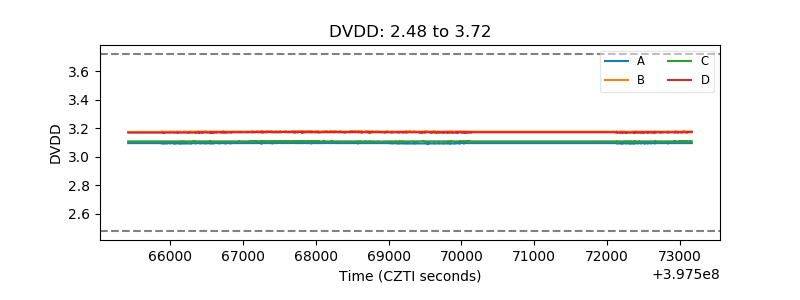 |
| Temperature 1 | 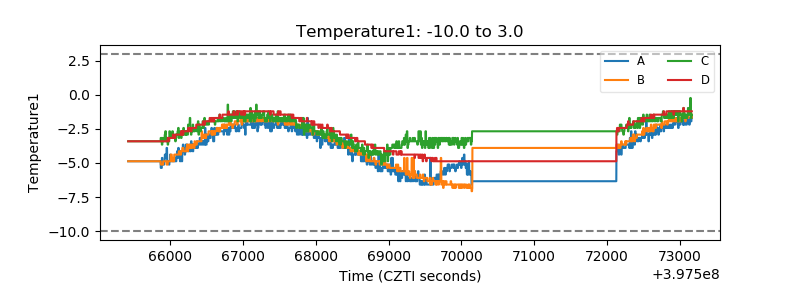 |
| Veto HV Monitor | 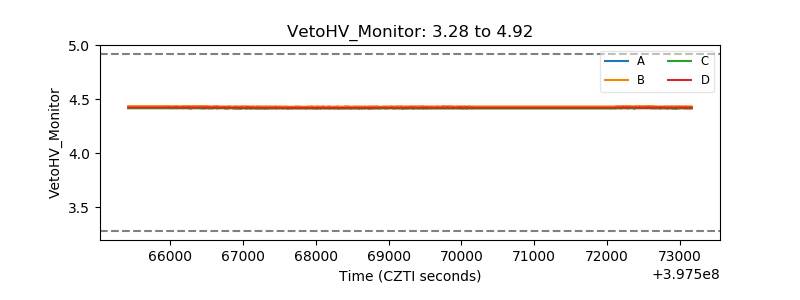 |
| Veto LLD | 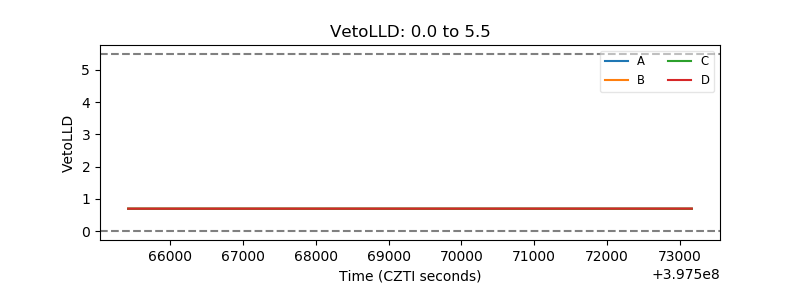 |
| Alpha Counter | 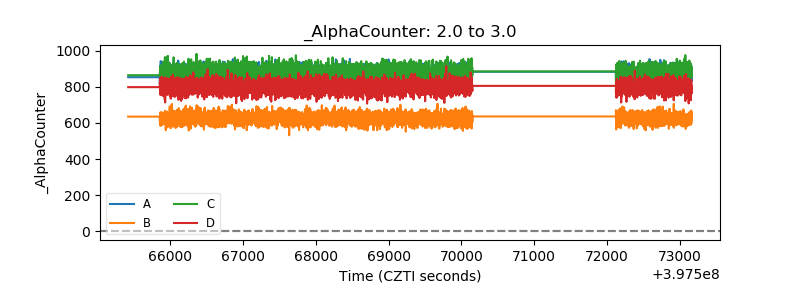 |
| _CPM_Rate | 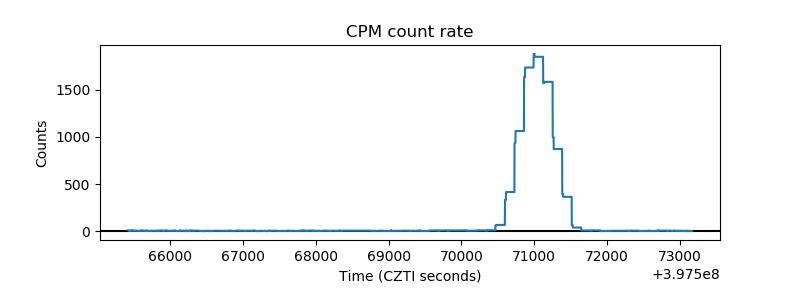 |
| CZT Counter | 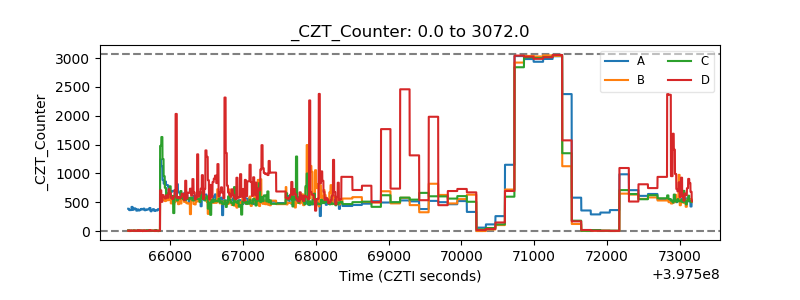 |
| +2.5 Volts monitor | 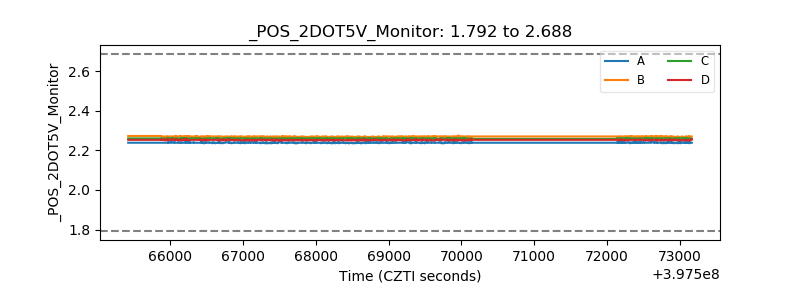 |
| +5 Volts monitor | 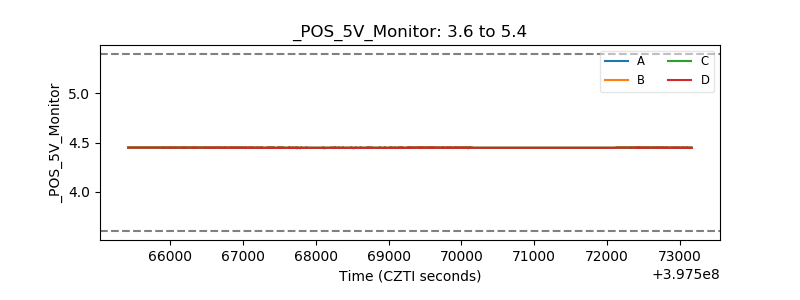 |
| _ROLL_ROT | 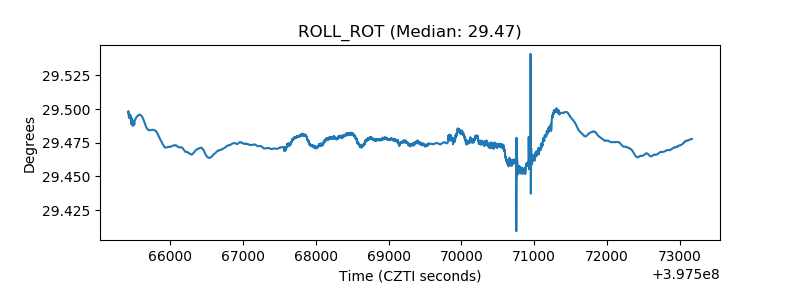 |
| _Roll_DEC | 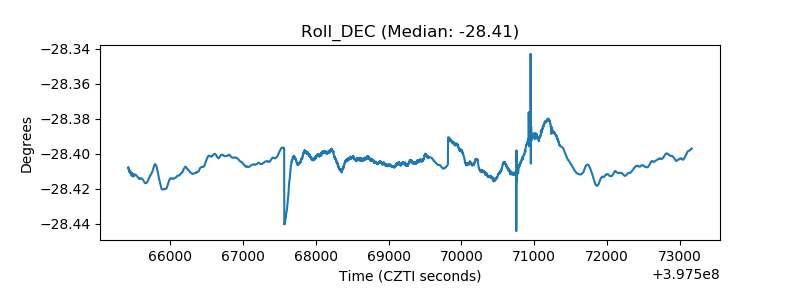 |
| _Roll_RA | 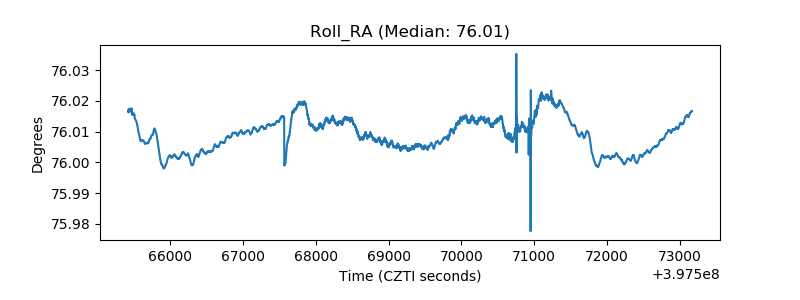 |
| Veto Counter | 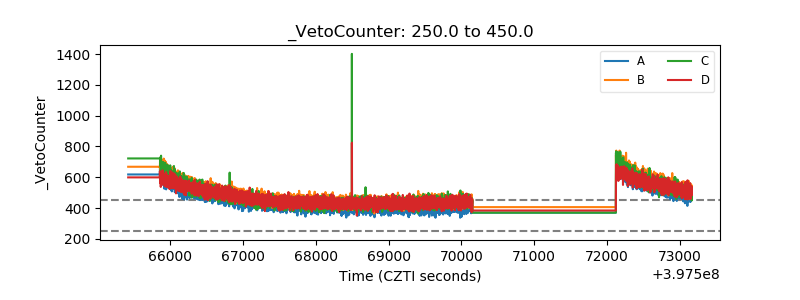 |