| Param | Original file | Final file |
|---|---|---|
| Filename | modeM0/AS1A09_138T04_9000005282_37086cztM0_level2.evt | modeM0/AS1A09_138T04_9000005282_37086cztM0_level2_quad_clean.evt |
| Size (bytes) | 468,509,760 | 50,296,320 |
| Size | 446.8 MB | 48.0 MB |
| Events in quadrant A | 2,993,566 | 301,065 |
| Events in quadrant B | 3,092,996 | 300,444 |
| Events in quadrant C | 2,970,700 | 285,805 |
| Events in quadrant D | 4,776,210 | 268,114 |
| Mode SS | |||
|---|---|---|---|
| Quadrant | BADHDUFLAG | Total packets | Discarded packets |
| A | 0 | 106 | 0 |
| B | 0 | 106 | 0 |
| C | 0 | 106 | 0 |
| D | 0 | 106 | 0 |
| Mode M0 | |||
|---|---|---|---|
| Quadrant | BADHDUFLAG | Total packets | Discarded packets |
| A | 0 | 11919 | 3 |
| B | 0 | 12218 | 2 |
| C | 0 | 11705 | 2 |
| D | 0 | 17806 | 2 |
| Mode M9 | |||
|---|---|---|---|
| Quadrant | BADHDUFLAG | Total packets | Discarded packets |
| A | 0 | 25 | 0 |
| B | 0 | 25 | 0 |
| C | 0 | 25 | 0 |
| D | 0 | 26 | 0 |
| Quadrant | Total seconds | Saturated seconds | Saturation percentage |
|---|---|---|---|
| A | 5243 | 11 | 0.209804% |
| B | 5243 | 58 | 1.106237% |
| C | 5243 | 53 | 1.010872% |
| D | 5243 | 422 | 8.048827% |
Noise dominated data is calculated using 1-second bins in cleaned event files. If a bin has >2000 counts, and if more than 50% of those come from <1% of pixels, then it is considered to be noise-dominated and hence unusable.
| Quadrant | # 1 sec bins | Bins with >0 counts | Bins with >2000 counts | High rate bins dominated by noise | Noise dominated (total time) | Noise dominated (detector-on time) | Marked lightcurve |
|---|---|---|---|---|---|---|---|
| A | 7336 | 5244 | 4 | 4 | 0.05% | 0.08% | 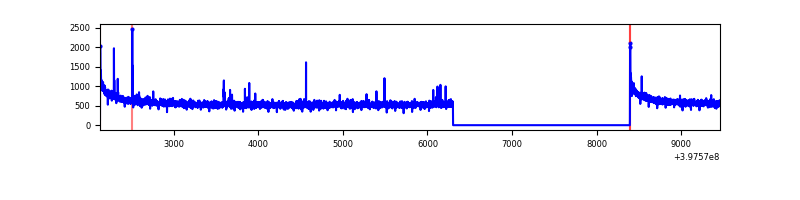 |
| B | 7336 | 5244 | 38 | 38 | 0.52% | 0.72% | 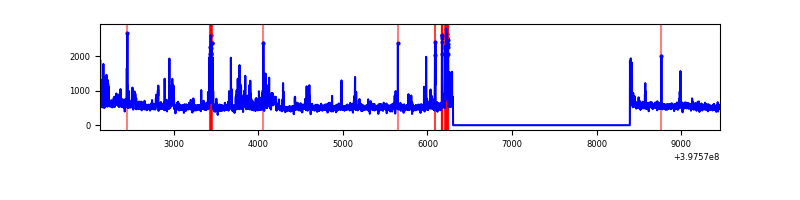 |
| C | 7336 | 5244 | 43 | 43 | 0.59% | 0.82% | 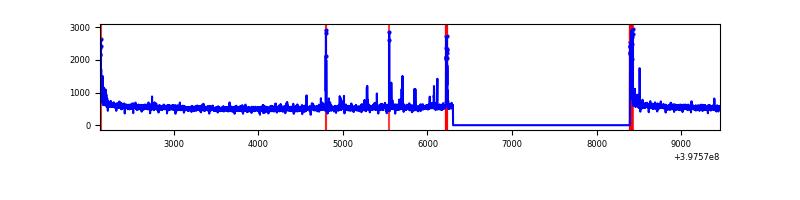 |
| D | 7336 | 5244 | 383 | 383 | 5.22% | 7.30% | 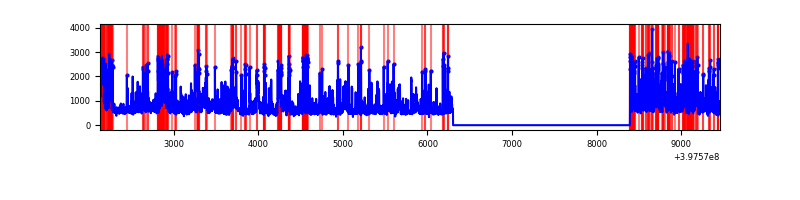 |
Top three noisy pixels from each quadrant. If the there are fewer than three noisy pixels in the level2.evt file, extra rows are filled as -1
| Pixel properties | Quadrant properties | ||||||
|---|---|---|---|---|---|---|---|
| Quadrant | DetID | PixID | Counts | Sigma | Mean | Median | Sigma |
| A | 10 | 83 | 267776 | 1925.33 | 693 | 682 | 138.7 |
| A | 7 | 3 | 21843 | 152.54 | 693 | 682 | 138.7 |
| A | 9 | 143 | 11151 | 75.47 | 693 | 682 | 138.7 |
| B | 5 | 184 | 207688 | 1615.1 | 679 | 664 | 128.2 |
| B | 5 | 255 | 96604 | 748.48 | 679 | 664 | 128.2 |
| B | 5 | 200 | 33536 | 256.45 | 679 | 664 | 128.2 |
| C | 15 | 214 | 224606 | 1505.51 | 650 | 657 | 148.8 |
| C | 0 | 10 | 102987 | 687.92 | 650 | 657 | 148.8 |
| C | 14 | 254 | 43169 | 285.79 | 650 | 657 | 148.8 |
| D | 1 | 47 | 427301 | 2741.72 | 646 | 628 | 155.6 |
| D | 2 | 153 | 282230 | 1809.52 | 646 | 628 | 155.6 |
| D | 12 | 17 | 250202 | 1603.71 | 646 | 628 | 155.6 |
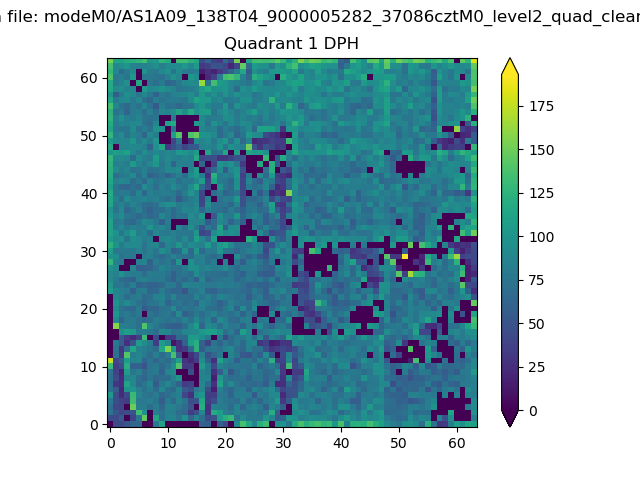
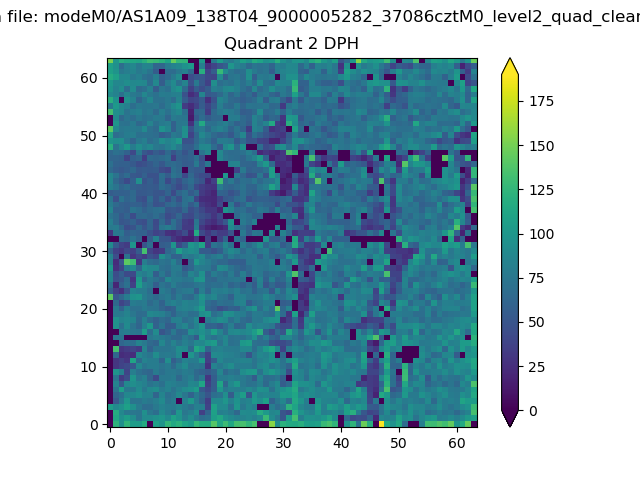
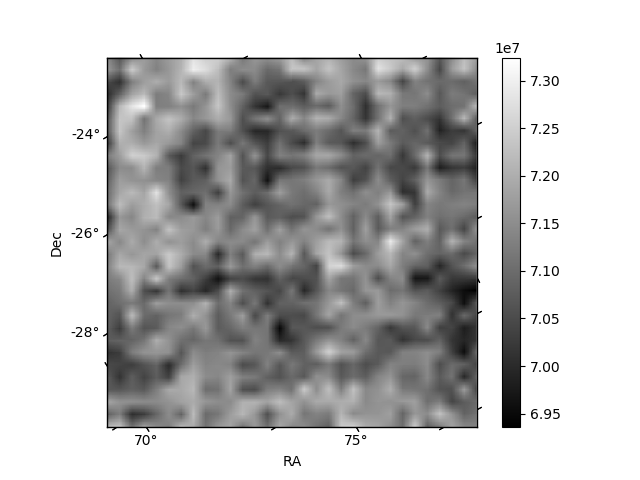
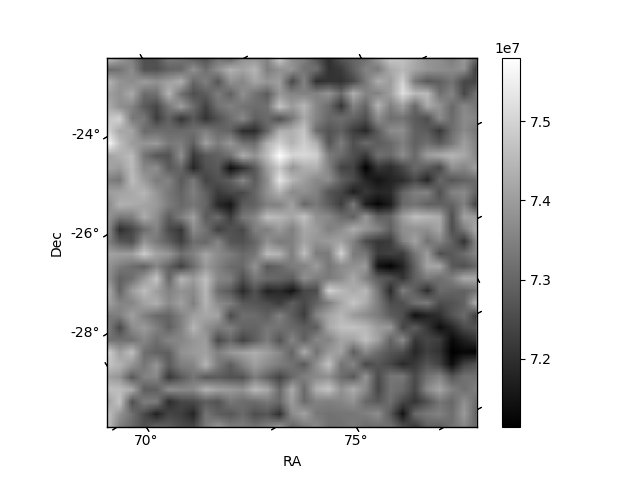
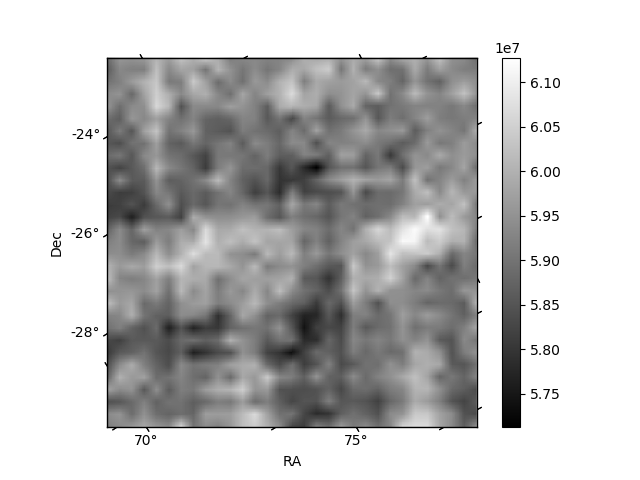
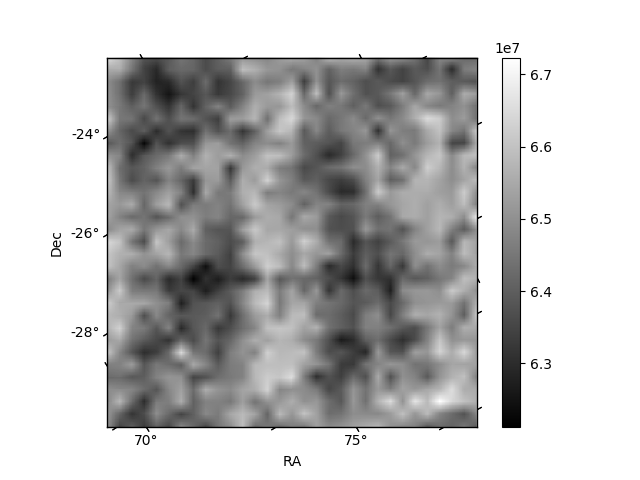
Histogram calculated using DETX and DETY for each event in the final _common_clean file
| Quadrant A |  |
 |
Quadrant B |
|---|---|---|---|
| Quadrant D | 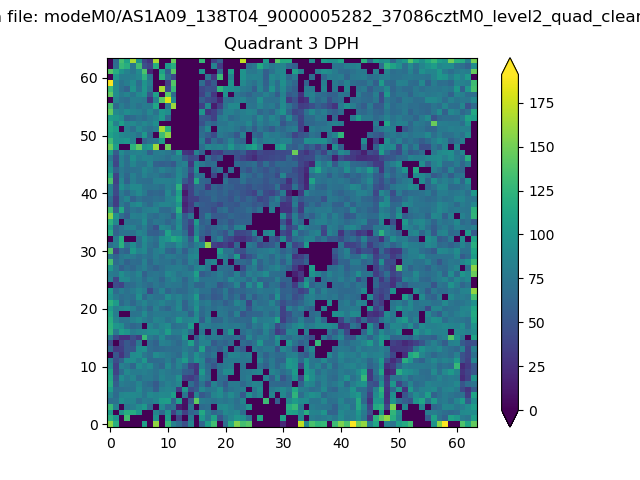 |
 |
Quadrant C |
| Plot type | Count rate plots | Images |
|---|---|---|
| Comparison with Poisson distribution Blue bars denote a histogram of data divided into 1 sec bins. Red curve is a Poisson curve with rate = median count rate of data. |
 |
 |
| Quadrant-wise count rates Data is divided into 100 sec bins |
 |
|
| Module-wise count rates for Quadrant A Data is divided into 100 sec bins |
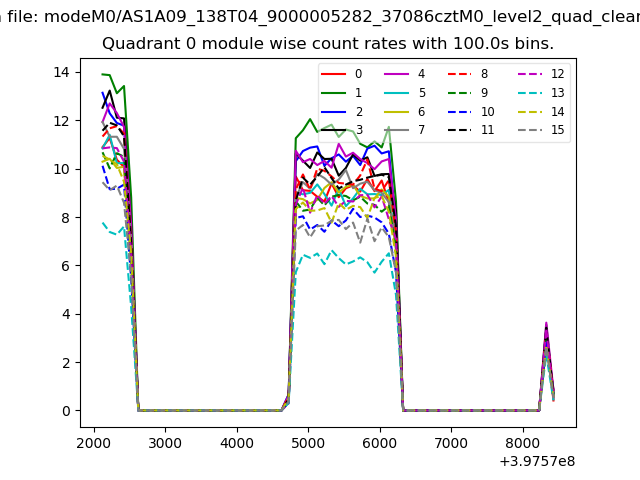 |
 |
| Module-wise count rates for Quadrant B Data is divided into 100 sec bins |
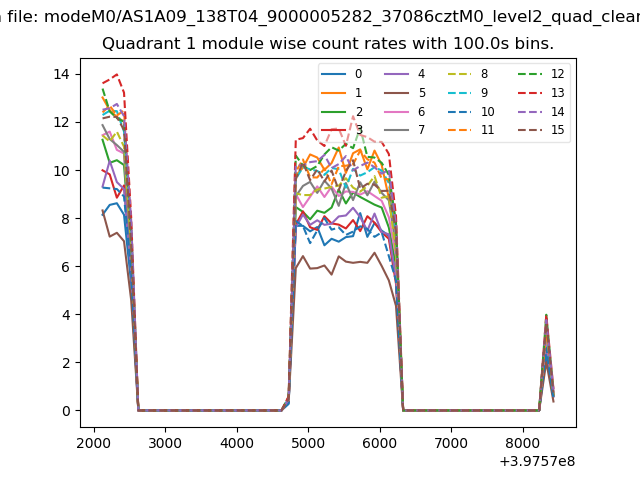 |
 |
| Module-wise count rates for Quadrant C Data is divided into 100 sec bins |
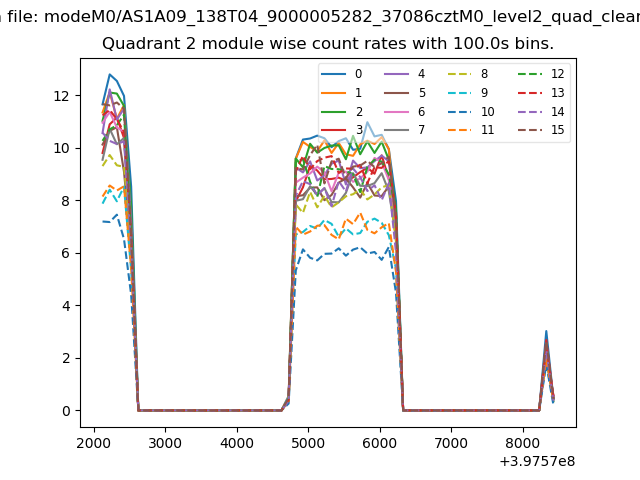 |
 |
| Module-wise count rates for Quadrant D Data is divided into 100 sec bins |
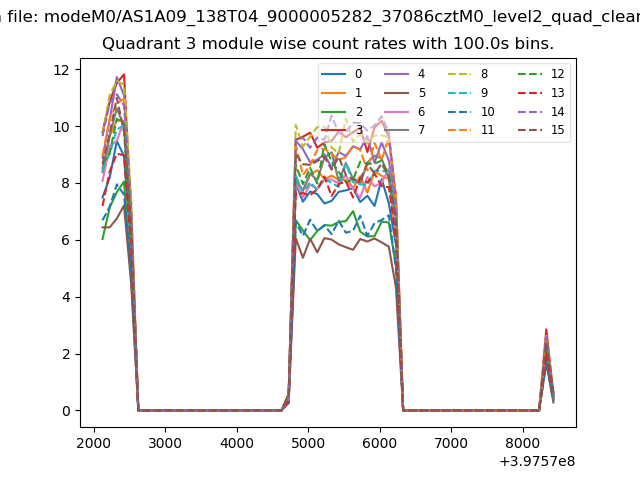 |
 |
| Parameter | Plot |
|---|---|
| CZT HV Monitor | 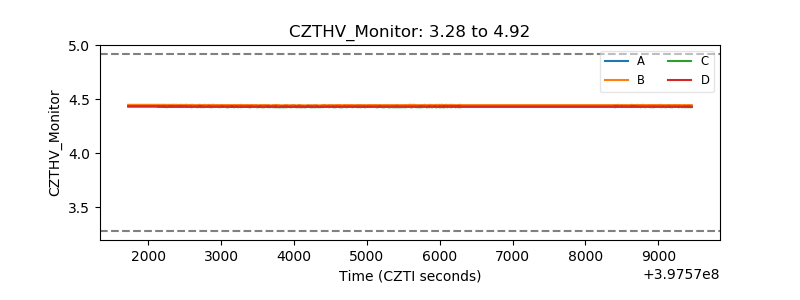 |
| D_VDD | 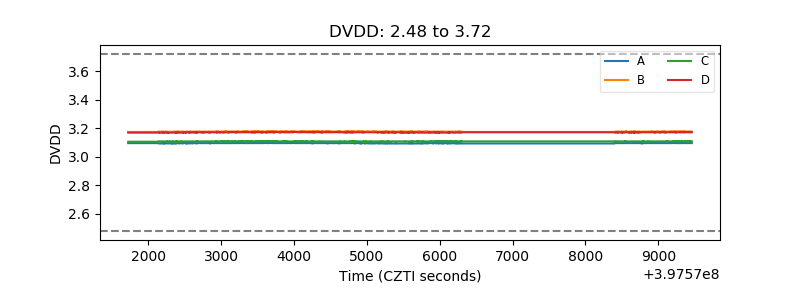 |
| Temperature 1 | 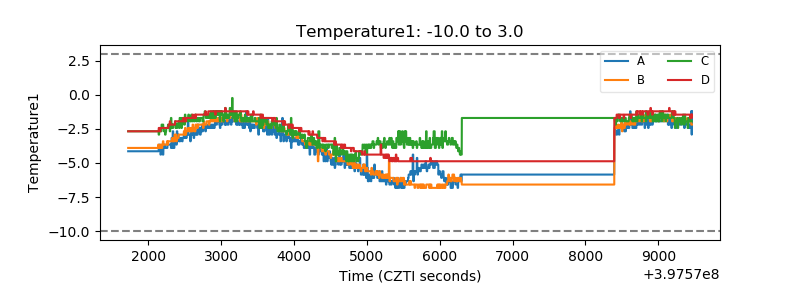 |
| Veto HV Monitor |  |
| Veto LLD | 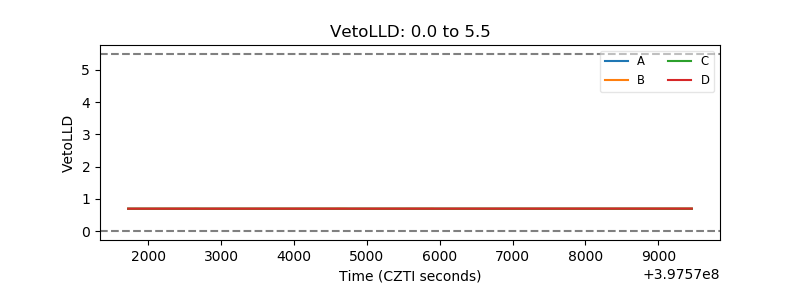 |
| Alpha Counter | 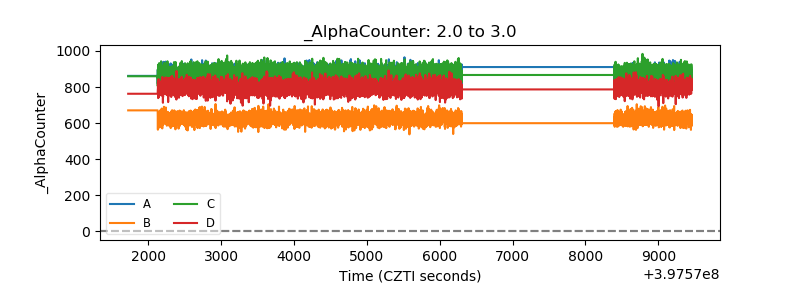 |
| _CPM_Rate |  |
| CZT Counter | 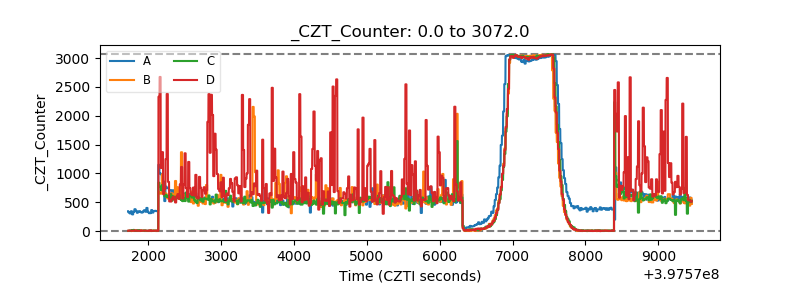 |
| +2.5 Volts monitor |  |
| +5 Volts monitor |  |
| _ROLL_ROT | 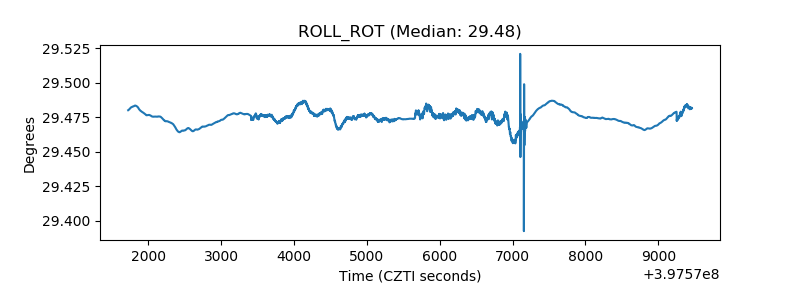 |
| _Roll_DEC |  |
| _Roll_RA |  |
| Veto Counter | 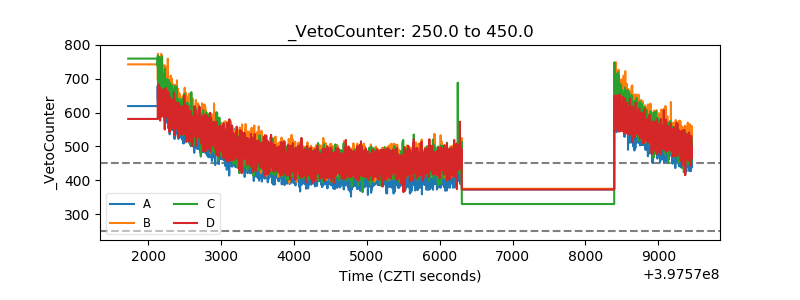 |