| Param | Original file | Final file |
|---|---|---|
| Filename | modeM0/AS1A09_138T04_9000005282_37087cztM0_level2.evt | modeM0/AS1A09_138T04_9000005282_37087cztM0_level2_quad_clean.evt |
| Size (bytes) | 437,627,520 | 47,410,560 |
| Size | 417.4 MB | 45.2 MB |
| Events in quadrant A | 2,948,211 | 277,651 |
| Events in quadrant B | 2,702,835 | 279,431 |
| Events in quadrant C | 3,291,327 | 264,422 |
| Events in quadrant D | 3,963,632 | 254,688 |
| Mode SS | |||
|---|---|---|---|
| Quadrant | BADHDUFLAG | Total packets | Discarded packets |
| A | 0 | 106 | 0 |
| B | 0 | 106 | 0 |
| C | 0 | 106 | 0 |
| D | 0 | 106 | 0 |
| Mode M0 | |||
|---|---|---|---|
| Quadrant | BADHDUFLAG | Total packets | Discarded packets |
| A | 0 | 11757 | 3 |
| B | 0 | 10844 | 2 |
| C | 0 | 12753 | 2 |
| D | 0 | 15127 | 2 |
| Mode M9 | |||
|---|---|---|---|
| Quadrant | BADHDUFLAG | Total packets | Discarded packets |
| A | 0 | 24 | 0 |
| B | 0 | 24 | 0 |
| C | 0 | 24 | 0 |
| D | 0 | 25 | 0 |
| Quadrant | Total seconds | Saturated seconds | Saturation percentage |
|---|---|---|---|
| A | 5116 | 24 | 0.469116% |
| B | 5116 | 12 | 0.234558% |
| C | 5116 | 133 | 2.599687% |
| D | 5116 | 281 | 5.492572% |
Noise dominated data is calculated using 1-second bins in cleaned event files. If a bin has >2000 counts, and if more than 50% of those come from <1% of pixels, then it is considered to be noise-dominated and hence unusable.
| Quadrant | # 1 sec bins | Bins with >0 counts | Bins with >2000 counts | High rate bins dominated by noise | Noise dominated (total time) | Noise dominated (detector-on time) | Marked lightcurve |
|---|---|---|---|---|---|---|---|
| A | 7239 | 5117 | 12 | 12 | 0.17% | 0.23% | 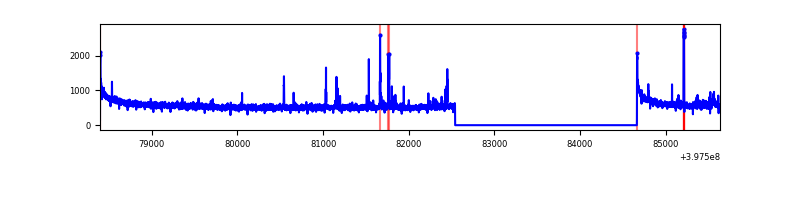 |
| B | 7239 | 5117 | 6 | 6 | 0.08% | 0.12% | 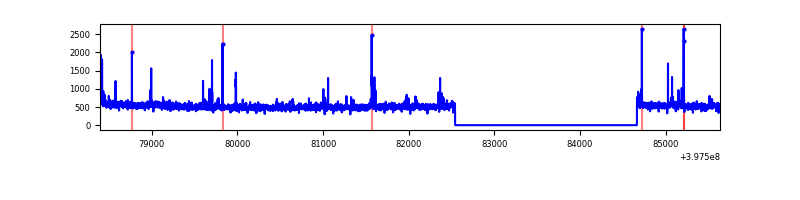 |
| C | 7239 | 5117 | 117 | 117 | 1.62% | 2.29% | 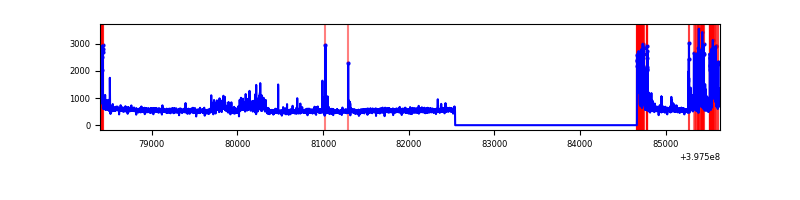 |
| D | 7239 | 5116 | 233 | 233 | 3.22% | 4.55% | 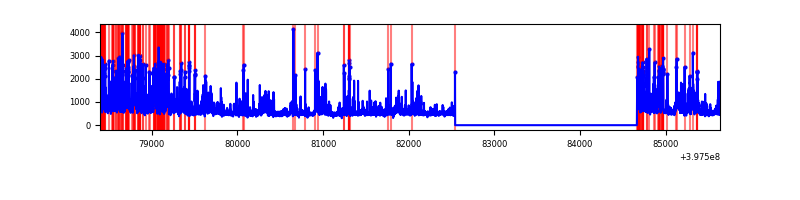 |
Top three noisy pixels from each quadrant. If the there are fewer than three noisy pixels in the level2.evt file, extra rows are filled as -1
| Pixel properties | Quadrant properties | ||||||
|---|---|---|---|---|---|---|---|
| Quadrant | DetID | PixID | Counts | Sigma | Mean | Median | Sigma |
| A | 10 | 83 | 271035 | 2031.87 | 664 | 653 | 133.1 |
| A | 7 | 3 | 50279 | 372.93 | 664 | 653 | 133.1 |
| A | 15 | 237 | 30396 | 223.51 | 664 | 653 | 133.1 |
| B | 5 | 172 | 31457 | 248.04 | 657 | 643 | 124.2 |
| B | 5 | 184 | 30619 | 241.29 | 657 | 643 | 124.2 |
| B | 0 | 182 | 17288 | 133.98 | 657 | 643 | 124.2 |
| C | 0 | 10 | 330576 | 2304.98 | 623 | 631 | 143.1 |
| C | 1 | 23 | 293803 | 2048.08 | 623 | 631 | 143.1 |
| C | 15 | 214 | 216604 | 1508.78 | 623 | 631 | 143.1 |
| D | 1 | 47 | 418647 | 2776.32 | 625 | 611 | 150.6 |
| D | 2 | 153 | 355586 | 2357.51 | 625 | 611 | 150.6 |
| D | 1 | 52 | 165459 | 1094.81 | 625 | 611 | 150.6 |
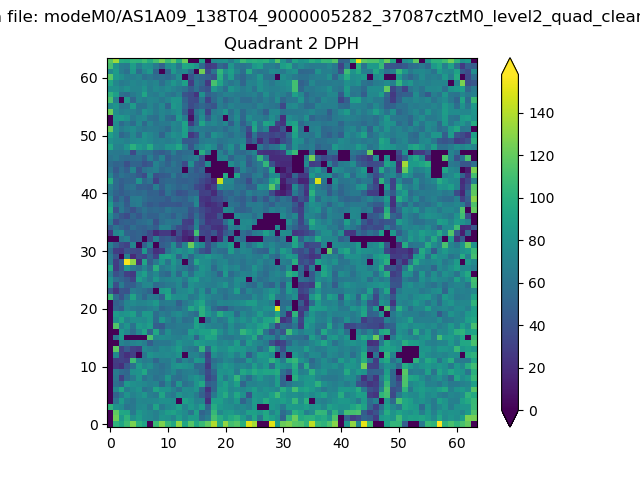
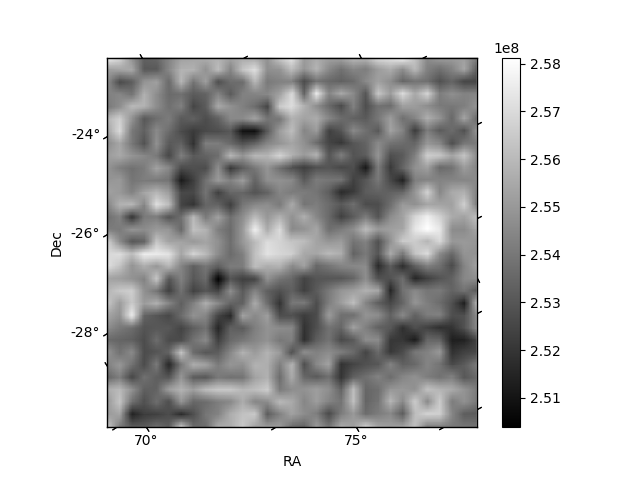
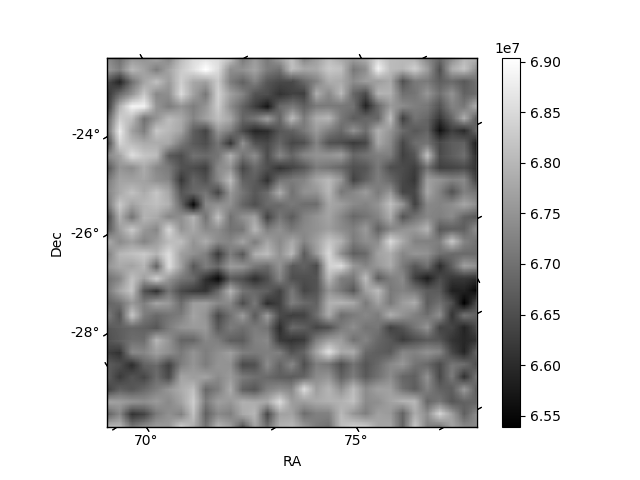
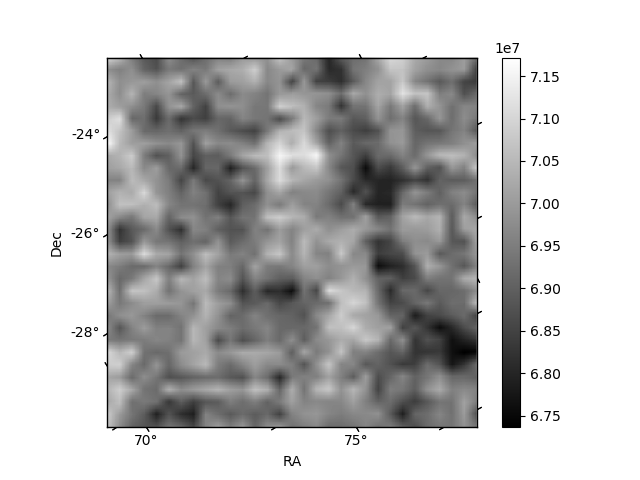
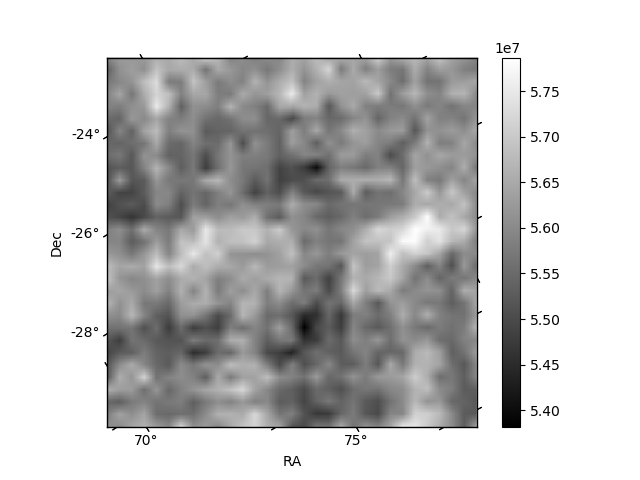
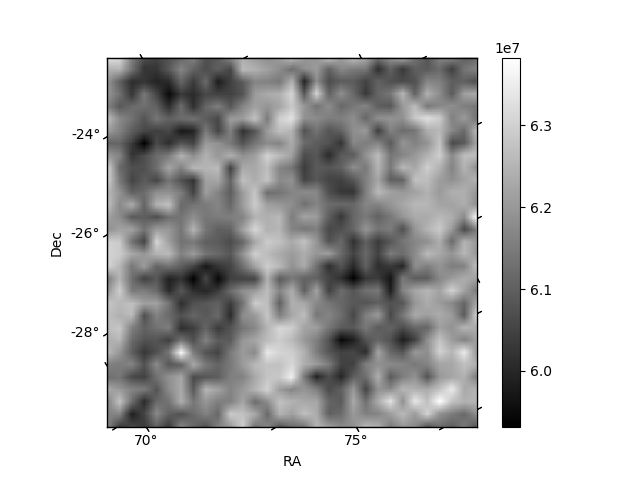
Histogram calculated using DETX and DETY for each event in the final _common_clean file
| Quadrant A | 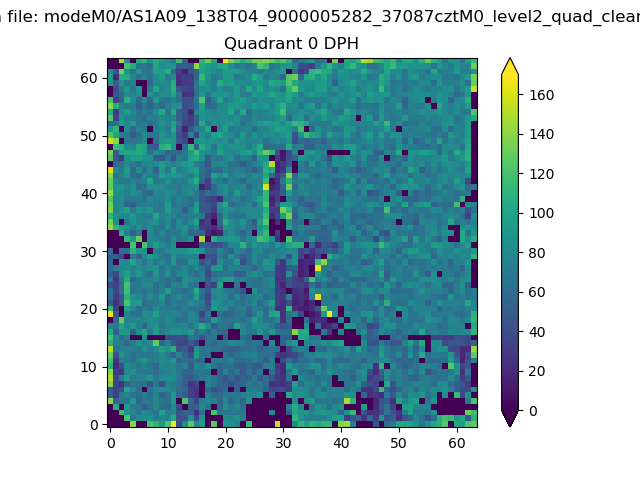 |
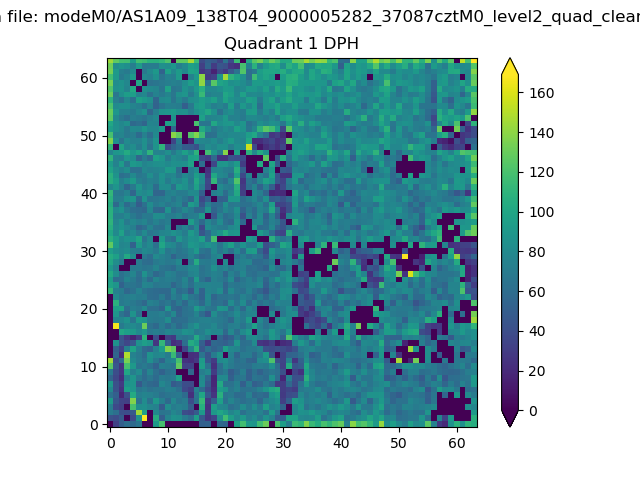 |
Quadrant B |
|---|---|---|---|
| Quadrant D | 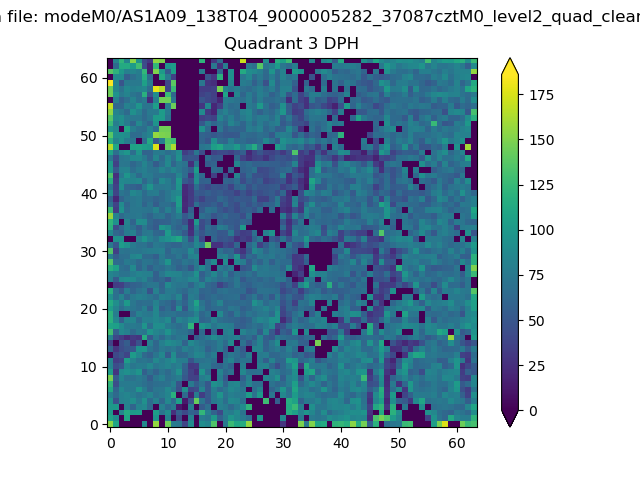 |
 |
Quadrant C |
| Plot type | Count rate plots | Images |
|---|---|---|
| Comparison with Poisson distribution Blue bars denote a histogram of data divided into 1 sec bins. Red curve is a Poisson curve with rate = median count rate of data. |
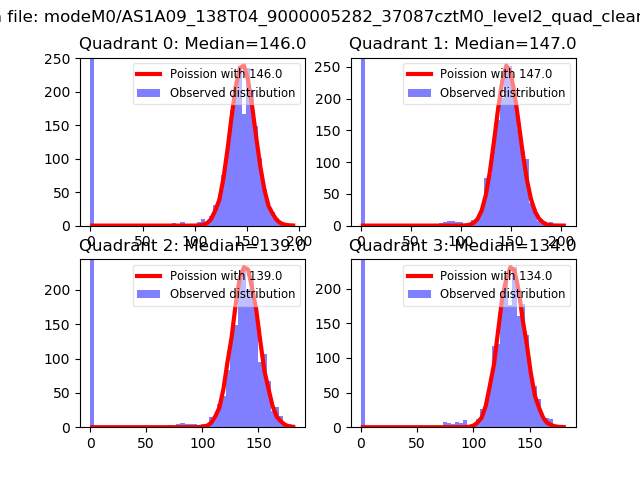 |
 |
| Quadrant-wise count rates Data is divided into 100 sec bins |
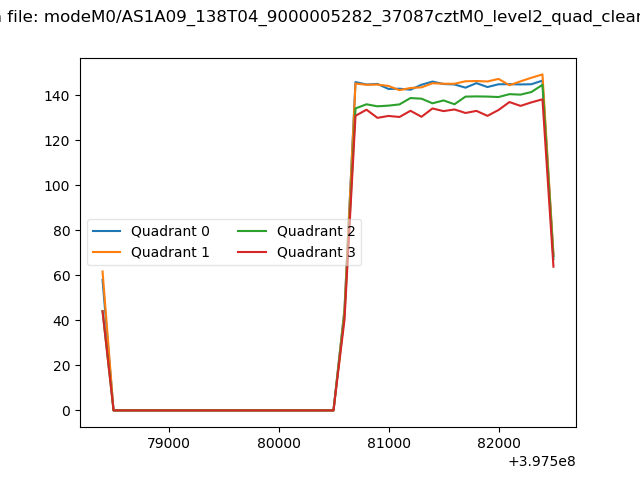 |
|
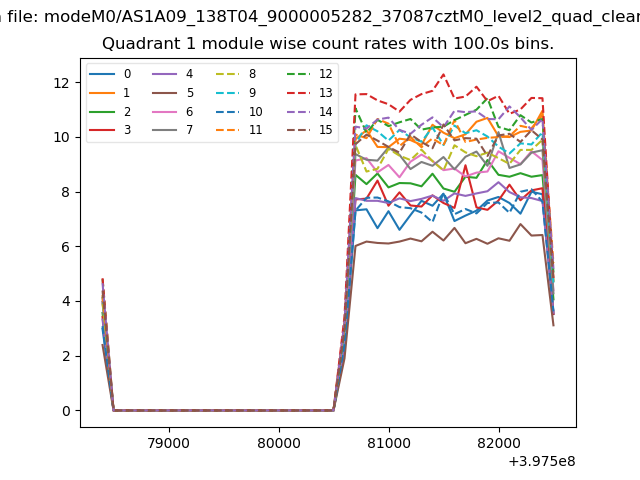
| Module-wise count rates for Quadrant A Data is divided into 100 sec bins |
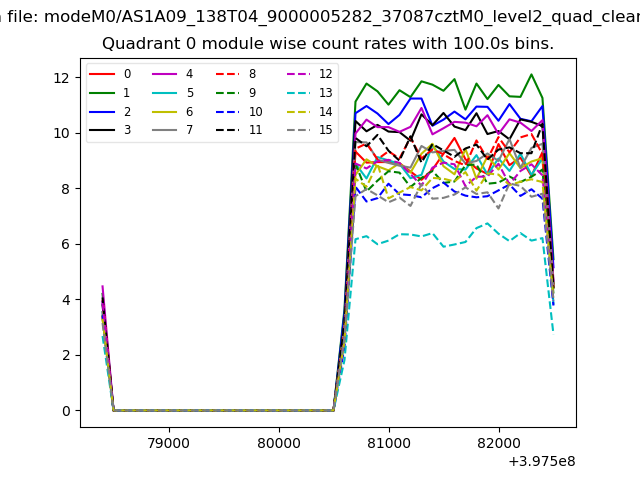 |
 |
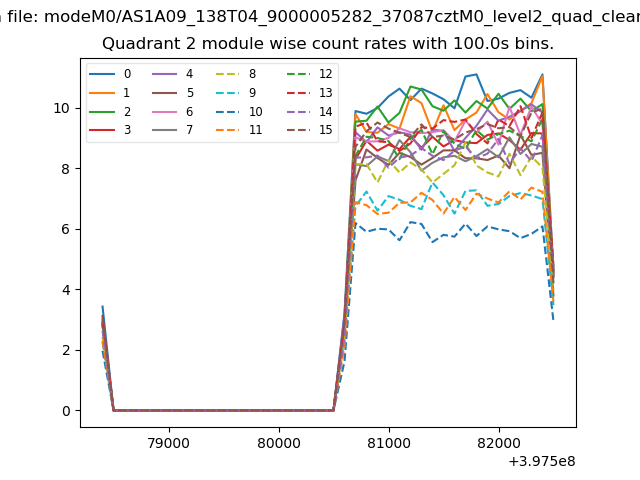
| Module-wise count rates for Quadrant B Data is divided into 100 sec bins |
 |
 |
| Module-wise count rates for Quadrant C Data is divided into 100 sec bins |
 |
 |
| Module-wise count rates for Quadrant D Data is divided into 100 sec bins |
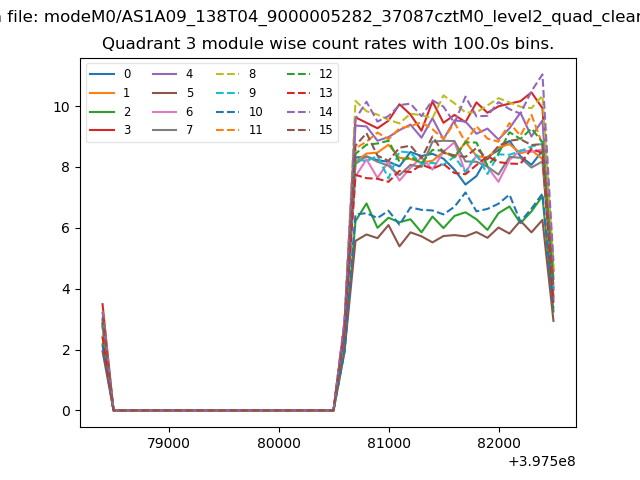 |
 |
| Parameter | Plot |
|---|---|
| CZT HV Monitor | 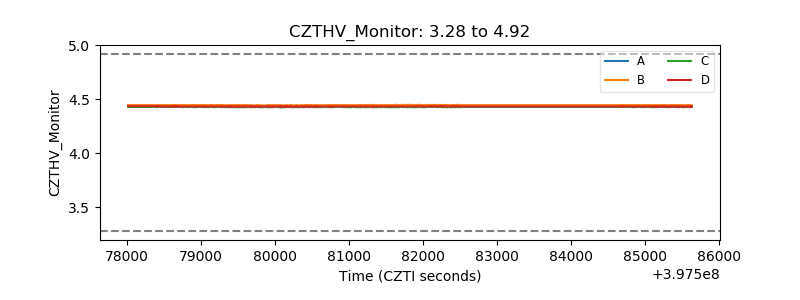 |
| D_VDD | 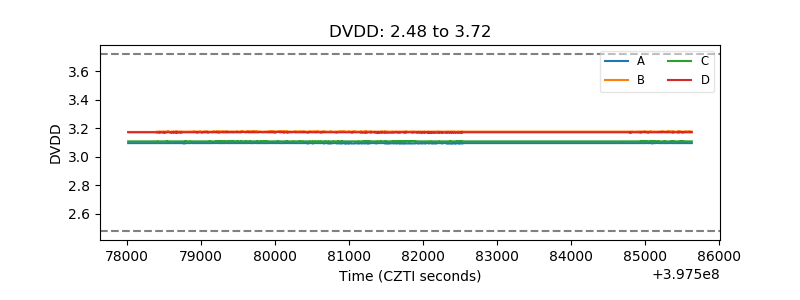 |
| Temperature 1 | 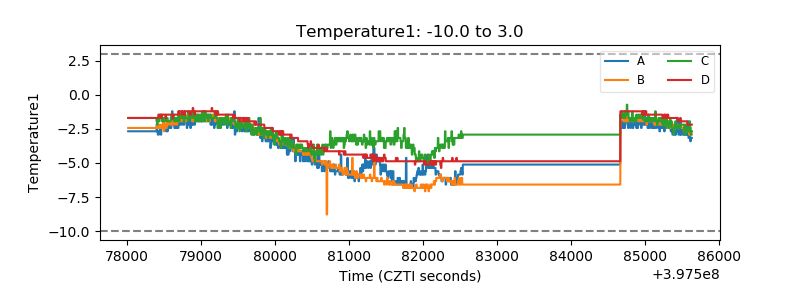 |
| Veto HV Monitor | 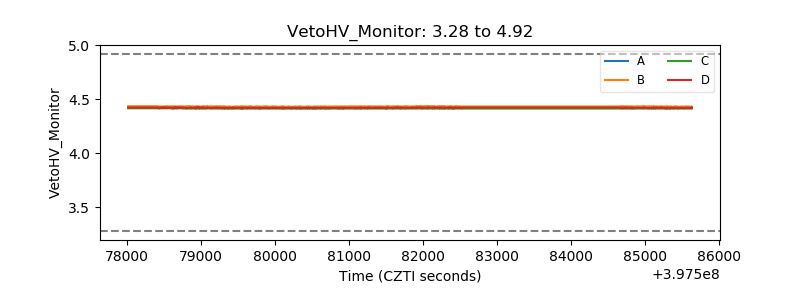 |
| Veto LLD | 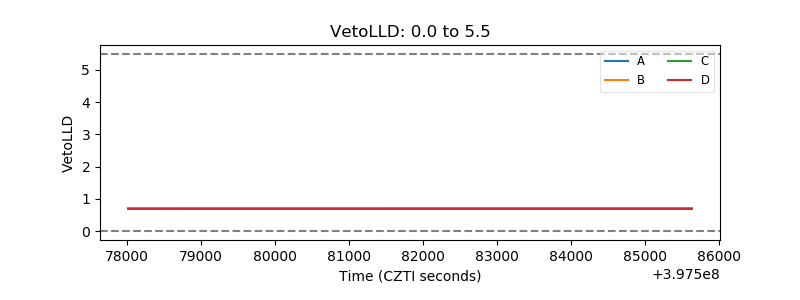 |
| Alpha Counter | 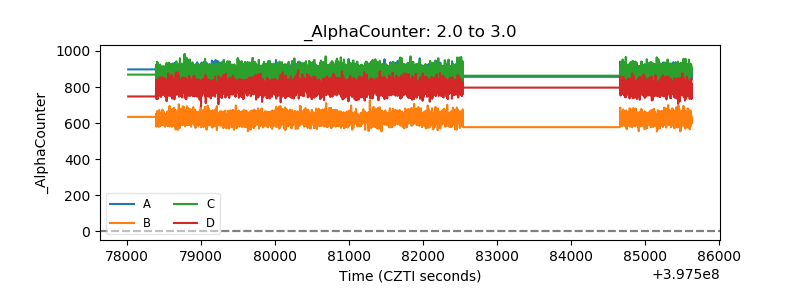 |
| _CPM_Rate | 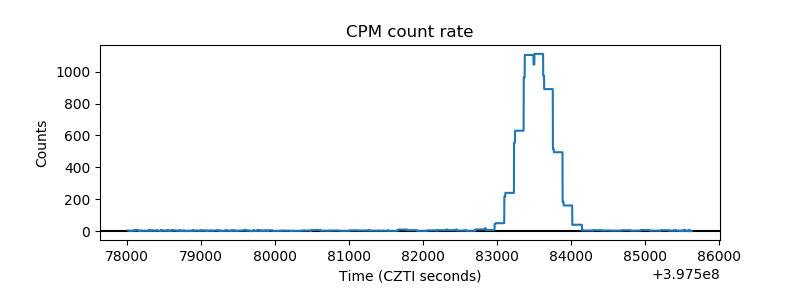 |
| CZT Counter |  |
| +2.5 Volts monitor | 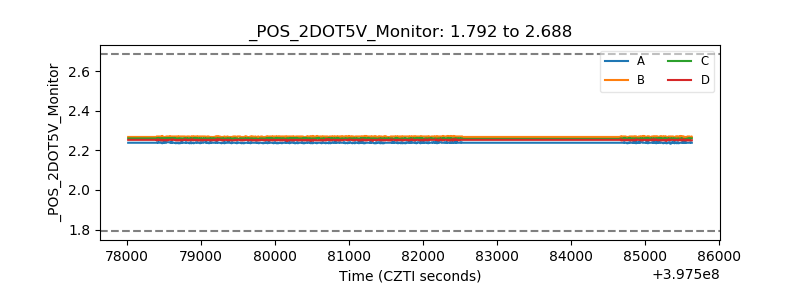 |
| +5 Volts monitor | 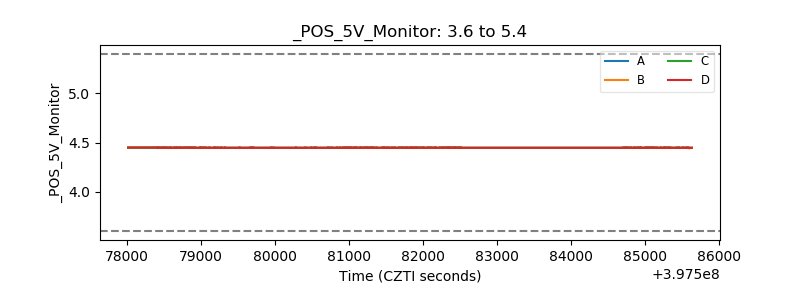 |
| _ROLL_ROT | 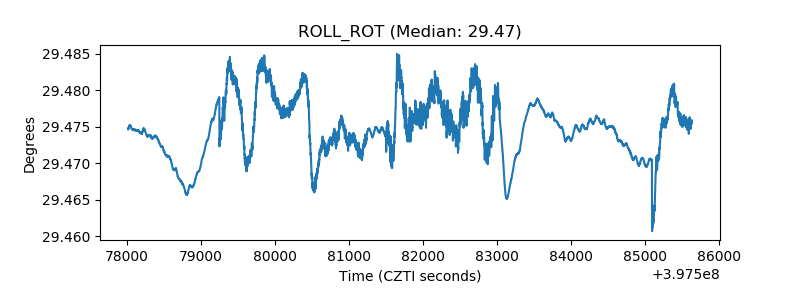 |
| _Roll_DEC | 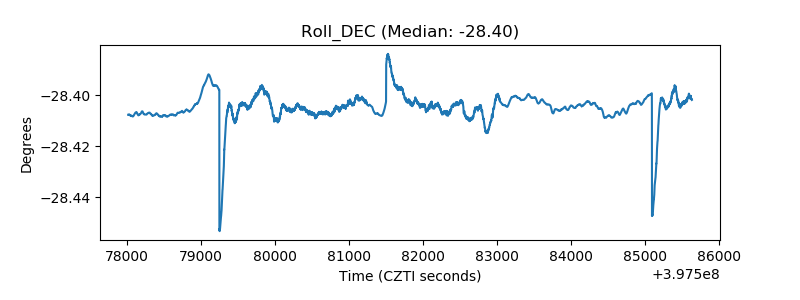 |
| _Roll_RA |  |
| Veto Counter | 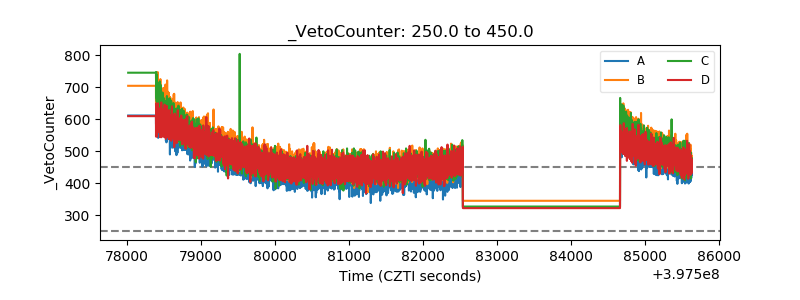 |