| Param | Original file | Final file |
|---|---|---|
| Filename | modeM0/AS1A09_138T04_9000005282_37088cztM0_level2.evt | modeM0/AS1A09_138T04_9000005282_37088cztM0_level2_quad_clean.evt |
| Size (bytes) | 422,320,320 | 53,343,360 |
| Size | 402.8 MB | 50.9 MB |
| Events in quadrant A | 2,868,988 | 327,484 |
| Events in quadrant B | 2,690,922 | 327,462 |
| Events in quadrant C | 3,614,104 | 310,946 |
| Events in quadrant D | 3,280,333 | 302,302 |
| Mode SS | |||
|---|---|---|---|
| Quadrant | BADHDUFLAG | Total packets | Discarded packets |
| A | 0 | 100 | 0 |
| B | 0 | 100 | 0 |
| C | 0 | 100 | 0 |
| D | 0 | 100 | 0 |
| Mode M0 | |||
|---|---|---|---|
| Quadrant | BADHDUFLAG | Total packets | Discarded packets |
| A | 0 | 11472 | 3 |
| B | 0 | 10869 | 2 |
| C | 0 | 13644 | 2 |
| D | 0 | 12958 | 2 |
| Mode M9 | |||
|---|---|---|---|
| Quadrant | BADHDUFLAG | Total packets | Discarded packets |
| A | 0 | 23 | 0 |
| B | 0 | 23 | 0 |
| C | 0 | 23 | 0 |
| D | 0 | 24 | 0 |
| Quadrant | Total seconds | Saturated seconds | Saturation percentage |
|---|---|---|---|
| A | 4945 | 48 | 0.970677% |
| B | 4945 | 44 | 0.889788% |
| C | 4945 | 257 | 5.197169% |
| D | 4945 | 139 | 2.810920% |
Noise dominated data is calculated using 1-second bins in cleaned event files. If a bin has >2000 counts, and if more than 50% of those come from <1% of pixels, then it is considered to be noise-dominated and hence unusable.
| Quadrant | # 1 sec bins | Bins with >0 counts | Bins with >2000 counts | High rate bins dominated by noise | Noise dominated (total time) | Noise dominated (detector-on time) | Marked lightcurve |
|---|---|---|---|---|---|---|---|
| A | 7038 | 4946 | 25 | 25 | 0.36% | 0.51% | 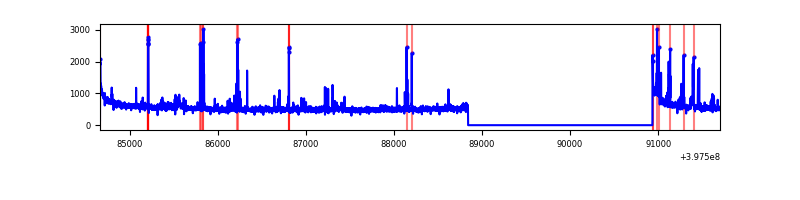 |
| B | 7038 | 4946 | 32 | 32 | 0.45% | 0.65% | 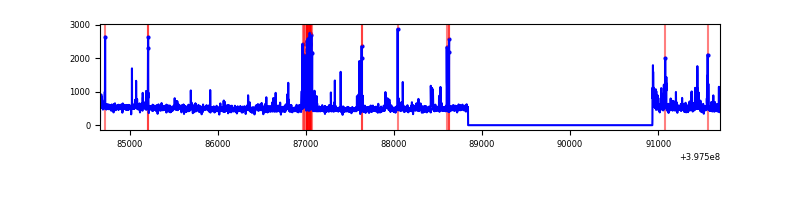 |
| C | 7038 | 4946 | 248 | 248 | 3.52% | 5.01% | 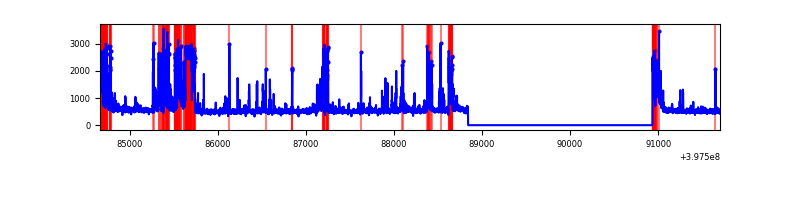 |
| D | 7038 | 4946 | 118 | 118 | 1.68% | 2.39% | 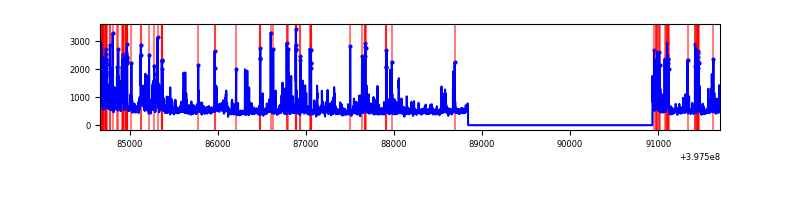 |
Top three noisy pixels from each quadrant. If the there are fewer than three noisy pixels in the level2.evt file, extra rows are filled as -1
| Pixel properties | Quadrant properties | ||||||
|---|---|---|---|---|---|---|---|
| Quadrant | DetID | PixID | Counts | Sigma | Mean | Median | Sigma |
| A | 10 | 83 | 260558 | 2114.63 | 614 | 604 | 122.9 |
| A | 15 | 237 | 145029 | 1174.84 | 614 | 604 | 122.9 |
| A | 7 | 3 | 59480 | 478.93 | 614 | 604 | 122.9 |
| B | 5 | 172 | 165459 | 1432.79 | 608 | 595 | 115.1 |
| B | 5 | 184 | 43048 | 368.95 | 608 | 595 | 115.1 |
| B | 5 | 255 | 22670 | 191.85 | 608 | 595 | 115.1 |
| C | 1 | 23 | 553303 | 4117.23 | 576 | 579 | 134.2 |
| C | 0 | 10 | 331959 | 2468.44 | 576 | 579 | 134.2 |
| C | 15 | 208 | 256583 | 1906.97 | 576 | 579 | 134.2 |
| D | 1 | 47 | 222001 | 1555.6 | 588 | 573 | 142.3 |
| D | 2 | 153 | 215852 | 1512.4 | 588 | 573 | 142.3 |
| D | 13 | 171 | 127356 | 890.69 | 588 | 573 | 142.3 |
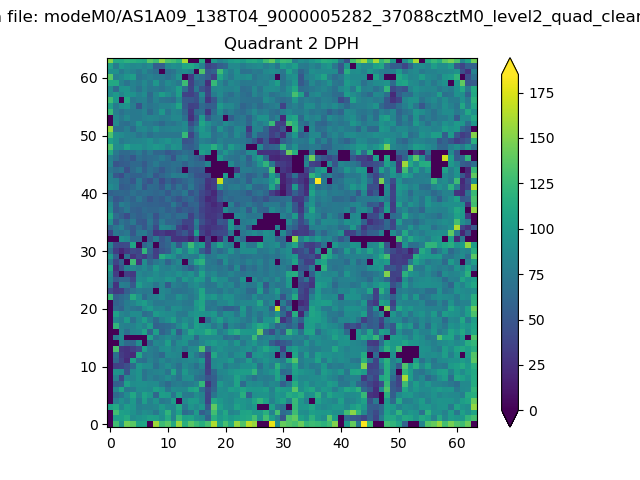
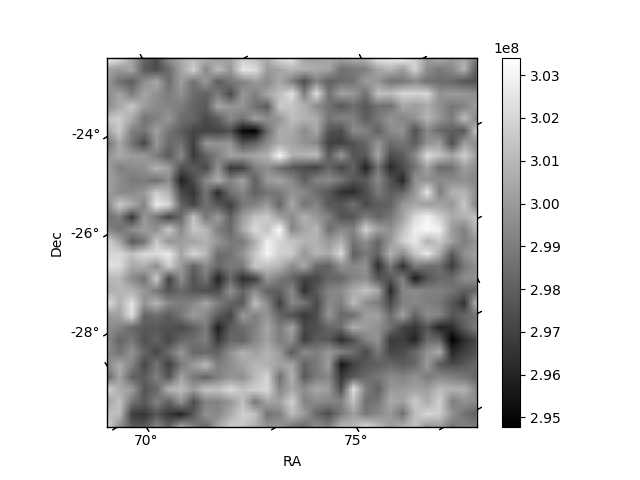
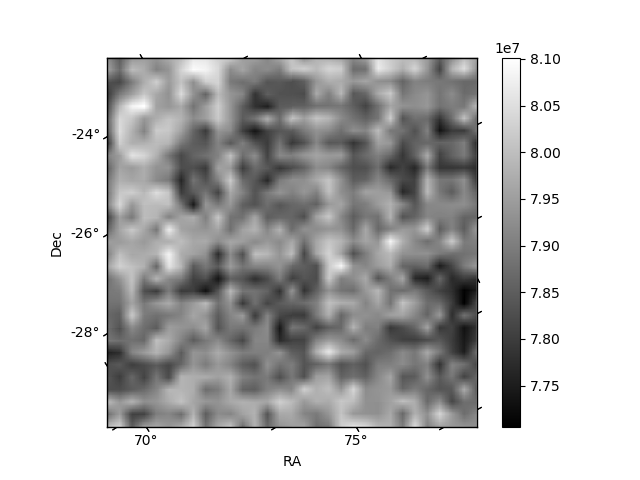
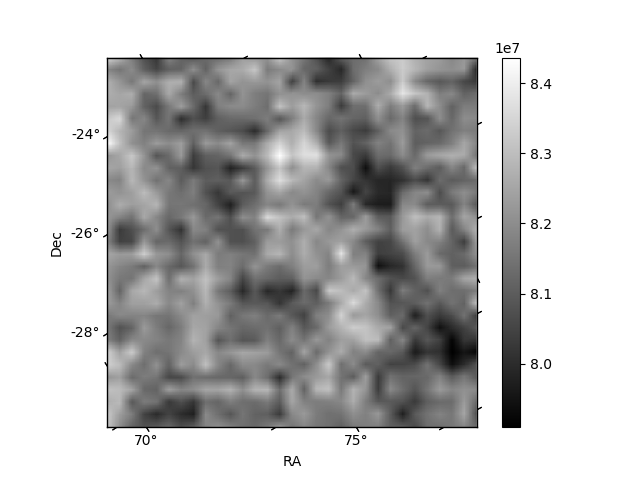
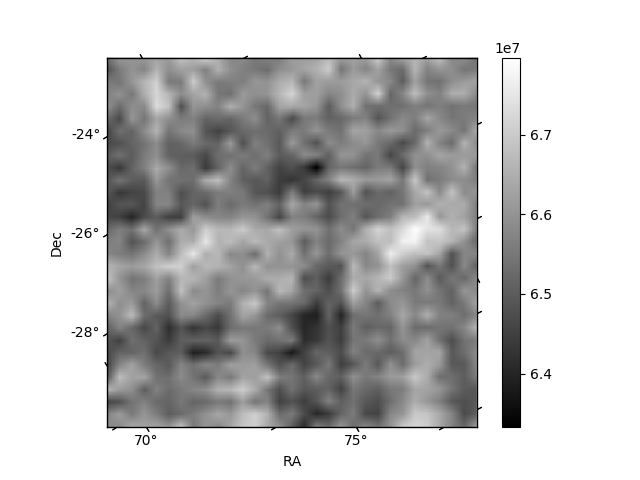
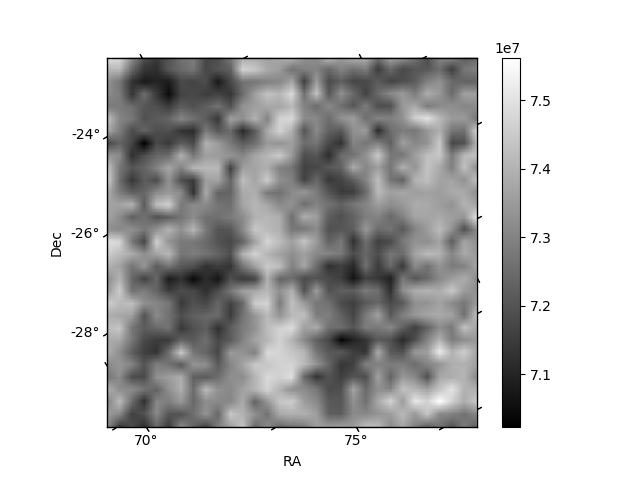
Histogram calculated using DETX and DETY for each event in the final _common_clean file
| Quadrant A | 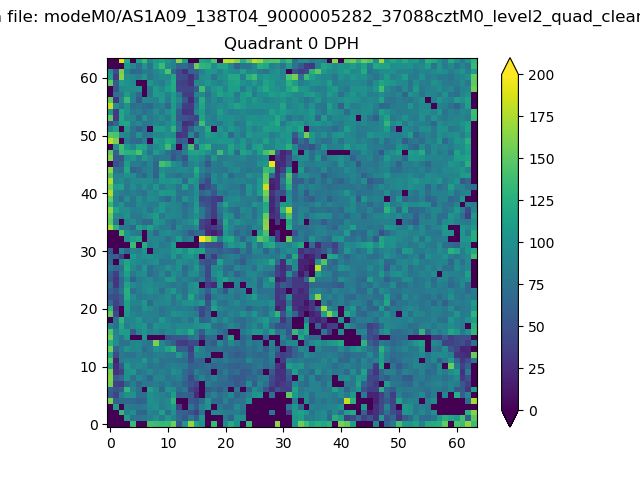 |
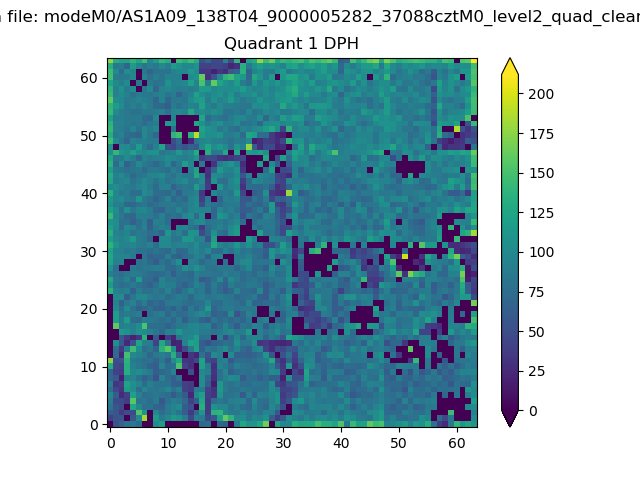 |
Quadrant B |
|---|---|---|---|
| Quadrant D | 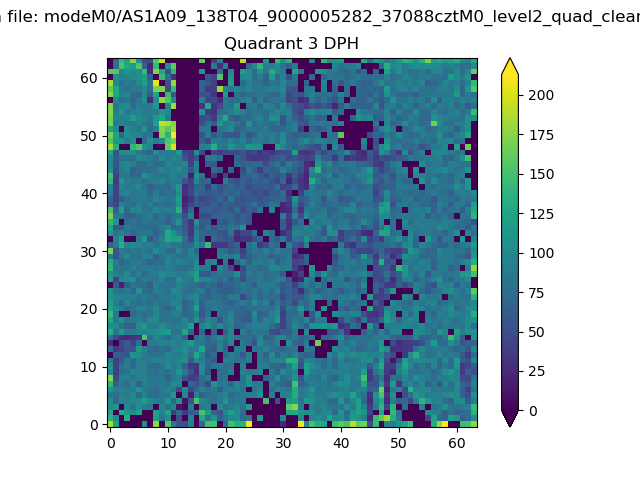 |
 |
Quadrant C |
| Plot type | Count rate plots | Images |
|---|---|---|
| Comparison with Poisson distribution Blue bars denote a histogram of data divided into 1 sec bins. Red curve is a Poisson curve with rate = median count rate of data. |
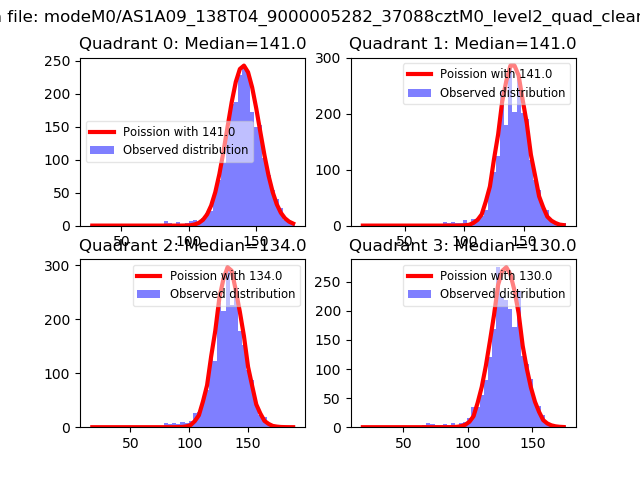 |
 |
| Quadrant-wise count rates Data is divided into 100 sec bins |
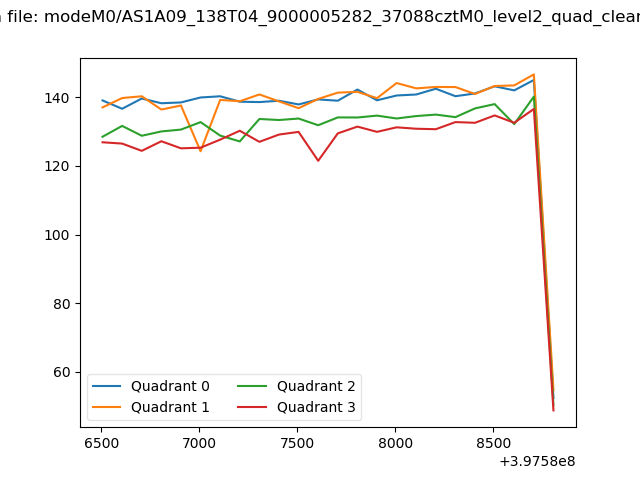 |
|
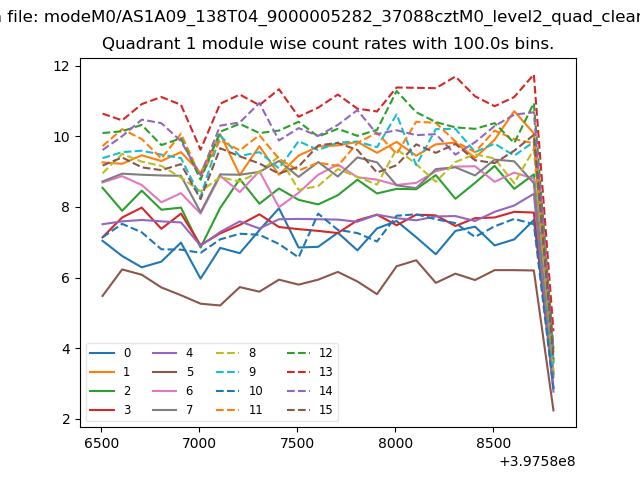
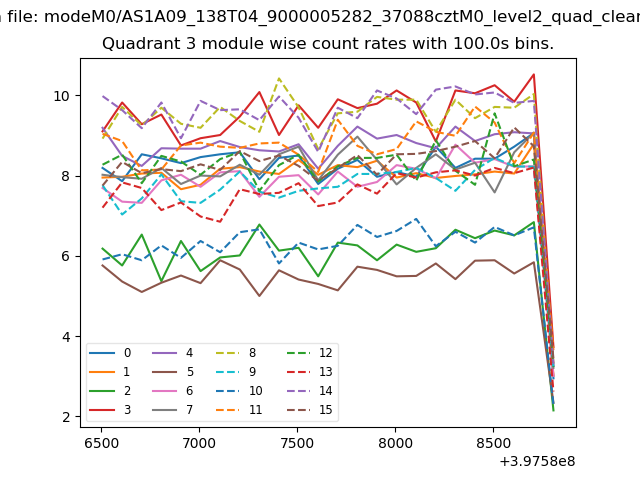
| Module-wise count rates for Quadrant A Data is divided into 100 sec bins |
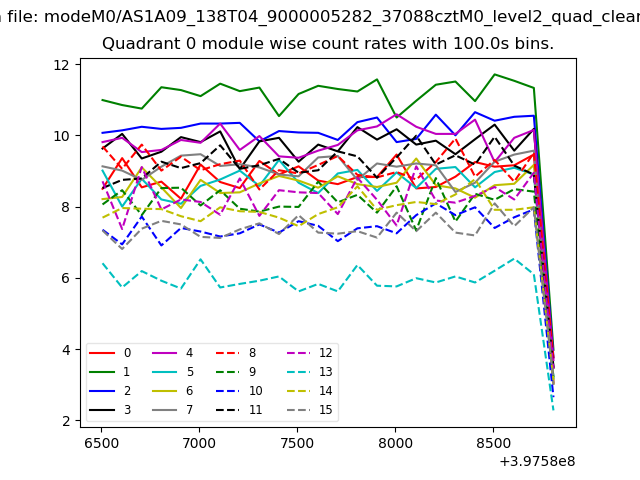 |
 |
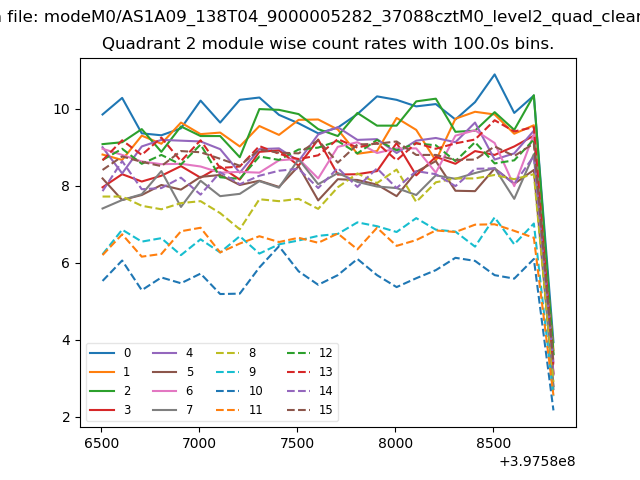
| Module-wise count rates for Quadrant B Data is divided into 100 sec bins |
 |
 |
| Module-wise count rates for Quadrant C Data is divided into 100 sec bins |
 |
 |
| Module-wise count rates for Quadrant D Data is divided into 100 sec bins |
 |
 |
| Parameter | Plot |
|---|---|
| CZT HV Monitor | 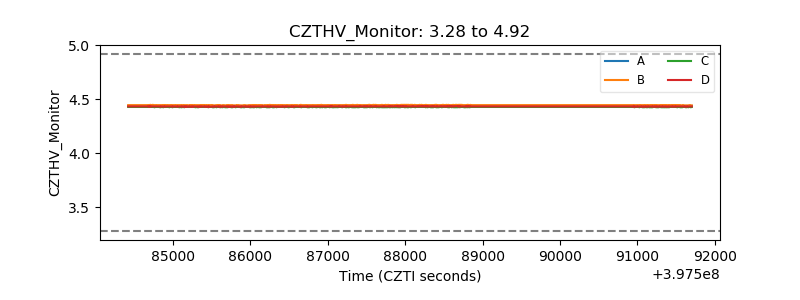 |
| D_VDD | 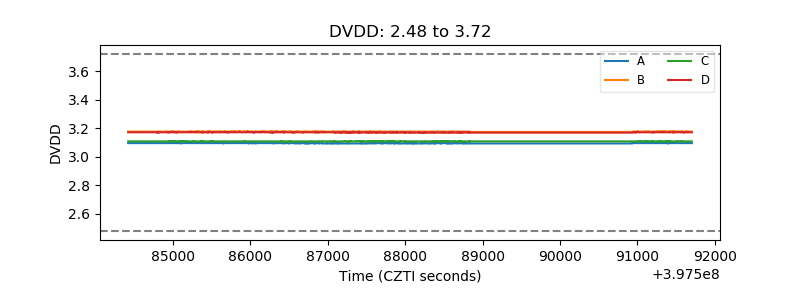 |
| Temperature 1 | 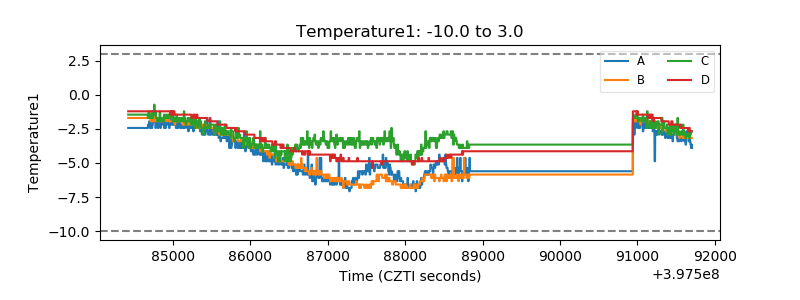 |
| Veto HV Monitor | 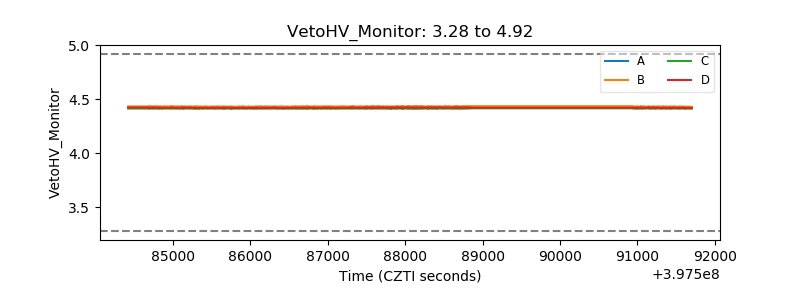 |
| Veto LLD | 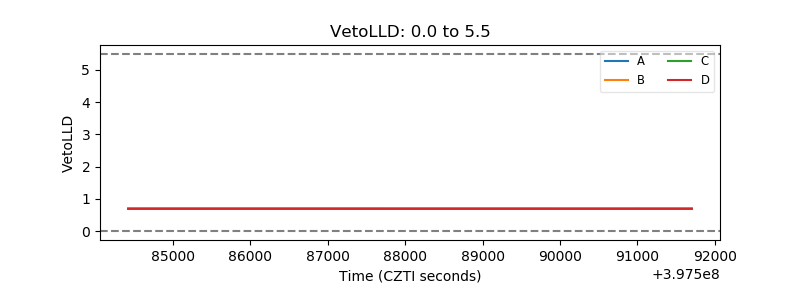 |
| Alpha Counter | 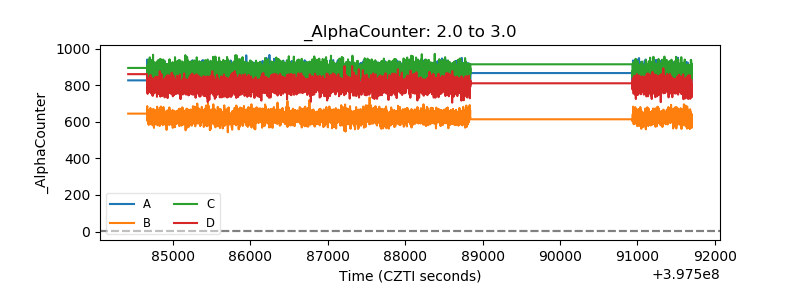 |
| _CPM_Rate | 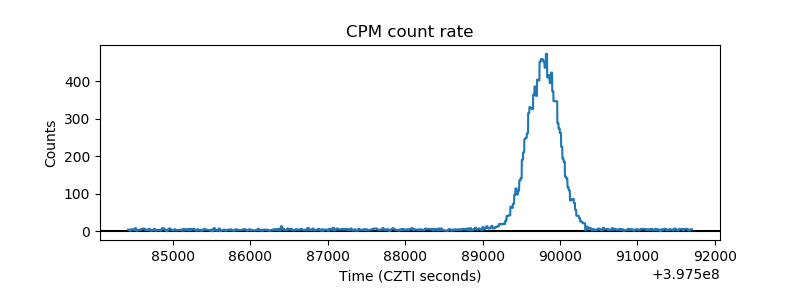 |
| CZT Counter | 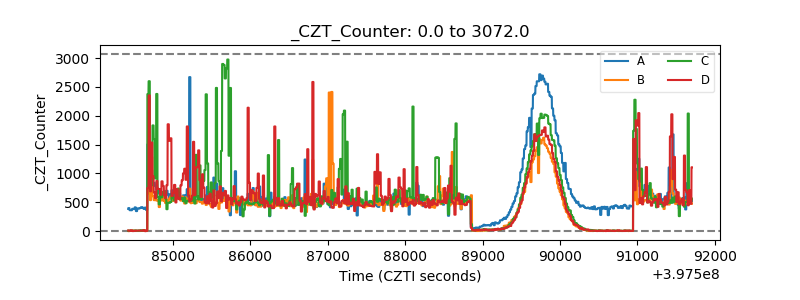 |
| +2.5 Volts monitor | 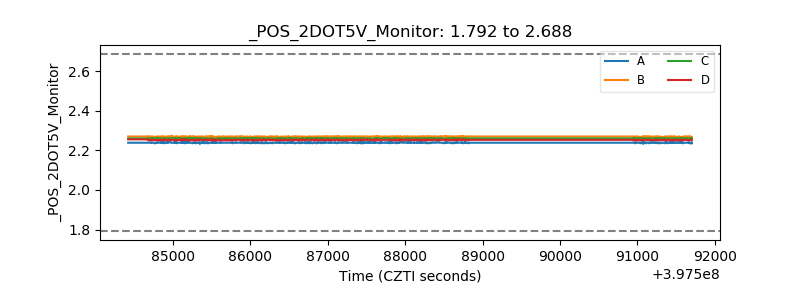 |
| +5 Volts monitor | 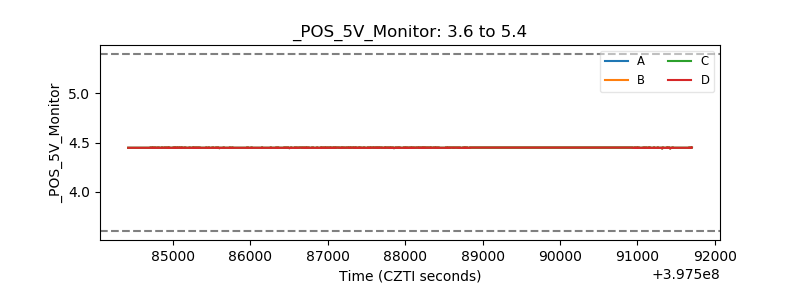 |
| _ROLL_ROT | 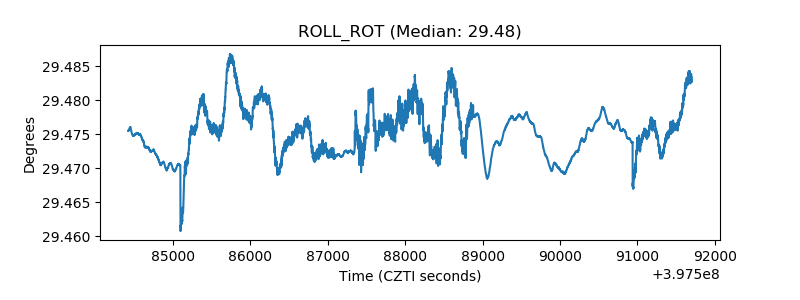 |
| _Roll_DEC | 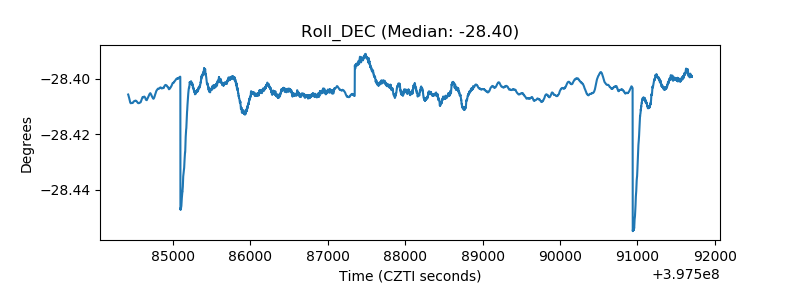 |
| _Roll_RA | 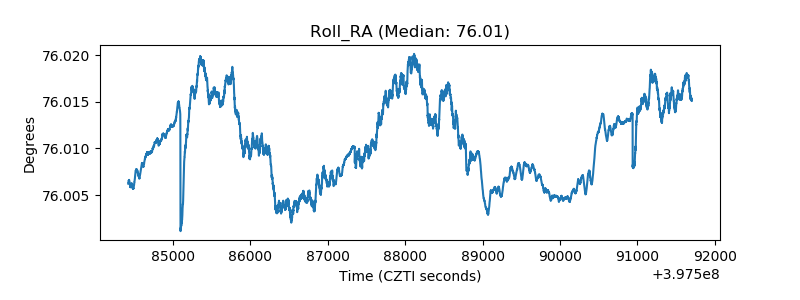 |
| Veto Counter | 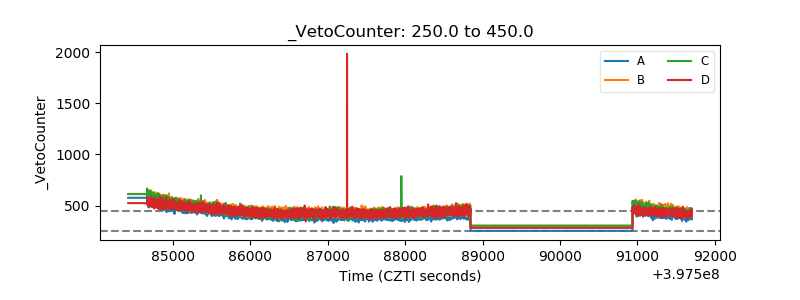 |