| Param | Original file | Final file |
|---|---|---|
| Filename | modeM0/AS1A09_138T04_9000005282_37089cztM0_level2.evt | modeM0/AS1A09_138T04_9000005282_37089cztM0_level2_quad_clean.evt |
| Size (bytes) | 416,370,240 | 62,314,560 |
| Size | 397.1 MB | 59.4 MB |
| Events in quadrant A | 2,861,477 | 392,732 |
| Events in quadrant B | 3,312,736 | 389,181 |
| Events in quadrant C | 2,834,389 | 379,805 |
| Events in quadrant D | 3,249,160 | 361,992 |
| Mode SS | |||
|---|---|---|---|
| Quadrant | BADHDUFLAG | Total packets | Discarded packets |
| A | 0 | 106 | 0 |
| B | 0 | 106 | 0 |
| C | 0 | 106 | 0 |
| D | 0 | 106 | 0 |
| Mode M0 | |||
|---|---|---|---|
| Quadrant | BADHDUFLAG | Total packets | Discarded packets |
| A | 0 | 11646 | 3 |
| B | 0 | 13079 | 2 |
| C | 0 | 11334 | 2 |
| D | 0 | 13070 | 2 |
| Mode M9 | |||
|---|---|---|---|
| Quadrant | BADHDUFLAG | Total packets | Discarded packets |
| A | 0 | 31 | 0 |
| B | 0 | 31 | 0 |
| C | 0 | 31 | 0 |
| D | 0 | 32 | 0 |
| Quadrant | Total seconds | Saturated seconds | Saturation percentage |
|---|---|---|---|
| A | 5179 | 59 | 1.139216% |
| B | 5179 | 283 | 5.464375% |
| C | 5179 | 51 | 0.984746% |
| D | 5179 | 158 | 3.050782% |
Noise dominated data is calculated using 1-second bins in cleaned event files. If a bin has >2000 counts, and if more than 50% of those come from <1% of pixels, then it is considered to be noise-dominated and hence unusable.
| Quadrant | # 1 sec bins | Bins with >0 counts | Bins with >2000 counts | High rate bins dominated by noise | Noise dominated (total time) | Noise dominated (detector-on time) | Marked lightcurve |
|---|---|---|---|---|---|---|---|
| A | 7092 | 5180 | 32 | 32 | 0.45% | 0.62% | 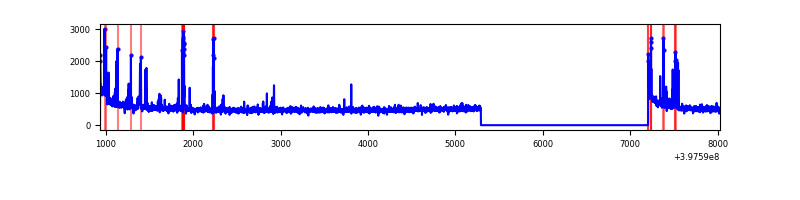 |
| B | 7092 | 5180 | 206 | 206 | 2.90% | 3.98% | 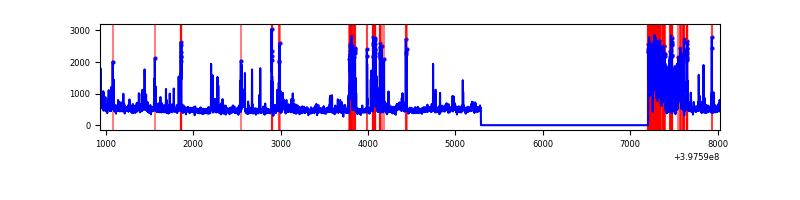 |
| C | 7092 | 5180 | 43 | 43 | 0.61% | 0.83% | 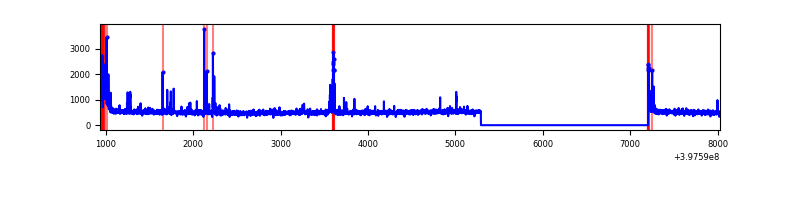 |
| D | 7092 | 5180 | 157 | 157 | 2.21% | 3.03% | 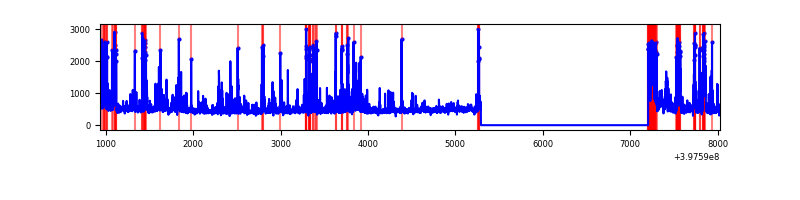 |
Top three noisy pixels from each quadrant. If the there are fewer than three noisy pixels in the level2.evt file, extra rows are filled as -1
| Pixel properties | Quadrant properties | ||||||
|---|---|---|---|---|---|---|---|
| Quadrant | DetID | PixID | Counts | Sigma | Mean | Median | Sigma |
| A | 10 | 83 | 262211 | 2100.54 | 614 | 602 | 124.5 |
| A | 15 | 237 | 146117 | 1168.39 | 614 | 602 | 124.5 |
| A | 13 | 248 | 52636 | 417.8 | 614 | 602 | 124.5 |
| B | 5 | 172 | 486906 | 4237.36 | 601 | 586 | 114.8 |
| B | 5 | 184 | 335029 | 2914.04 | 601 | 586 | 114.8 |
| B | 0 | 182 | 35706 | 306.0 | 601 | 586 | 114.8 |
| C | 15 | 214 | 221700 | 1606.45 | 593 | 597 | 137.6 |
| C | 0 | 10 | 172897 | 1251.87 | 593 | 597 | 137.6 |
| C | 1 | 23 | 60456 | 434.91 | 593 | 597 | 137.6 |
| D | 2 | 153 | 197648 | 1370.04 | 589 | 572 | 143.8 |
| D | 2 | 250 | 161476 | 1118.58 | 589 | 572 | 143.8 |
| D | 13 | 171 | 130707 | 904.68 | 589 | 572 | 143.8 |
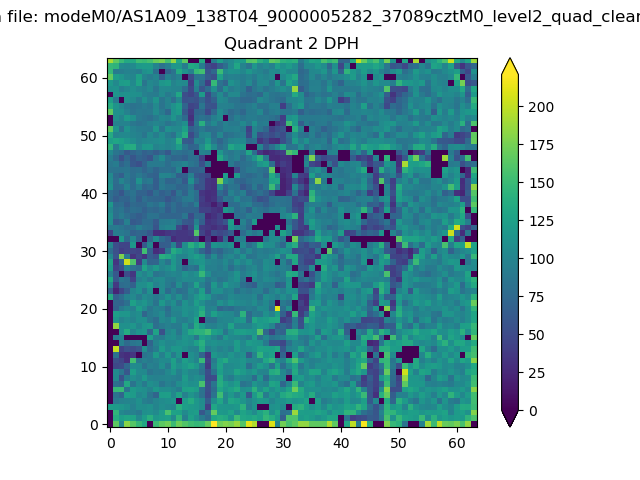
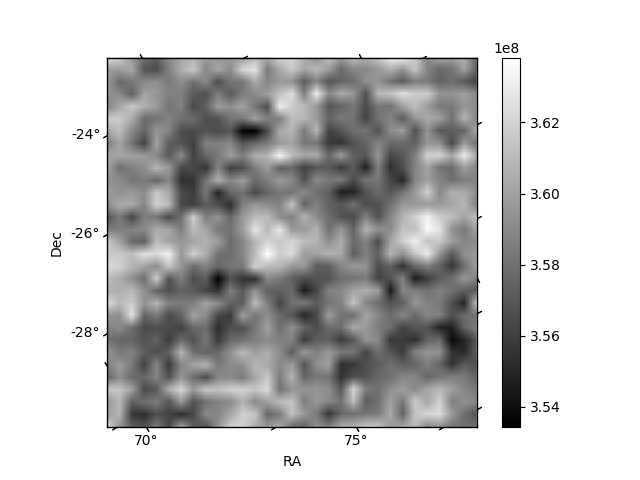
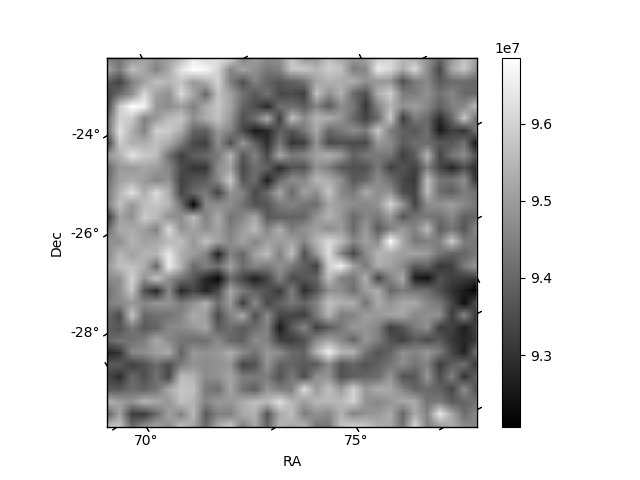
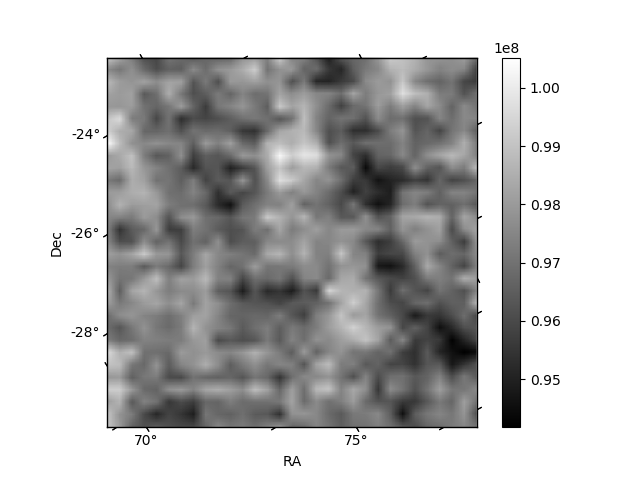
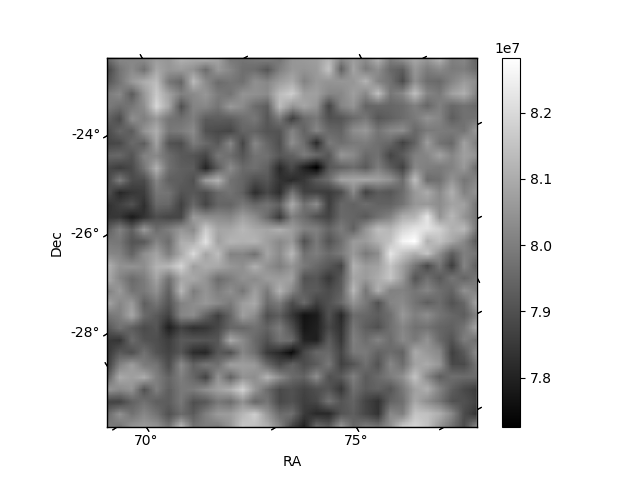
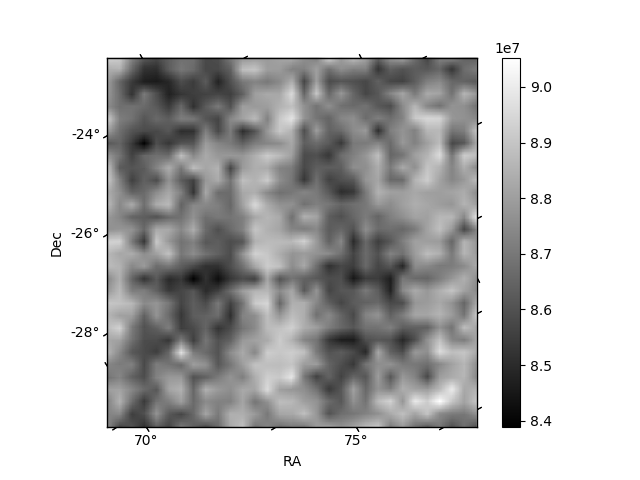
Histogram calculated using DETX and DETY for each event in the final _common_clean file
| Quadrant A | 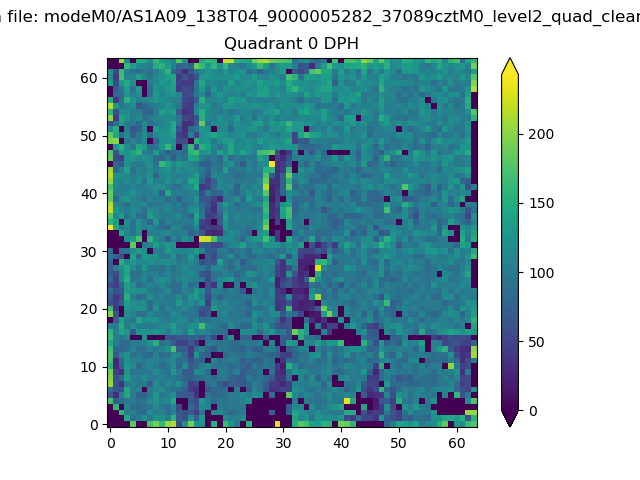 |
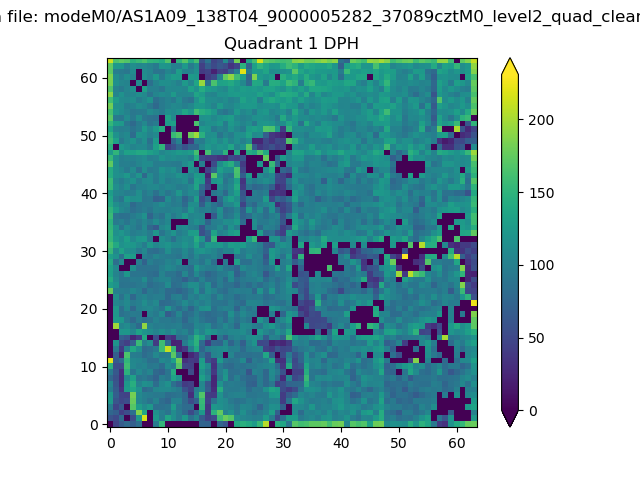 |
Quadrant B |
|---|---|---|---|
| Quadrant D | 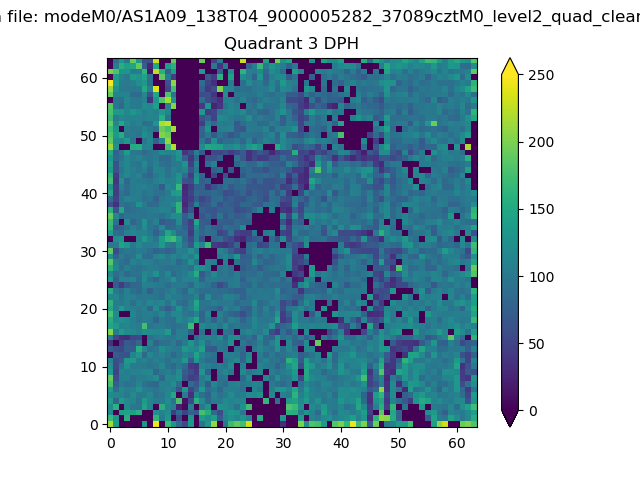 |
 |
Quadrant C |
| Plot type | Count rate plots | Images |
|---|---|---|
| Comparison with Poisson distribution Blue bars denote a histogram of data divided into 1 sec bins. Red curve is a Poisson curve with rate = median count rate of data. |
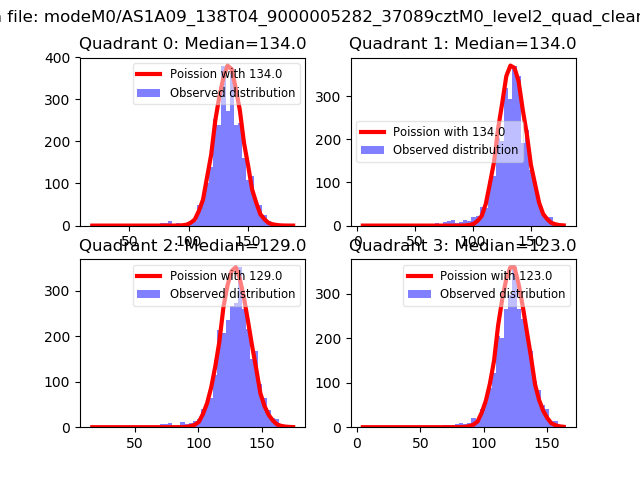 |
 |
| Quadrant-wise count rates Data is divided into 100 sec bins |
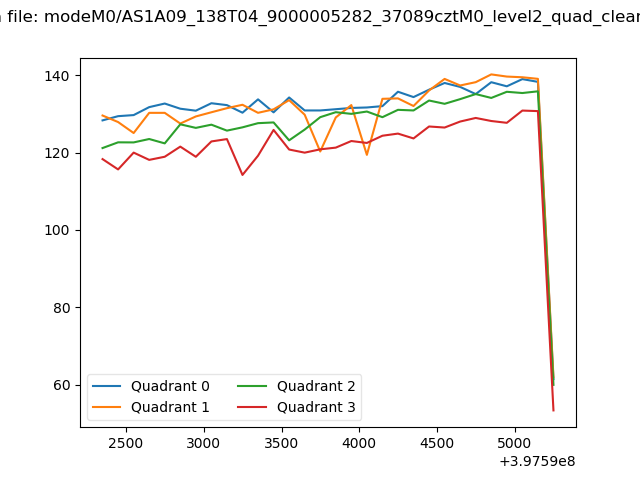 |
|
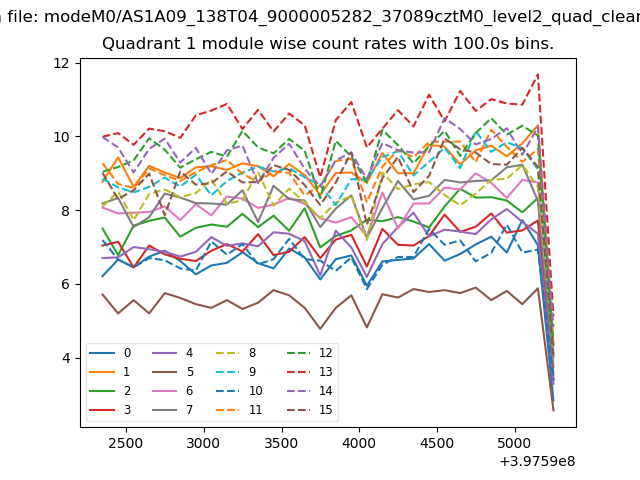
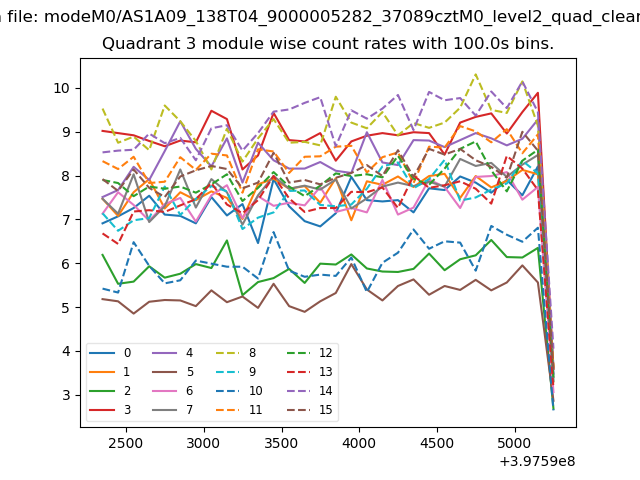
| Module-wise count rates for Quadrant A Data is divided into 100 sec bins |
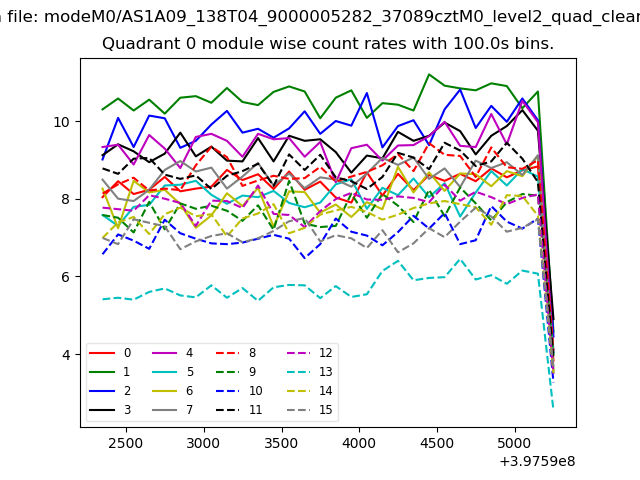 |
 |
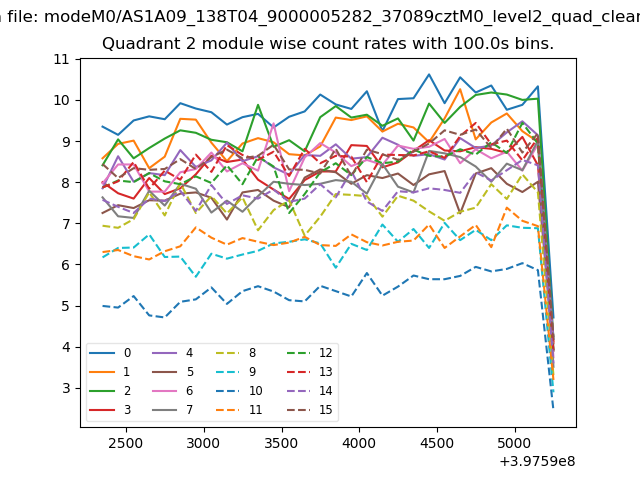
| Module-wise count rates for Quadrant B Data is divided into 100 sec bins |
 |
 |
| Module-wise count rates for Quadrant C Data is divided into 100 sec bins |
 |
 |
| Module-wise count rates for Quadrant D Data is divided into 100 sec bins |
 |
 |
| Parameter | Plot |
|---|---|
| CZT HV Monitor | 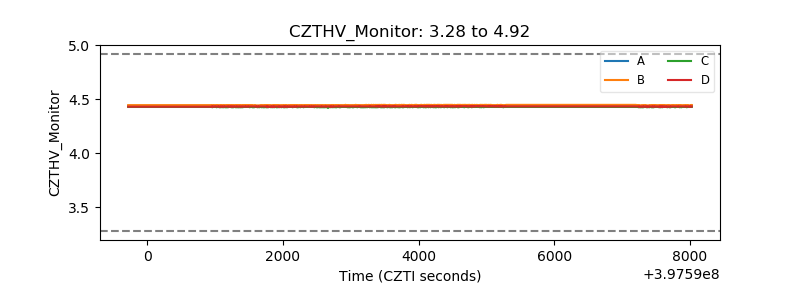 |
| D_VDD | 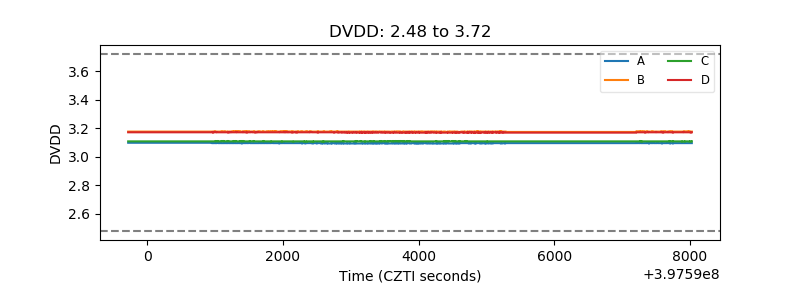 |
| Temperature 1 | 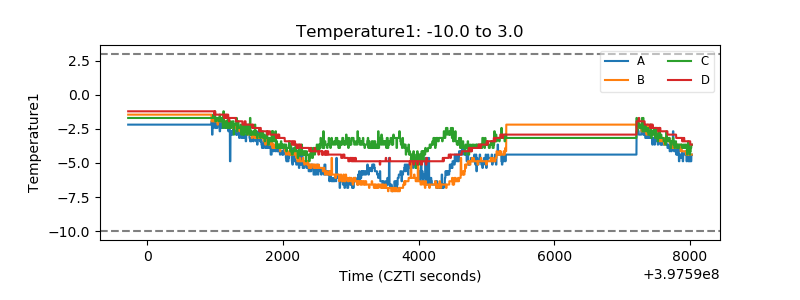 |
| Veto HV Monitor | 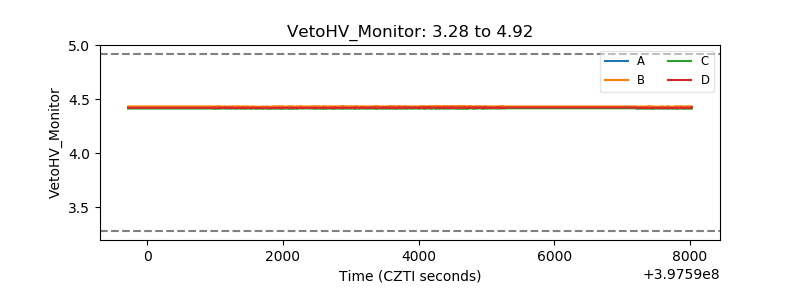 |
| Veto LLD | 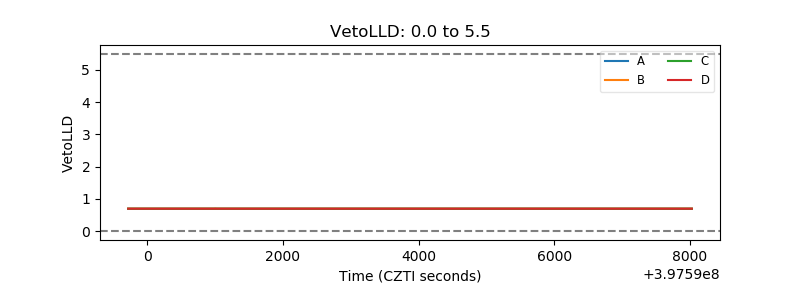 |
| Alpha Counter | 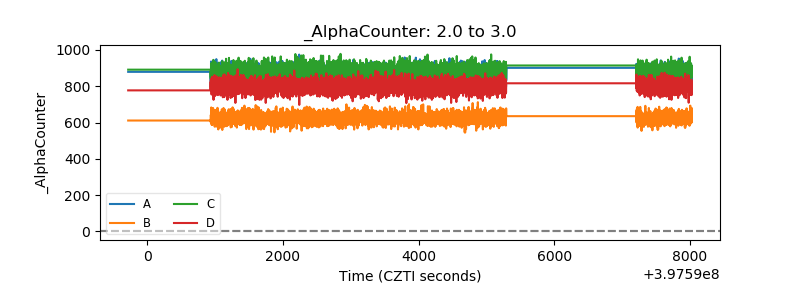 |
| _CPM_Rate | 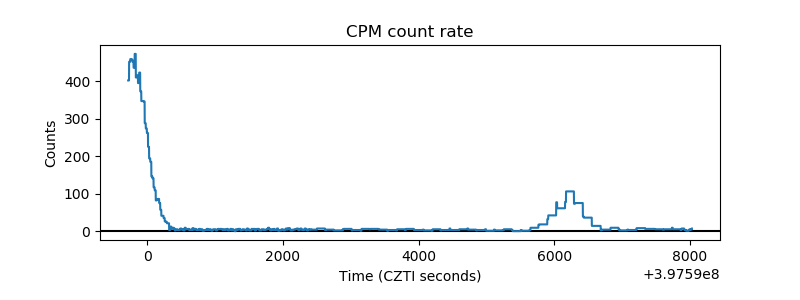 |
| CZT Counter | 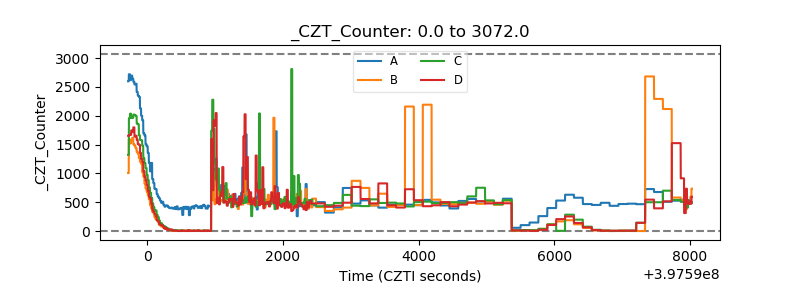 |
| +2.5 Volts monitor | 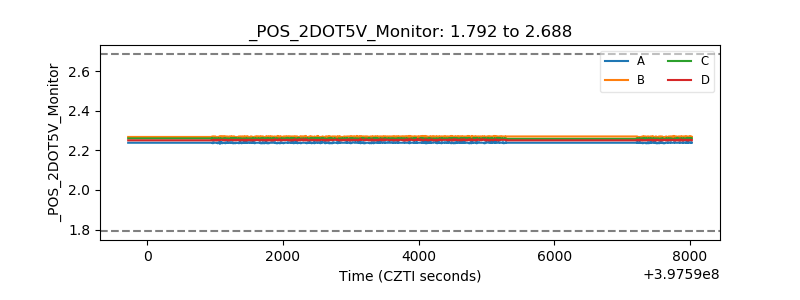 |
| +5 Volts monitor | 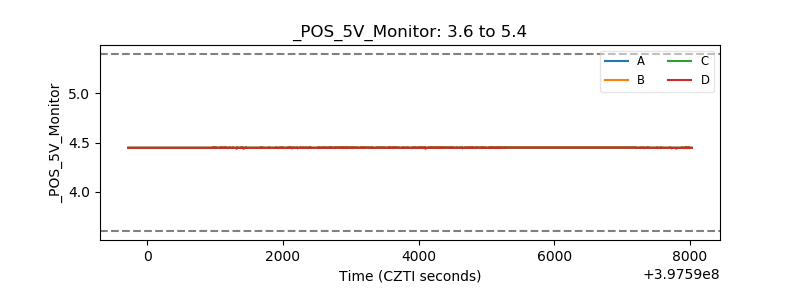 |
| _ROLL_ROT | 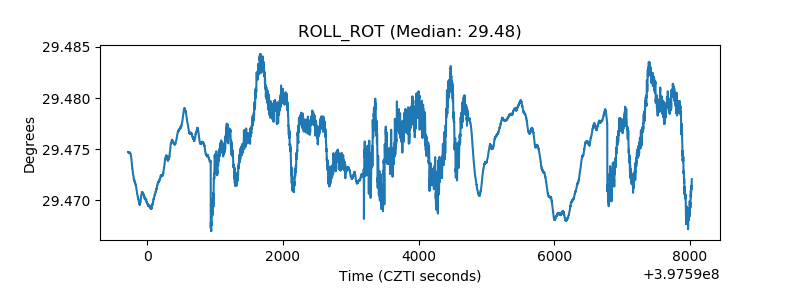 |
| _Roll_DEC | 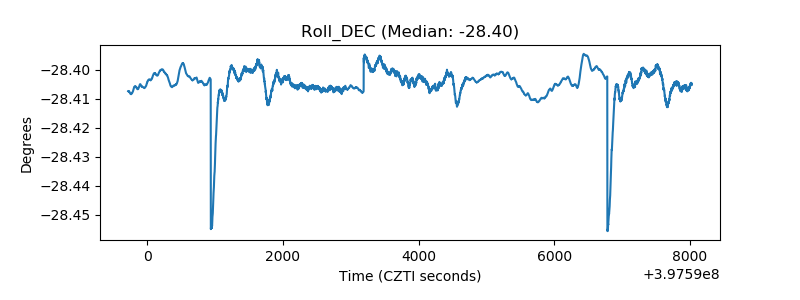 |
| _Roll_RA | 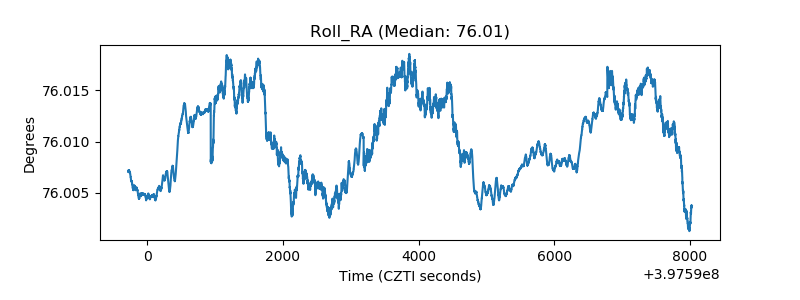 |
| Veto Counter | 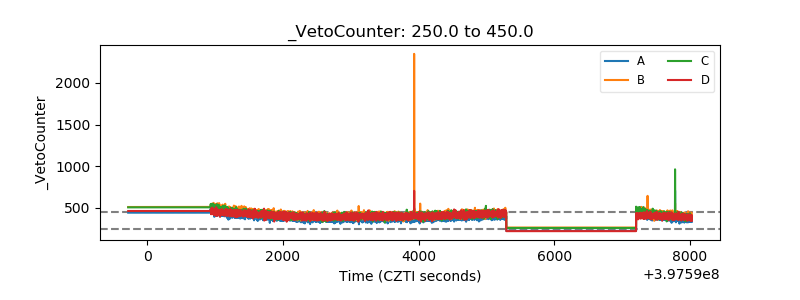 |