| Param | Original file | Final file |
|---|---|---|
| Filename | modeM0/AS1A09_138T04_9000005282_37090cztM0_level2.evt | modeM0/AS1A09_138T04_9000005282_37090cztM0_level2_quad_clean.evt |
| Size (bytes) | 466,274,880 | 77,106,240 |
| Size | 444.7 MB | 73.5 MB |
| Events in quadrant A | 3,069,941 | 501,785 |
| Events in quadrant B | 3,963,538 | 490,212 |
| Events in quadrant C | 3,191,281 | 483,511 |
| Events in quadrant D | 3,517,195 | 468,598 |
| Mode SS | |||
|---|---|---|---|
| Quadrant | BADHDUFLAG | Total packets | Discarded packets |
| A | 0 | 116 | 0 |
| B | 0 | 116 | 0 |
| C | 0 | 116 | 0 |
| D | 0 | 116 | 0 |
| Mode M0 | |||
|---|---|---|---|
| Quadrant | BADHDUFLAG | Total packets | Discarded packets |
| A | 0 | 12601 | 3 |
| B | 0 | 15354 | 2 |
| C | 0 | 12715 | 2 |
| D | 0 | 14116 | 2 |
| Mode M9 | |||
|---|---|---|---|
| Quadrant | BADHDUFLAG | Total packets | Discarded packets |
| A | 0 | 25 | 0 |
| B | 0 | 25 | 0 |
| C | 0 | 25 | 0 |
| D | 0 | 26 | 0 |
| Quadrant | Total seconds | Saturated seconds | Saturation percentage |
|---|---|---|---|
| A | 5576 | 43 | 0.771162% |
| B | 5576 | 435 | 7.801291% |
| C | 5576 | 130 | 2.331420% |
| D | 5576 | 173 | 3.102582% |
Noise dominated data is calculated using 1-second bins in cleaned event files. If a bin has >2000 counts, and if more than 50% of those come from <1% of pixels, then it is considered to be noise-dominated and hence unusable.
| Quadrant | # 1 sec bins | Bins with >0 counts | Bins with >2000 counts | High rate bins dominated by noise | Noise dominated (total time) | Noise dominated (detector-on time) | Marked lightcurve |
|---|---|---|---|---|---|---|---|
| A | 7129 | 5577 | 29 | 29 | 0.41% | 0.52% | 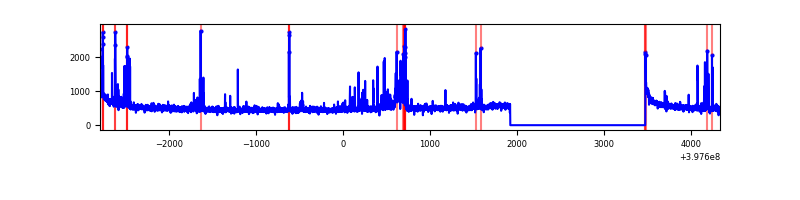 |
| B | 7129 | 5577 | 312 | 312 | 4.38% | 5.59% | 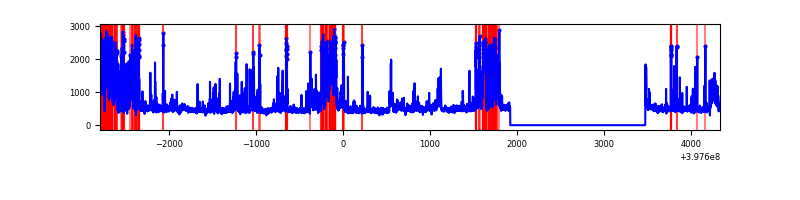 |
| C | 7129 | 5577 | 131 | 131 | 1.84% | 2.35% | 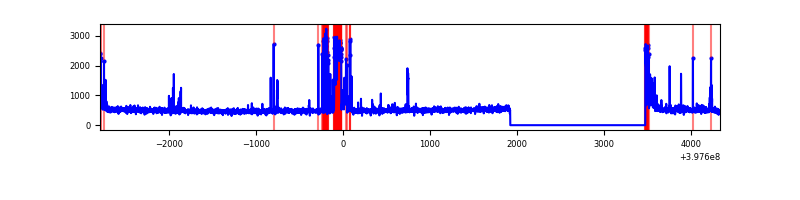 |
| D | 7129 | 5577 | 165 | 165 | 2.31% | 2.96% | 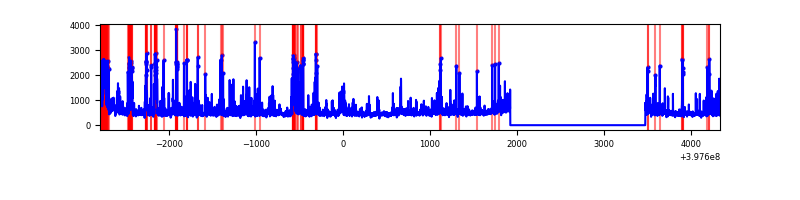 |
Top three noisy pixels from each quadrant. If the there are fewer than three noisy pixels in the level2.evt file, extra rows are filled as -1
| Pixel properties | Quadrant properties | ||||||
|---|---|---|---|---|---|---|---|
| Quadrant | DetID | PixID | Counts | Sigma | Mean | Median | Sigma |
| A | 10 | 83 | 267415 | 2047.78 | 650 | 636 | 130.3 |
| A | 7 | 3 | 134031 | 1023.93 | 650 | 636 | 130.3 |
| A | 9 | 143 | 58314 | 442.73 | 650 | 636 | 130.3 |
| B | 5 | 184 | 828760 | 6784.63 | 626 | 609 | 122.1 |
| B | 5 | 172 | 534245 | 4371.81 | 626 | 609 | 122.1 |
| B | 0 | 182 | 35736 | 287.78 | 626 | 609 | 122.1 |
| C | 1 | 23 | 332758 | 2270.52 | 625 | 629 | 146.3 |
| C | 15 | 214 | 237750 | 1621.02 | 625 | 629 | 146.3 |
| C | 0 | 10 | 155642 | 1059.71 | 625 | 629 | 146.3 |
| D | 2 | 250 | 274098 | 1814.61 | 624 | 608 | 150.7 |
| D | 12 | 17 | 206879 | 1368.61 | 624 | 608 | 150.7 |
| D | 2 | 153 | 148668 | 982.38 | 624 | 608 | 150.7 |
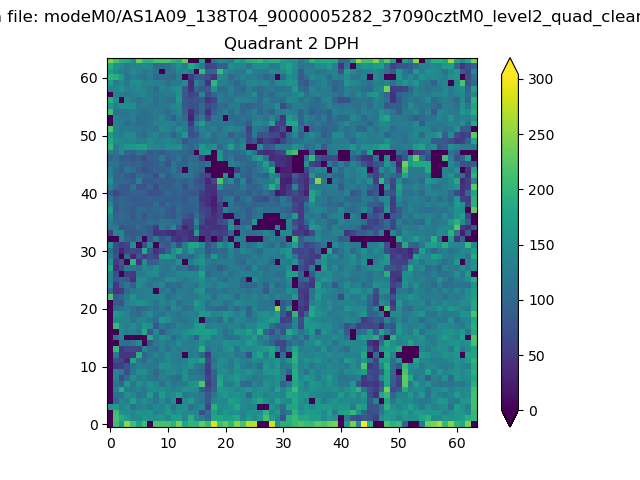
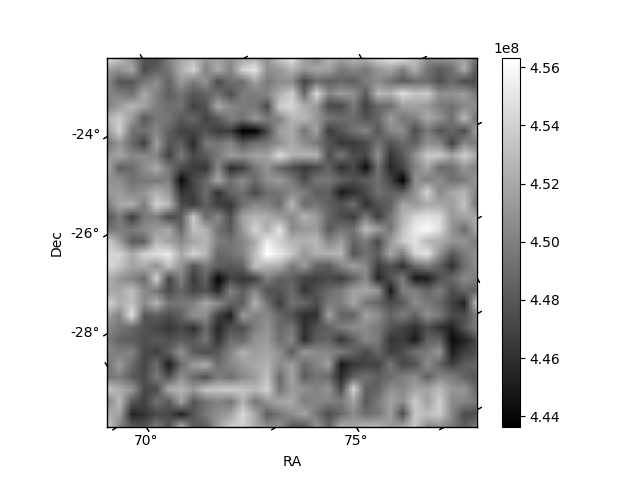
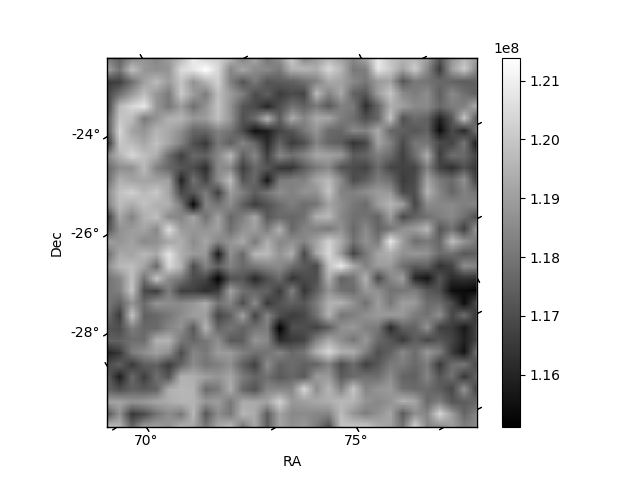
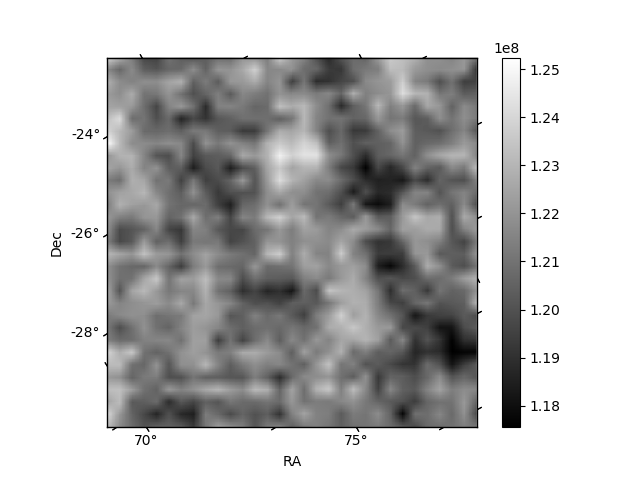
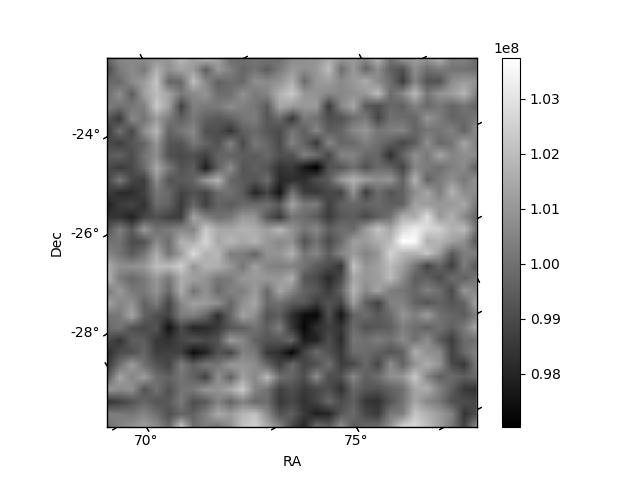
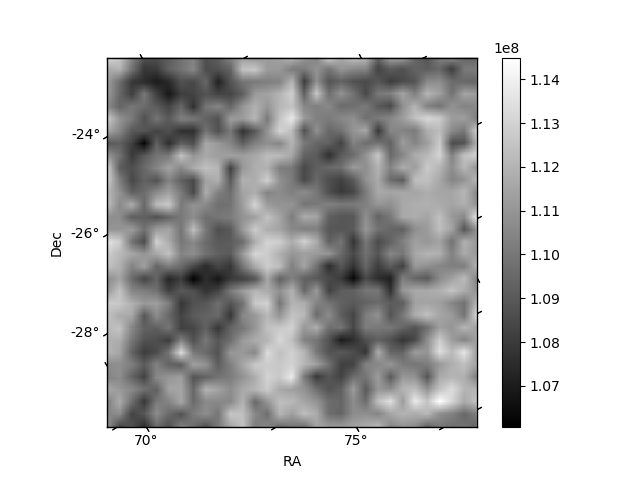
Histogram calculated using DETX and DETY for each event in the final _common_clean file
| Quadrant A | 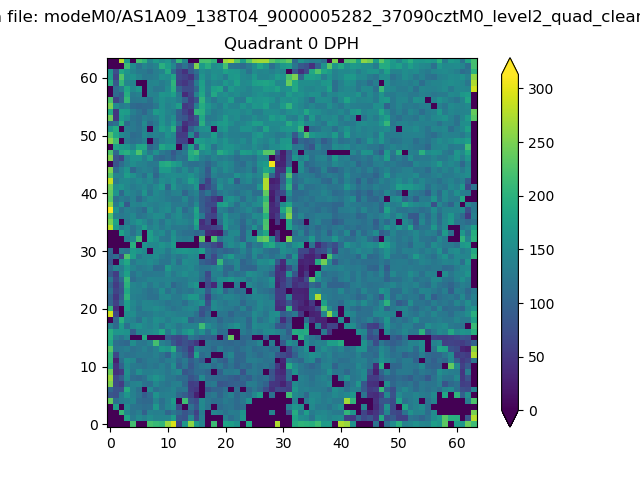 |
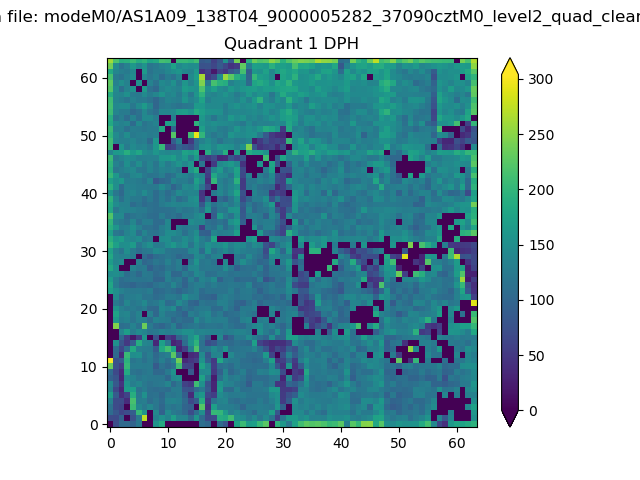 |
Quadrant B |
|---|---|---|---|
| Quadrant D | 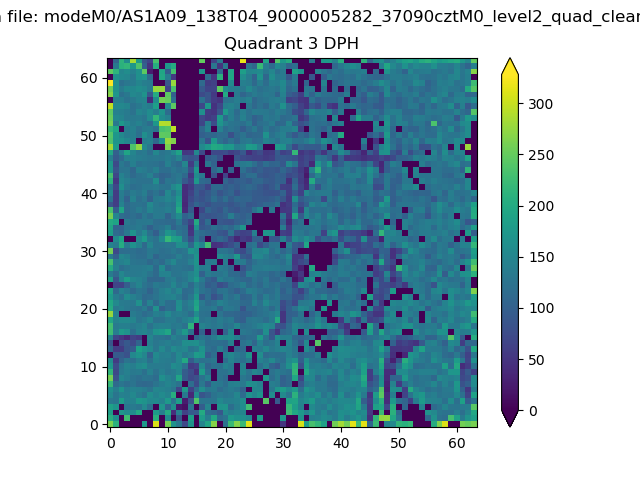 |
 |
Quadrant C |
| Plot type | Count rate plots | Images |
|---|---|---|
| Comparison with Poisson distribution Blue bars denote a histogram of data divided into 1 sec bins. Red curve is a Poisson curve with rate = median count rate of data. |
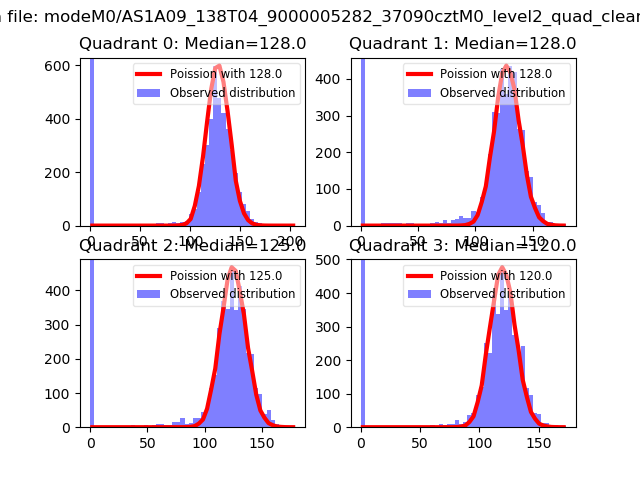 |
 |
| Quadrant-wise count rates Data is divided into 100 sec bins |
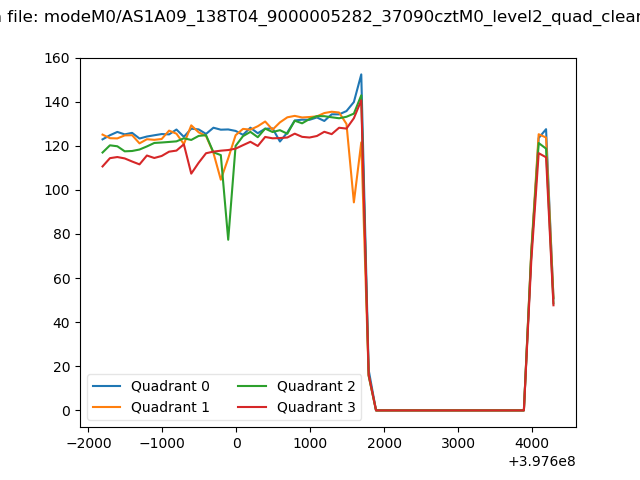 |
|
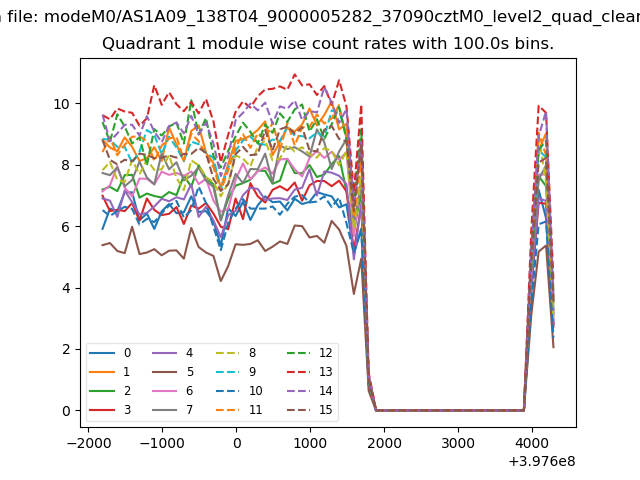
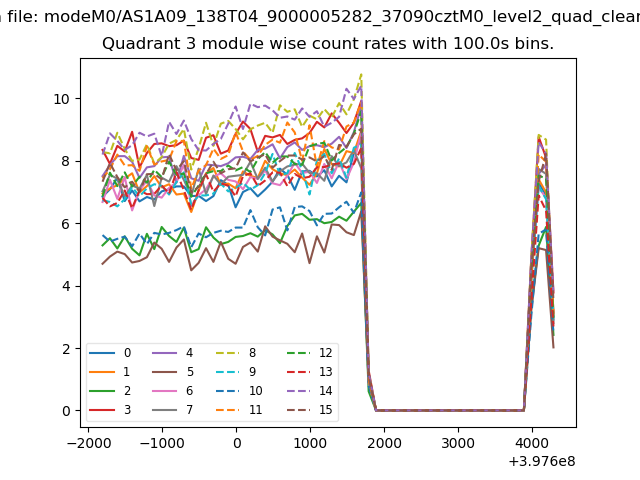
| Module-wise count rates for Quadrant A Data is divided into 100 sec bins |
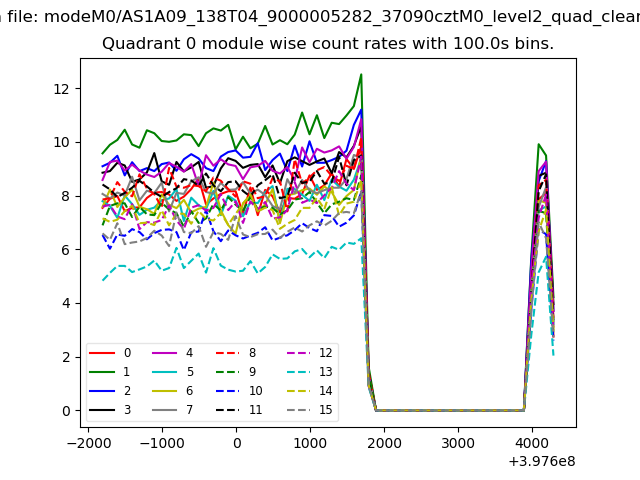 |
 |
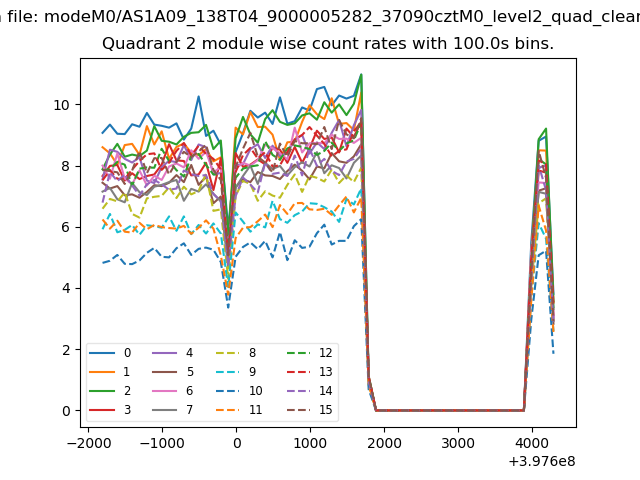
| Module-wise count rates for Quadrant B Data is divided into 100 sec bins |
 |
 |
| Module-wise count rates for Quadrant C Data is divided into 100 sec bins |
 |
 |
| Module-wise count rates for Quadrant D Data is divided into 100 sec bins |
 |
 |
| Parameter | Plot |
|---|---|
| CZT HV Monitor | 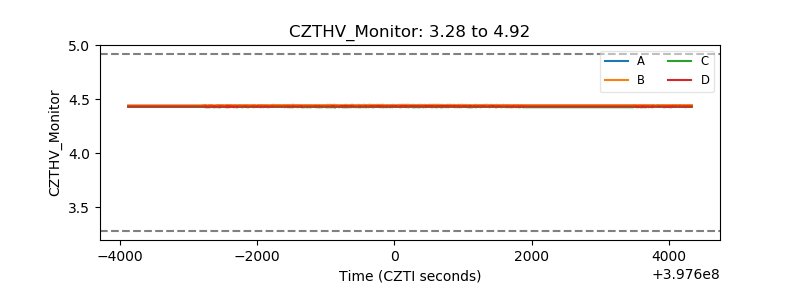 |
| D_VDD | 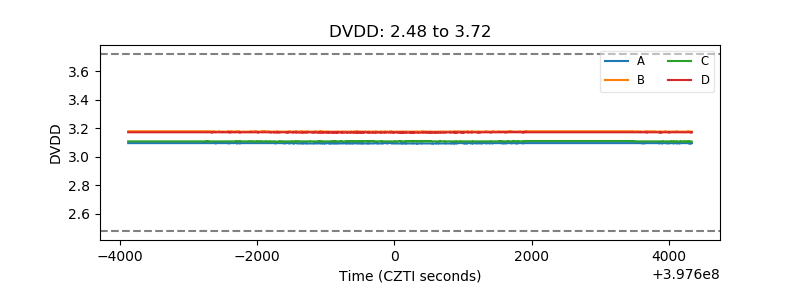 |
| Temperature 1 | 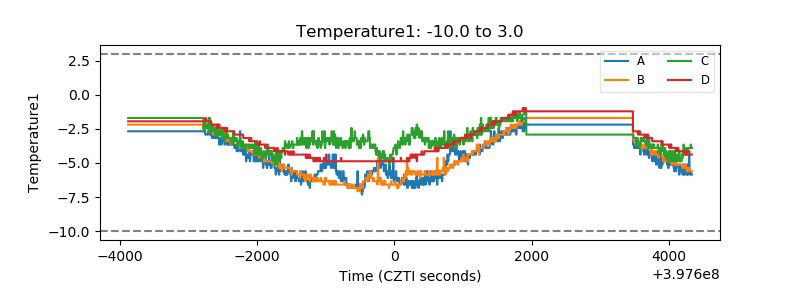 |
| Veto HV Monitor | 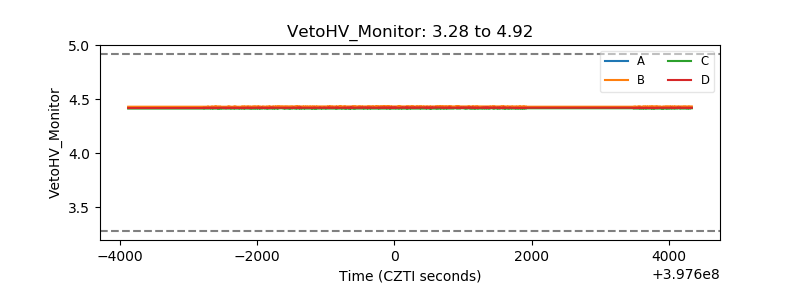 |
| Veto LLD | 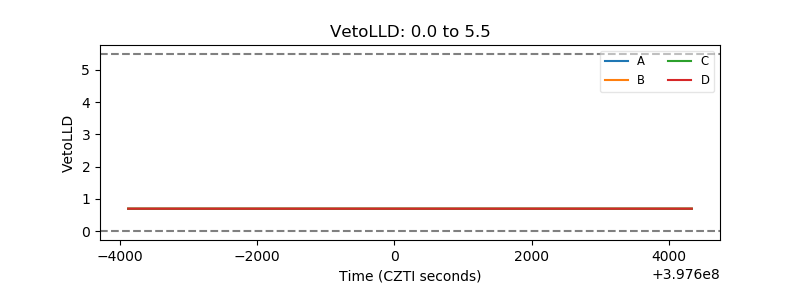 |
| Alpha Counter | 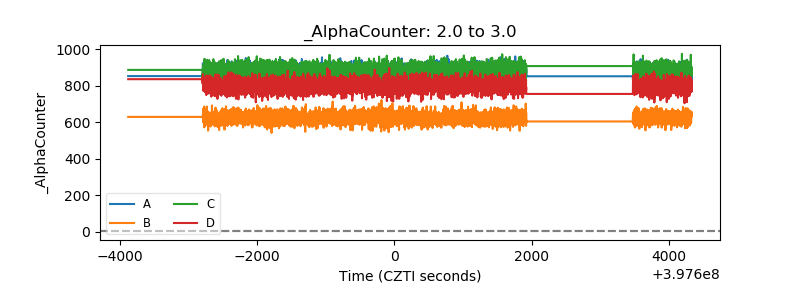 |
| _CPM_Rate | 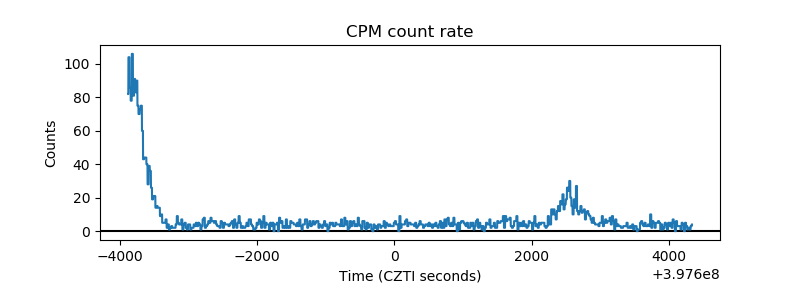 |
| CZT Counter |  |
| +2.5 Volts monitor | 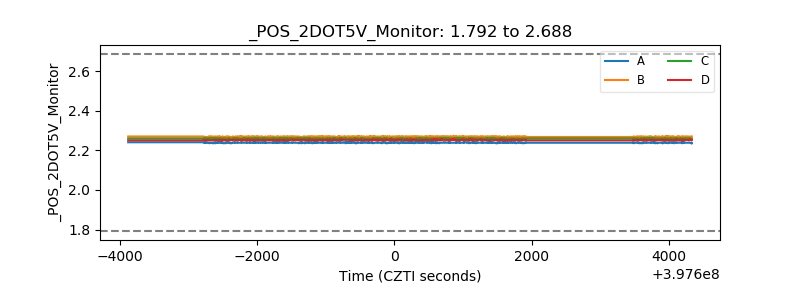 |
| +5 Volts monitor | 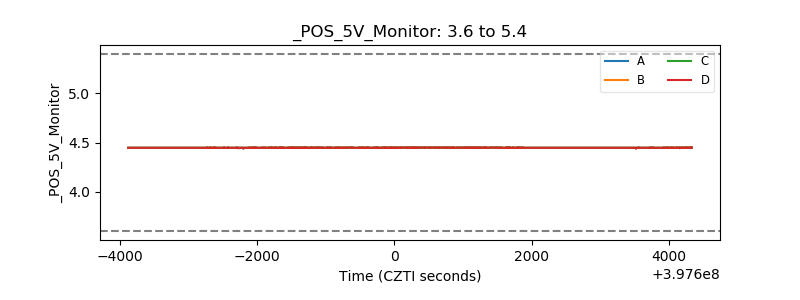 |
| _ROLL_ROT | 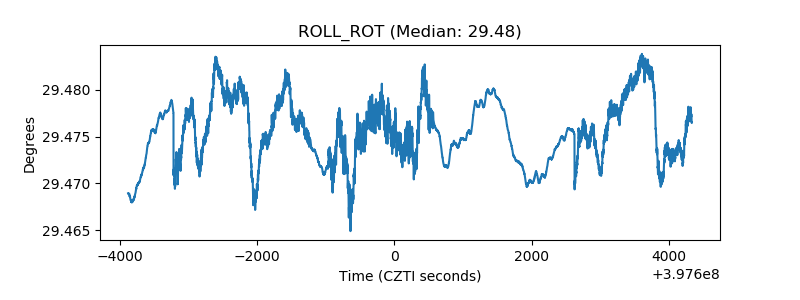 |
| _Roll_DEC | 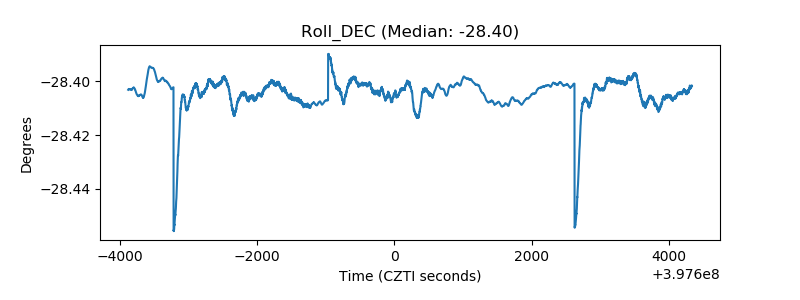 |
| _Roll_RA | 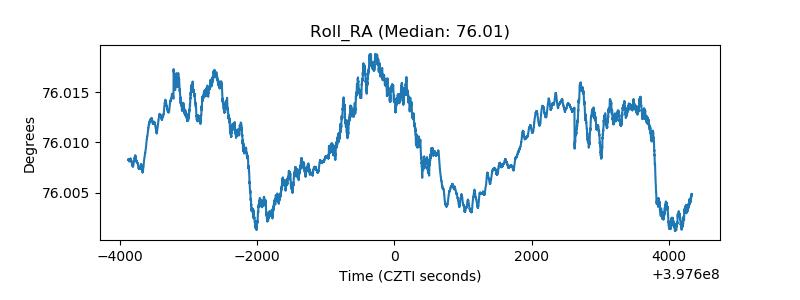 |
| Veto Counter | 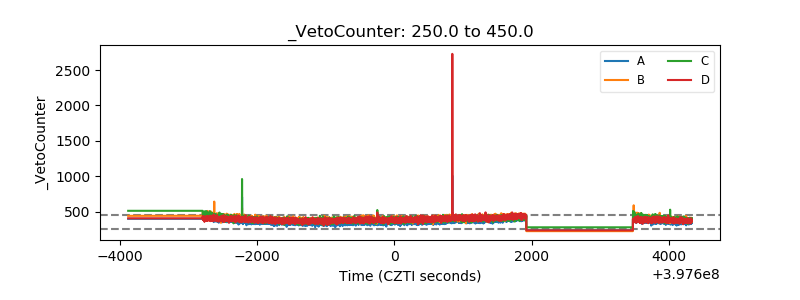 |