| Param | Original file | Final file |
|---|---|---|
| Filename | modeM0/AS1A09_138T04_9000005282_37091cztM0_level2.evt | modeM0/AS1A09_138T04_9000005282_37091cztM0_level2_quad_clean.evt |
| Size (bytes) | 460,296,000 | 84,303,360 |
| Size | 439.0 MB | 80.4 MB |
| Events in quadrant A | 3,039,442 | 552,489 |
| Events in quadrant B | 3,206,254 | 554,724 |
| Events in quadrant C | 3,154,014 | 538,817 |
| Events in quadrant D | 4,141,549 | 496,466 |
| Mode SS | |||
|---|---|---|---|
| Quadrant | BADHDUFLAG | Total packets | Discarded packets |
| A | 0 | 118 | 0 |
| B | 0 | 118 | 0 |
| C | 0 | 118 | 0 |
| D | 0 | 118 | 0 |
| Mode M0 | |||
|---|---|---|---|
| Quadrant | BADHDUFLAG | Total packets | Discarded packets |
| A | 0 | 12701 | 3 |
| B | 0 | 13383 | 2 |
| C | 0 | 12771 | 2 |
| D | 0 | 16190 | 2 |
| Mode M9 | |||
|---|---|---|---|
| Quadrant | BADHDUFLAG | Total packets | Discarded packets |
| A | 0 | 23 | 0 |
| B | 0 | 23 | 0 |
| C | 0 | 23 | 0 |
| D | 0 | 24 | 0 |
| Quadrant | Total seconds | Saturated seconds | Saturation percentage |
|---|---|---|---|
| A | 5878 | 28 | 0.476353% |
| B | 5878 | 84 | 1.429058% |
| C | 5878 | 50 | 0.850629% |
| D | 5878 | 347 | 5.903368% |
Noise dominated data is calculated using 1-second bins in cleaned event files. If a bin has >2000 counts, and if more than 50% of those come from <1% of pixels, then it is considered to be noise-dominated and hence unusable.
| Quadrant | # 1 sec bins | Bins with >0 counts | Bins with >2000 counts | High rate bins dominated by noise | Noise dominated (total time) | Noise dominated (detector-on time) | Marked lightcurve |
|---|---|---|---|---|---|---|---|
| A | 7221 | 5879 | 17 | 17 | 0.24% | 0.29% | 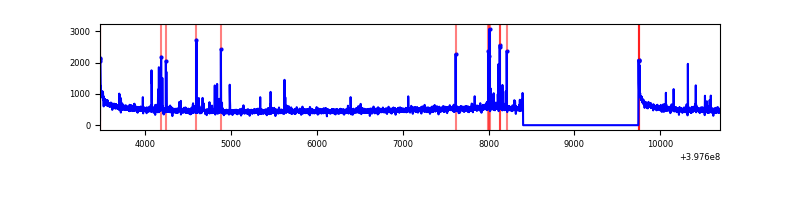 |
| B | 7221 | 5879 | 58 | 58 | 0.80% | 0.99% | 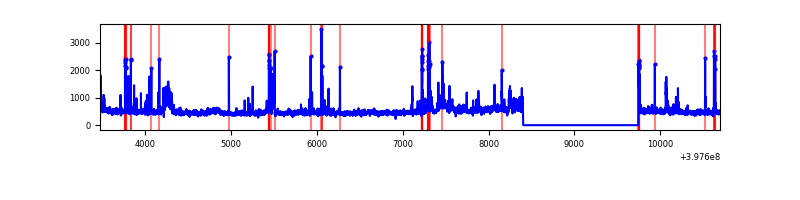 |
| C | 7221 | 5879 | 37 | 37 | 0.51% | 0.63% | 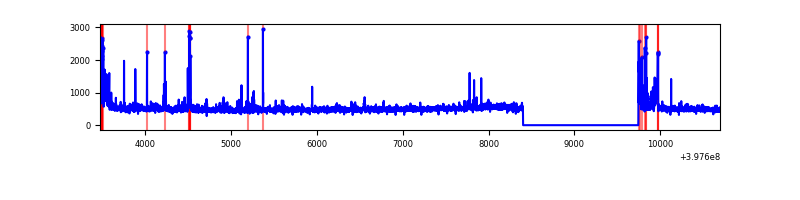 |
| D | 7221 | 5879 | 330 | 330 | 4.57% | 5.61% | 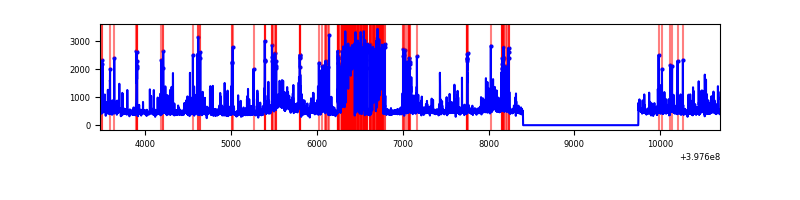 |
Top three noisy pixels from each quadrant. If the there are fewer than three noisy pixels in the level2.evt file, extra rows are filled as -1
| Pixel properties | Quadrant properties | ||||||
|---|---|---|---|---|---|---|---|
| Quadrant | DetID | PixID | Counts | Sigma | Mean | Median | Sigma |
| A | 10 | 83 | 273133 | 1963.71 | 681 | 669 | 138.7 |
| A | 15 | 237 | 53542 | 381.07 | 681 | 669 | 138.7 |
| A | 9 | 143 | 34843 | 246.3 | 681 | 669 | 138.7 |
| B | 5 | 184 | 162423 | 1230.26 | 674 | 656 | 131.5 |
| B | 5 | 172 | 151461 | 1146.89 | 674 | 656 | 131.5 |
| B | 5 | 255 | 64712 | 487.15 | 674 | 656 | 131.5 |
| C | 15 | 214 | 250354 | 1609.43 | 659 | 664 | 155.1 |
| C | 0 | 10 | 194093 | 1246.79 | 659 | 664 | 155.1 |
| C | 15 | 159 | 43593 | 276.71 | 659 | 664 | 155.1 |
| D | 13 | 249 | 871033 | 5473.02 | 647 | 631 | 159.0 |
| D | 13 | 171 | 205495 | 1288.17 | 647 | 631 | 159.0 |
| D | 2 | 153 | 129959 | 813.2 | 647 | 631 | 159.0 |
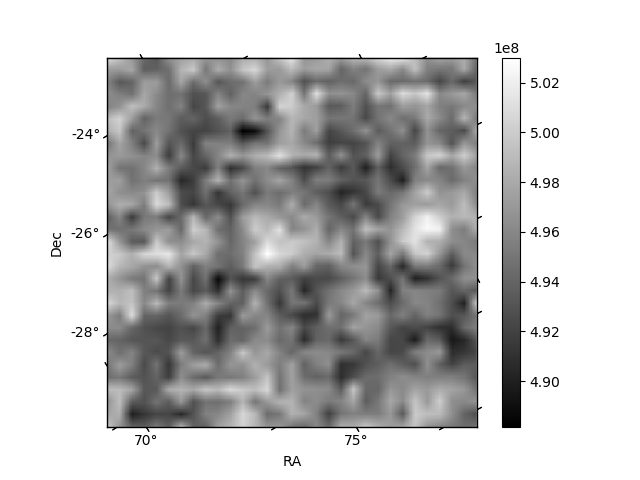
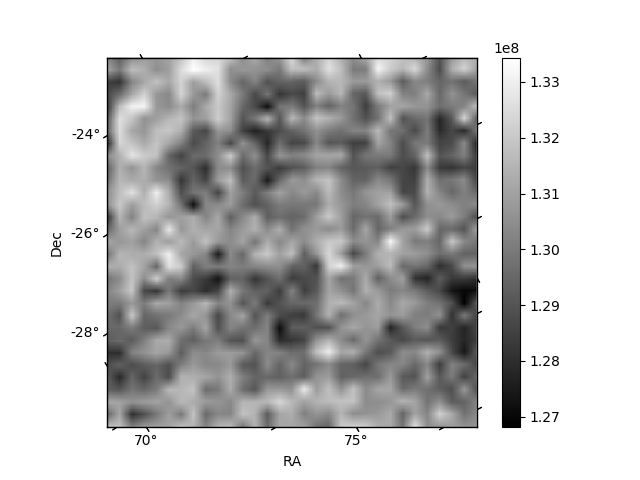
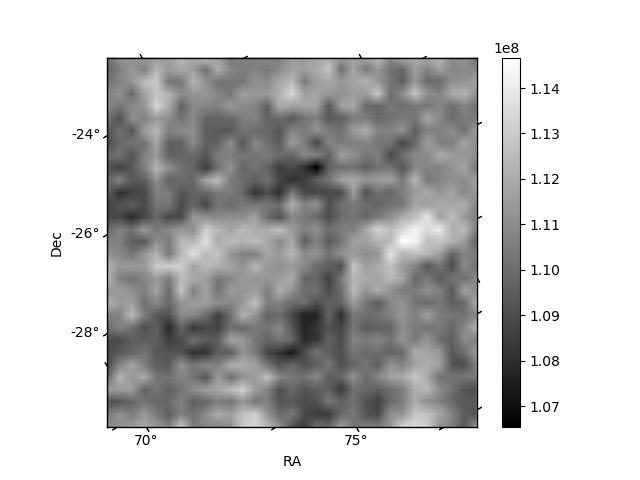
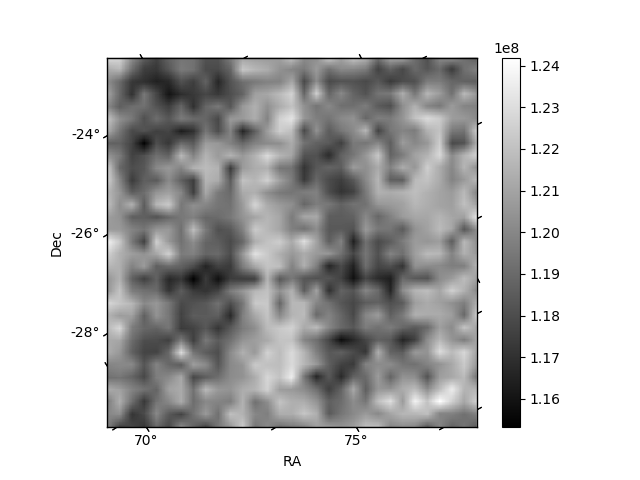
Histogram calculated using DETX and DETY for each event in the final _common_clean file
| Quadrant A | 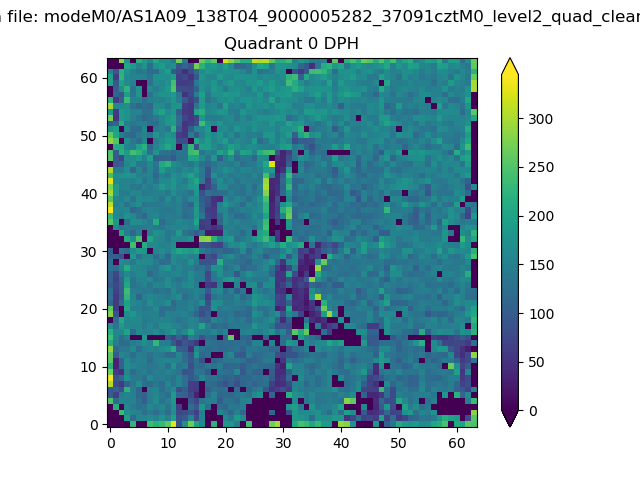 |
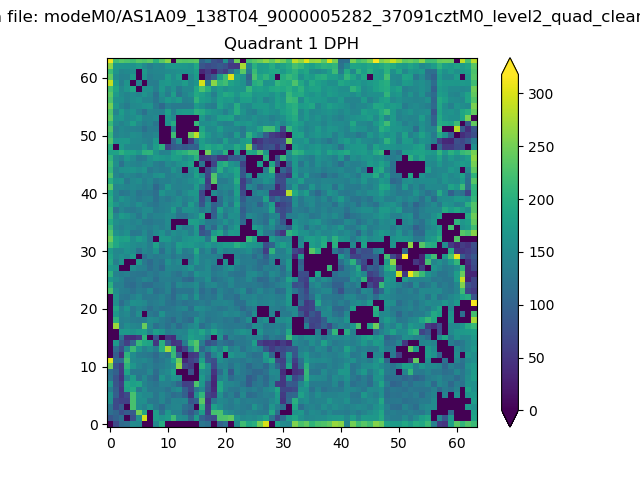 |
Quadrant B |
|---|---|---|---|
| Quadrant D | 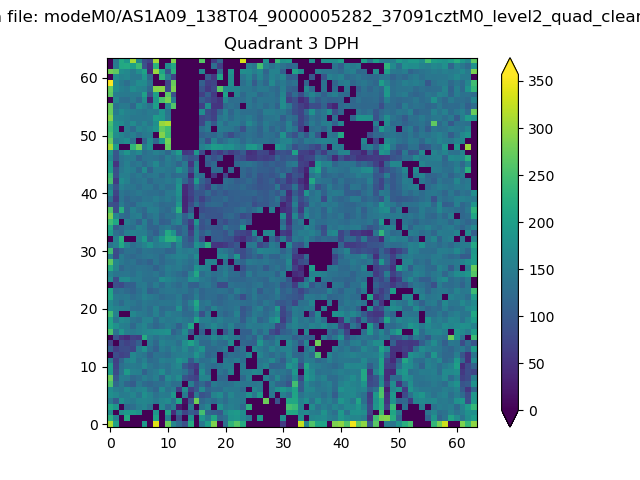 |
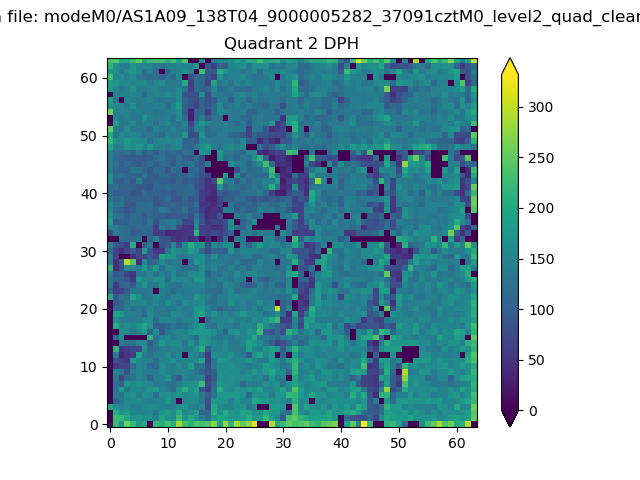 |
Quadrant C |
| Plot type | Count rate plots | Images |
|---|---|---|
| Comparison with Poisson distribution Blue bars denote a histogram of data divided into 1 sec bins. Red curve is a Poisson curve with rate = median count rate of data. |
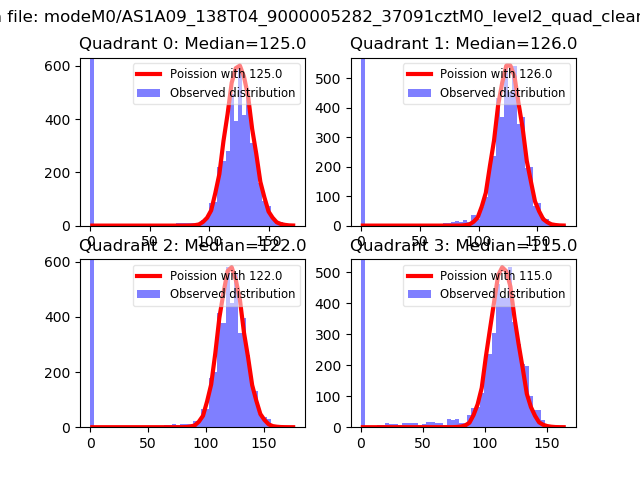 |
 |
| Quadrant-wise count rates Data is divided into 100 sec bins |
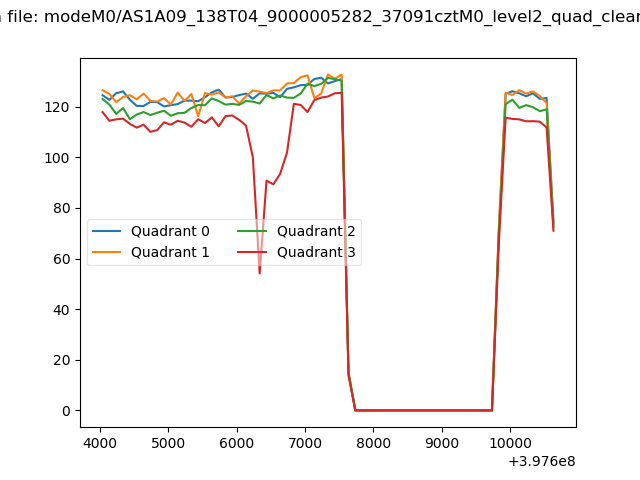 |
|
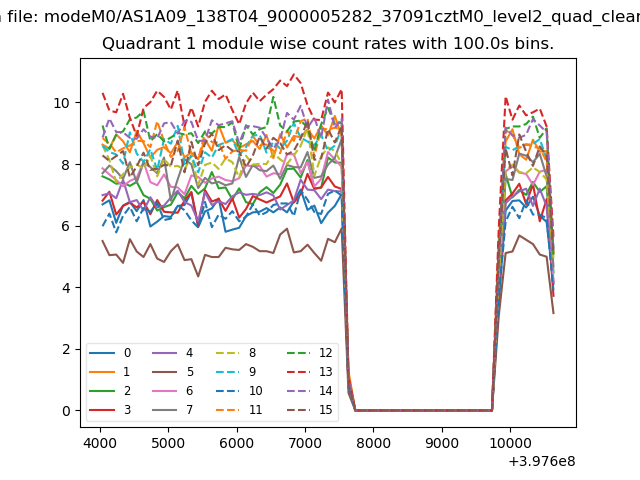
| Module-wise count rates for Quadrant A Data is divided into 100 sec bins |
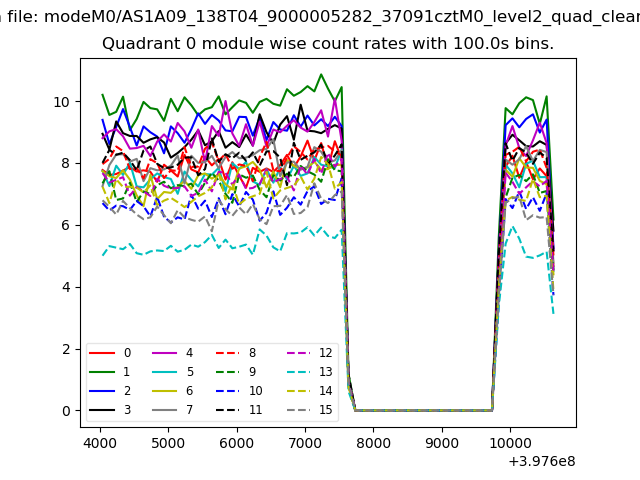 |
 |
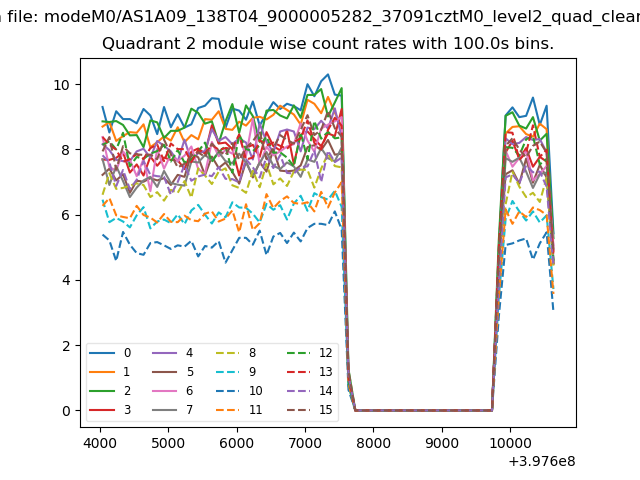
| Module-wise count rates for Quadrant B Data is divided into 100 sec bins |
 |
 |
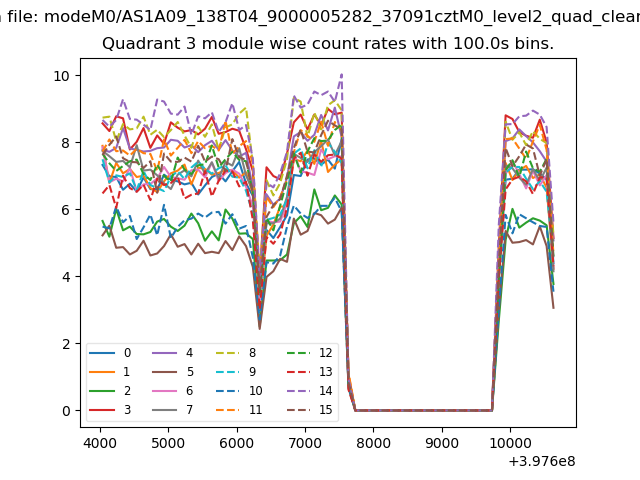
| Module-wise count rates for Quadrant C Data is divided into 100 sec bins |
 |
 |
| Module-wise count rates for Quadrant D Data is divided into 100 sec bins |
 |
 |
| Parameter | Plot |
|---|---|
| CZT HV Monitor | 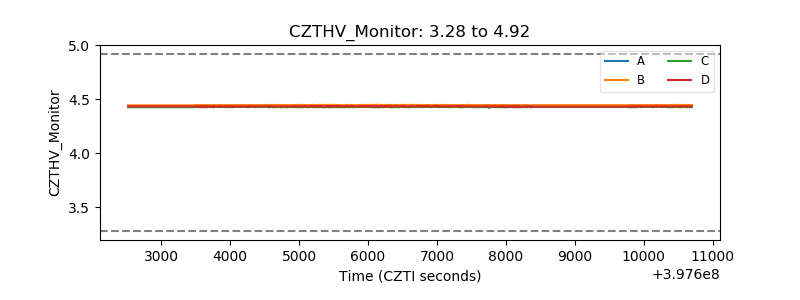 |
| D_VDD | 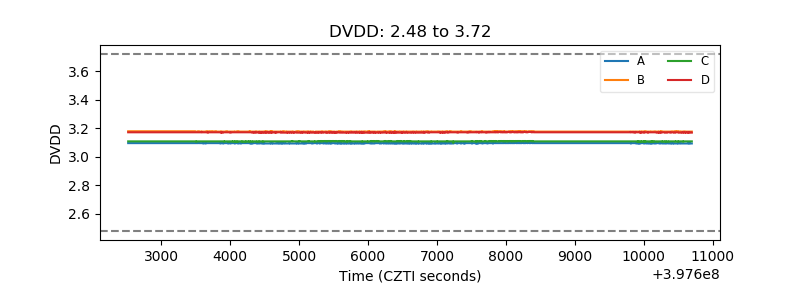 |
| Temperature 1 | 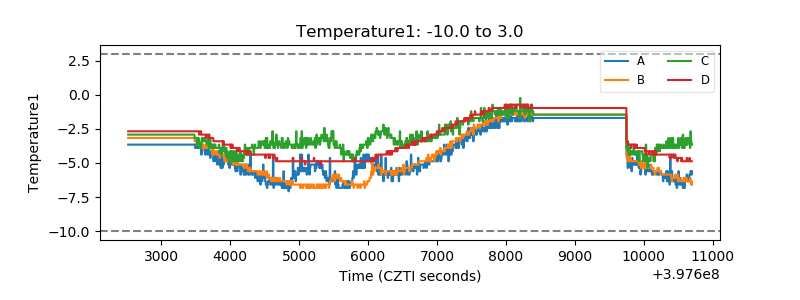 |
| Veto HV Monitor | 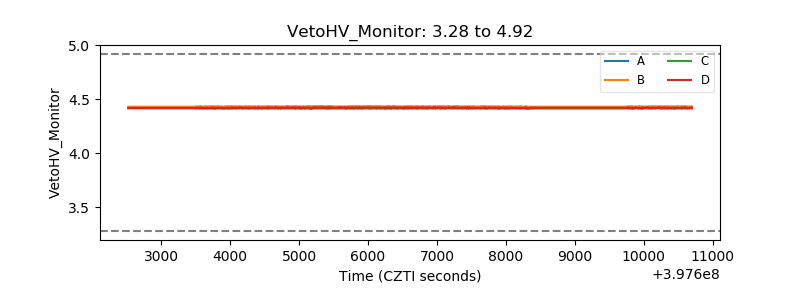 |
| Veto LLD | 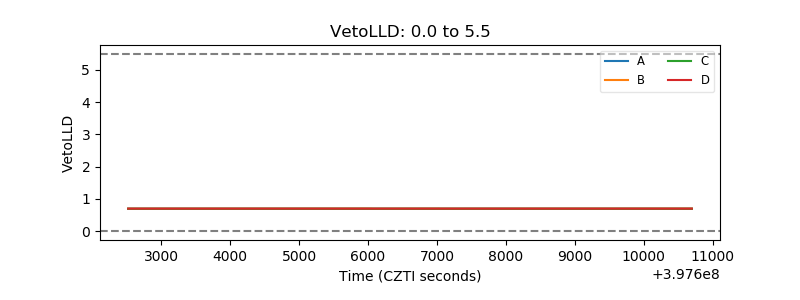 |
| Alpha Counter | 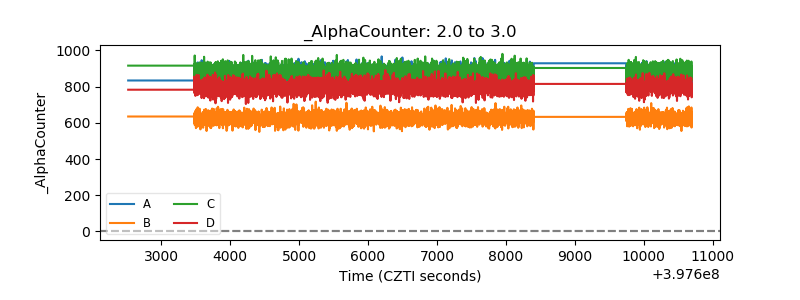 |
| _CPM_Rate | 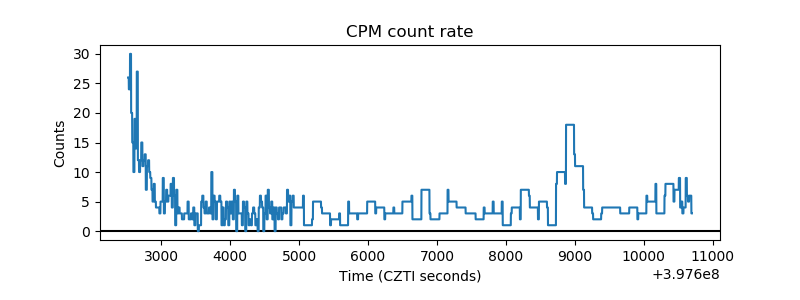 |
| CZT Counter | 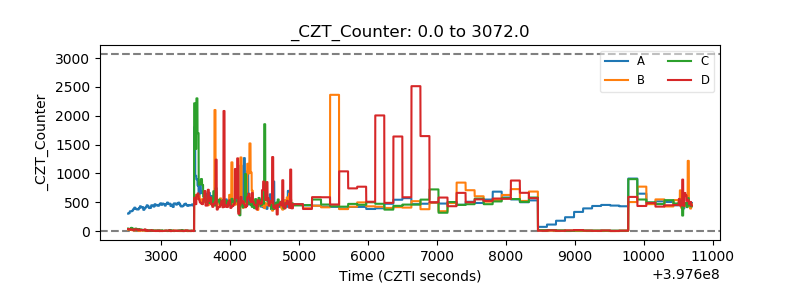 |
| +2.5 Volts monitor | 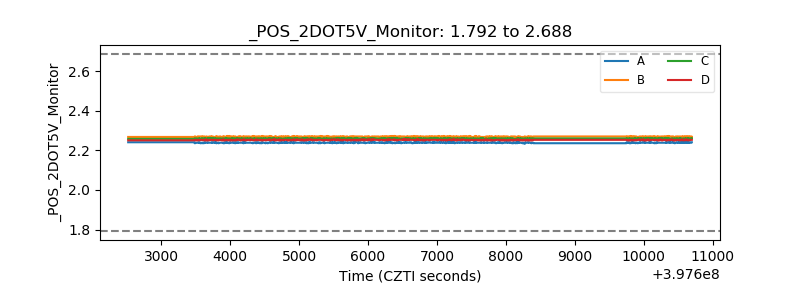 |
| +5 Volts monitor | 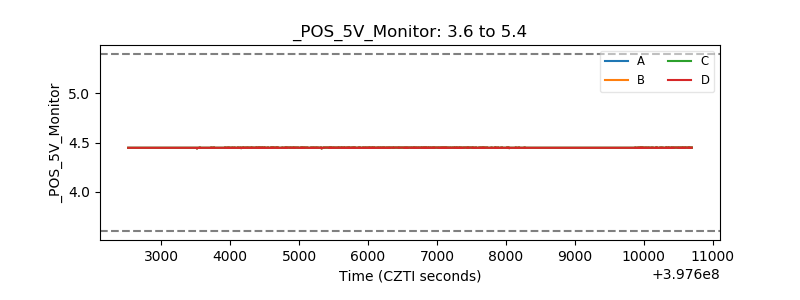 |
| _ROLL_ROT | 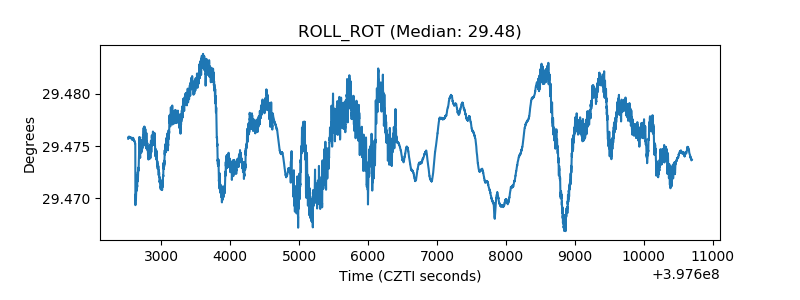 |
| _Roll_DEC | 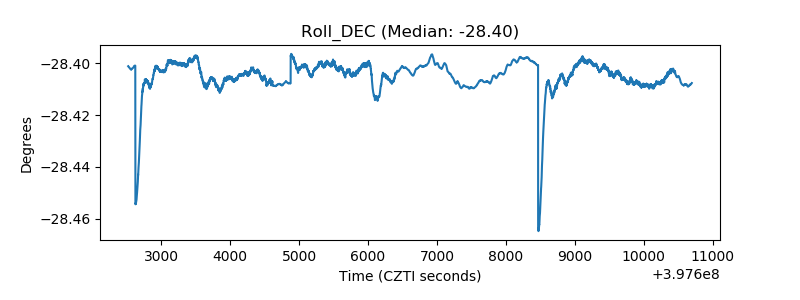 |
| _Roll_RA | 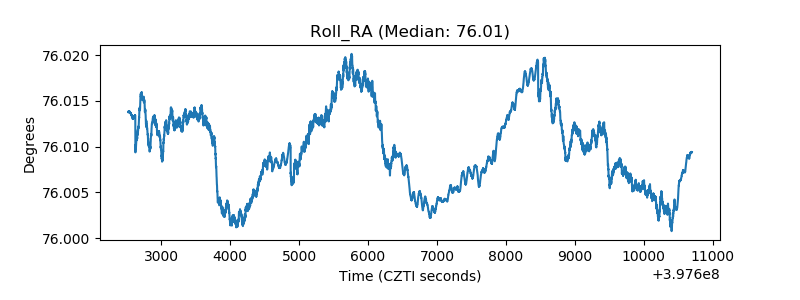 |
| Veto Counter | 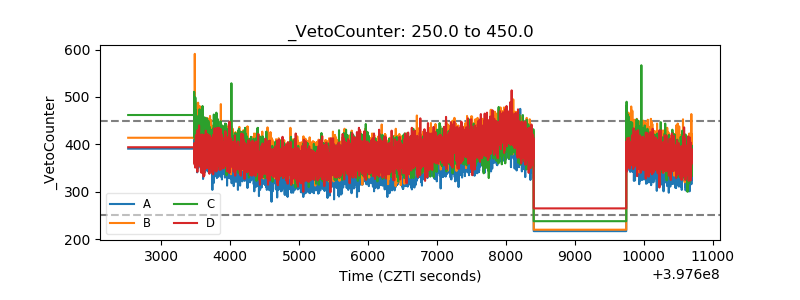 |