| Param | Original file | Final file |
|---|---|---|
| Filename | modeM0/AS1A09_138T04_9000005282_37098cztM0_level2.evt | modeM0/AS1A09_138T04_9000005282_37098cztM0_level2_quad_clean.evt |
| Size (bytes) | 1,777,066,560 | 274,469,760 |
| Size | 1.7 GB | 261.8 MB |
| Events in quadrant A | 12,620,527 | 1,690,302 |
| Events in quadrant B | 12,743,672 | 1,707,722 |
| Events in quadrant C | 12,012,839 | 1,680,110 |
| Events in quadrant D | 14,826,181 | 1,587,645 |
| Mode SS | |||
|---|---|---|---|
| Quadrant | BADHDUFLAG | Total packets | Discarded packets |
| A | 0 | 488 | 0 |
| B | 0 | 488 | 0 |
| C | 0 | 488 | 0 |
| D | 0 | 488 | 0 |
| Mode M0 | |||
|---|---|---|---|
| Quadrant | BADHDUFLAG | Total packets | Discarded packets |
| A | 0 | 52281 | 6 |
| B | 0 | 53591 | 5 |
| C | 0 | 49910 | 5 |
| D | 0 | 59946 | 5 |
| Mode M9 | |||
|---|---|---|---|
| Quadrant | BADHDUFLAG | Total packets | Discarded packets |
| A | 0 | 78 | 0 |
| B | 0 | 78 | 0 |
| C | 0 | 78 | 0 |
| D | 0 | 78 | 0 |
| Quadrant | Total seconds | Saturated seconds | Saturation percentage |
|---|---|---|---|
| A | 23941 | 197 | 0.822856% |
| B | 23941 | 424 | 1.771020% |
| C | 23941 | 71 | 0.296562% |
| D | 23941 | 573 | 2.393384% |
Noise dominated data is calculated using 1-second bins in cleaned event files. If a bin has >2000 counts, and if more than 50% of those come from <1% of pixels, then it is considered to be noise-dominated and hence unusable.
| Quadrant | # 1 sec bins | Bins with >0 counts | Bins with >2000 counts | High rate bins dominated by noise | Noise dominated (total time) | Noise dominated (detector-on time) | Marked lightcurve |
|---|---|---|---|---|---|---|---|
| A | 31767 | 23946 | 142 | 142 | 0.45% | 0.59% | 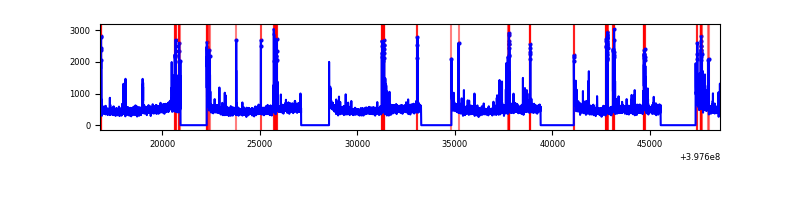 |
| B | 31767 | 23946 | 284 | 284 | 0.89% | 1.19% | 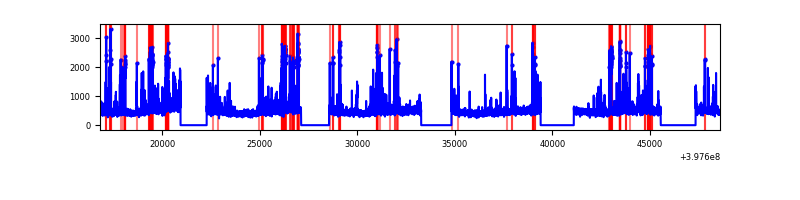 |
| C | 31767 | 23946 | 60 | 60 | 0.19% | 0.25% | 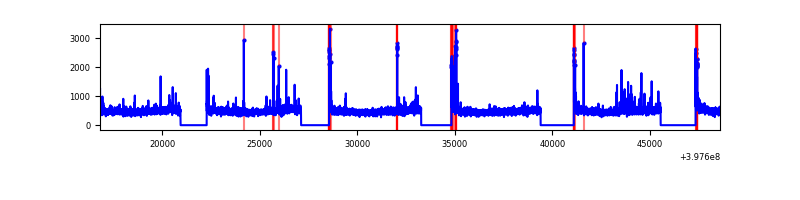 |
| D | 31767 | 23946 | 547 | 547 | 1.72% | 2.28% | 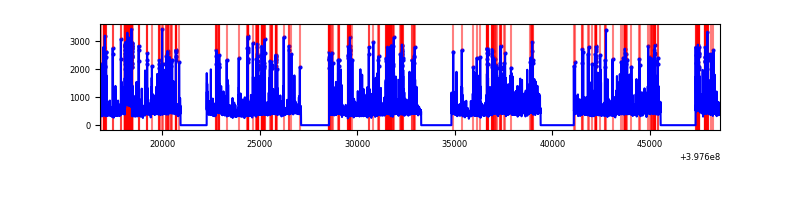 |
Top three noisy pixels from each quadrant. If the there are fewer than three noisy pixels in the level2.evt file, extra rows are filled as -1
| Pixel properties | Quadrant properties | ||||||
|---|---|---|---|---|---|---|---|
| Quadrant | DetID | PixID | Counts | Sigma | Mean | Median | Sigma |
| A | 10 | 83 | 950853 | 1720.72 | 2778 | 2727 | 551.0 |
| A | 7 | 3 | 465864 | 840.53 | 2778 | 2727 | 551.0 |
| A | 15 | 237 | 266308 | 478.36 | 2778 | 2727 | 551.0 |
| B | 5 | 172 | 967047 | 1852.76 | 2734 | 2663 | 520.5 |
| B | 5 | 255 | 267040 | 507.92 | 2734 | 2663 | 520.5 |
| B | 0 | 229 | 216057 | 409.97 | 2734 | 2663 | 520.5 |
| C | 15 | 214 | 1011392 | 1630.45 | 2687 | 2706 | 618.7 |
| C | 0 | 10 | 304949 | 488.55 | 2687 | 2706 | 618.7 |
| C | 0 | 207 | 154245 | 244.95 | 2687 | 2706 | 618.7 |
| D | 1 | 47 | 1069165 | 1641.98 | 2698 | 2628 | 649.5 |
| D | 13 | 249 | 953718 | 1464.24 | 2698 | 2628 | 649.5 |
| D | 1 | 52 | 709294 | 1087.94 | 2698 | 2628 | 649.5 |
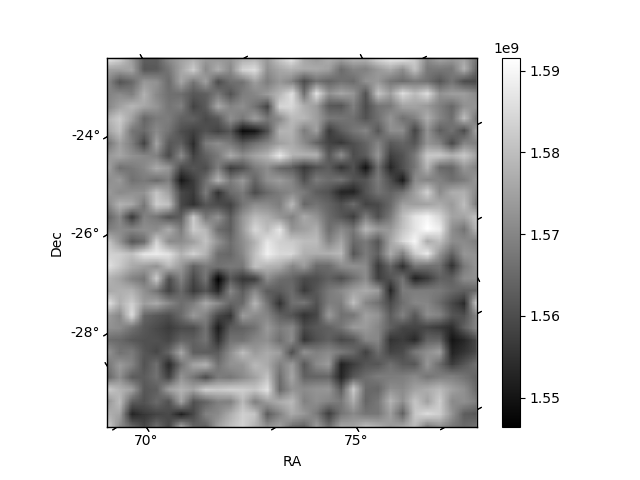
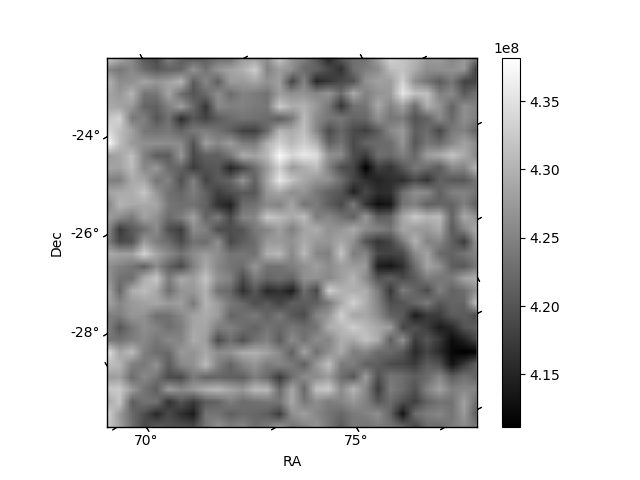
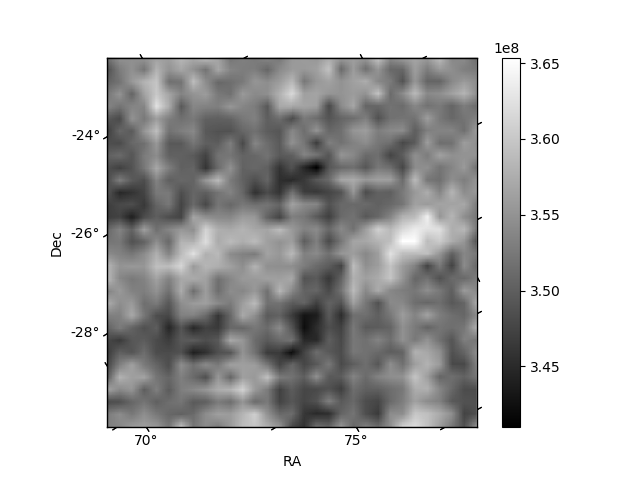
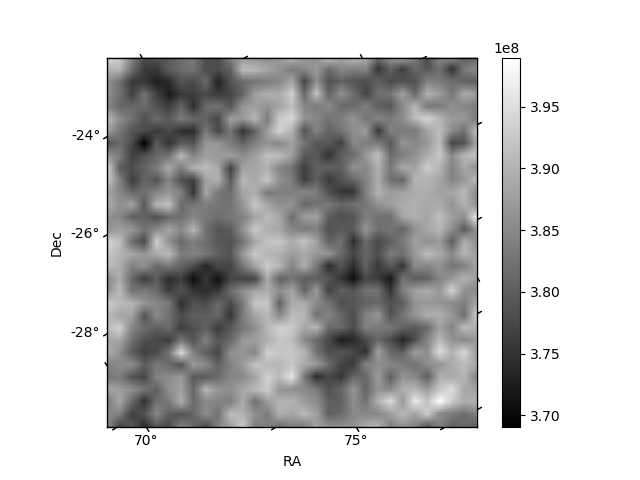
Histogram calculated using DETX and DETY for each event in the final _common_clean file
| Quadrant A | 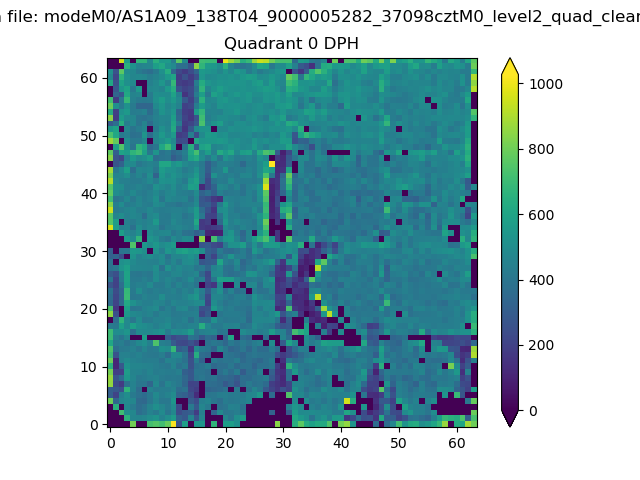 |
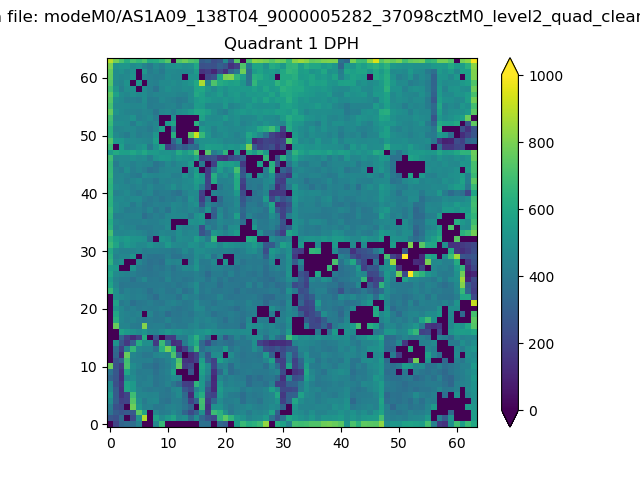 |
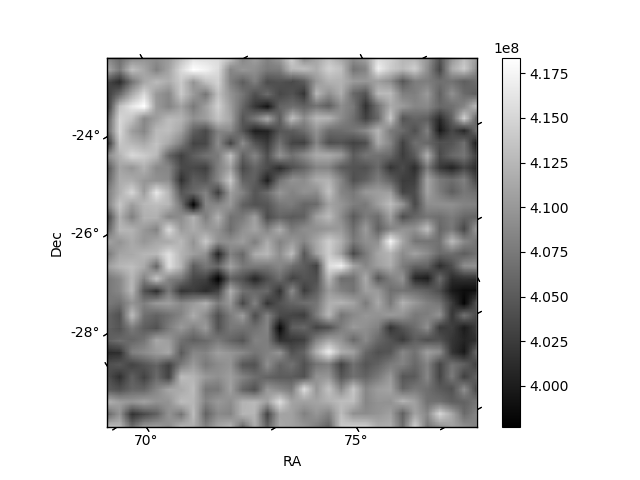
Quadrant B |
|---|---|---|---|
| Quadrant D | 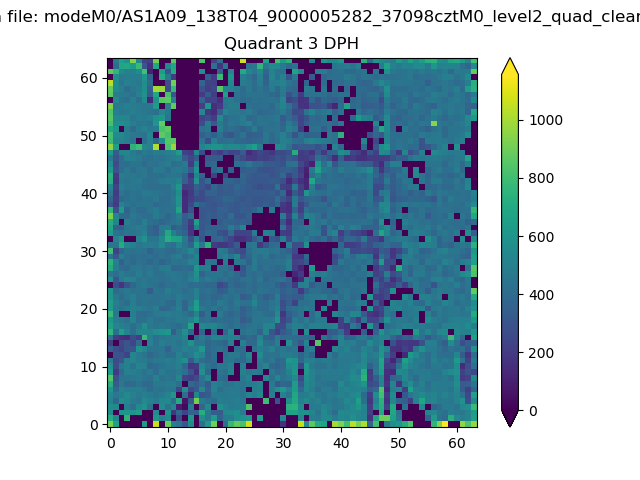 |
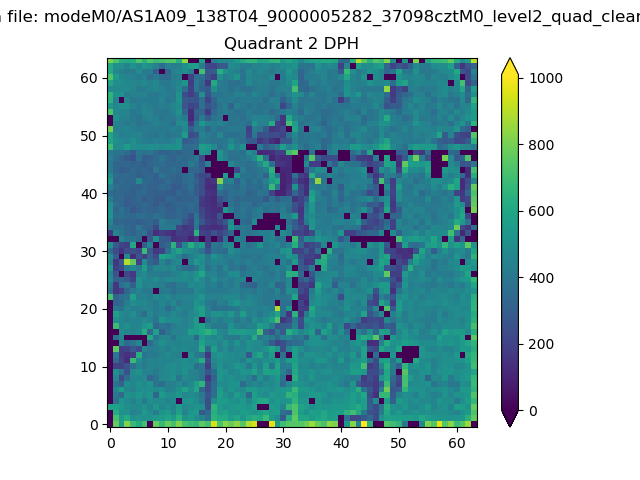 |
Quadrant C |
| Plot type | Count rate plots | Images |
|---|---|---|
| Comparison with Poisson distribution Blue bars denote a histogram of data divided into 1 sec bins. Red curve is a Poisson curve with rate = median count rate of data. |
 |
 |
| Quadrant-wise count rates Data is divided into 100 sec bins |
 |
|
| Module-wise count rates for Quadrant A Data is divided into 100 sec bins |
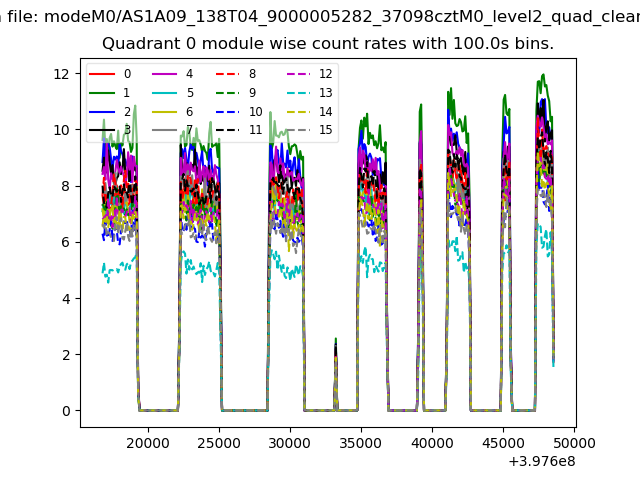 |
 |
| Module-wise count rates for Quadrant B Data is divided into 100 sec bins |
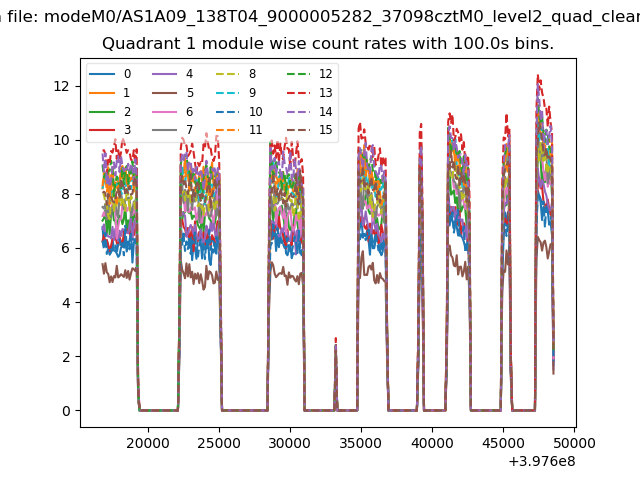 |
 |
| Module-wise count rates for Quadrant C Data is divided into 100 sec bins |
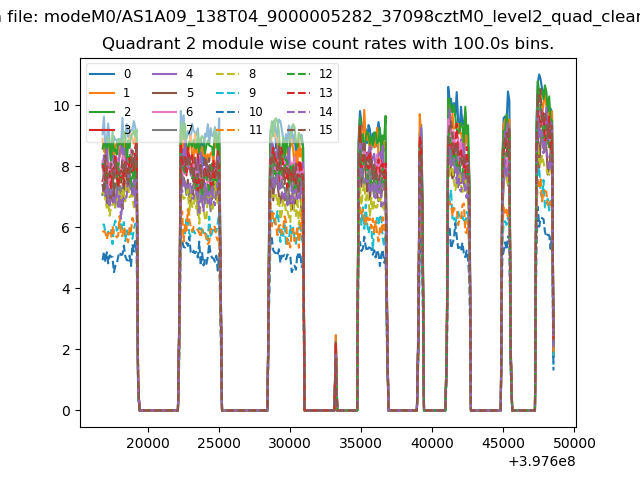 |
 |
| Module-wise count rates for Quadrant D Data is divided into 100 sec bins |
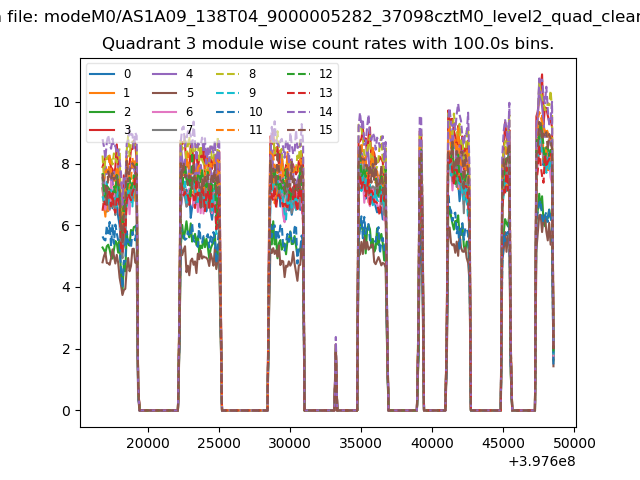 |
 |
| Parameter | Plot |
|---|---|
| CZT HV Monitor | 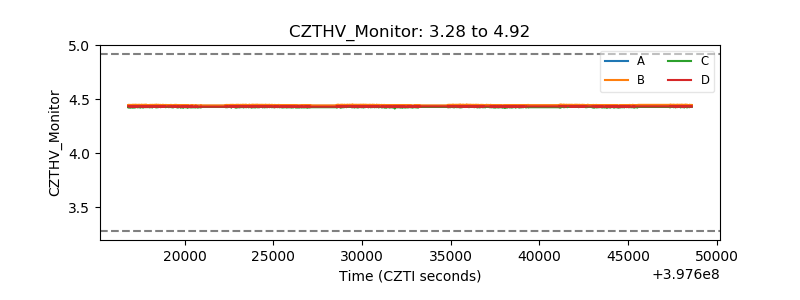 |
| D_VDD | 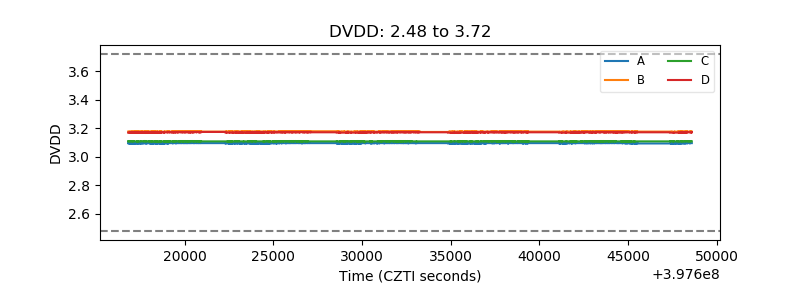 |
| Temperature 1 | 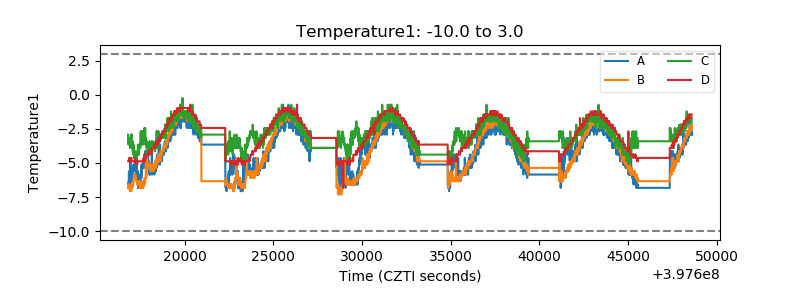 |
| Veto HV Monitor |  |
| Veto LLD | 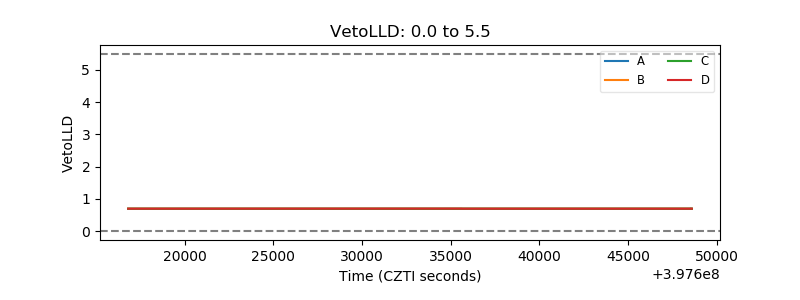 |
| Alpha Counter |  |
| _CPM_Rate |  |
| CZT Counter | 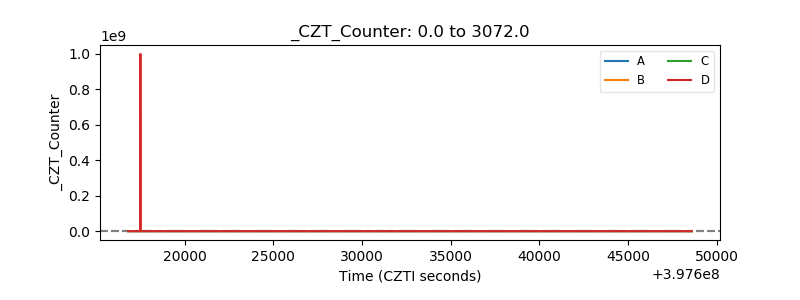 |
| +2.5 Volts monitor | 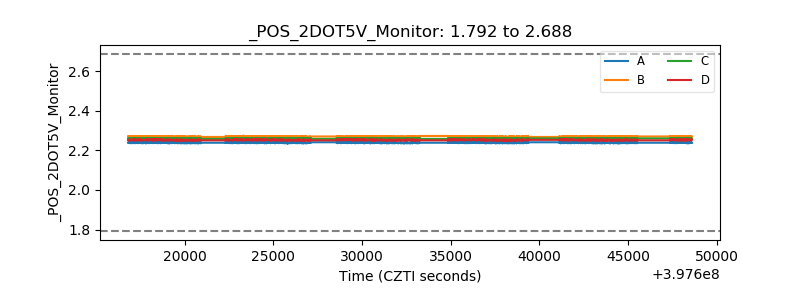 |
| +5 Volts monitor |  |
| _ROLL_ROT | 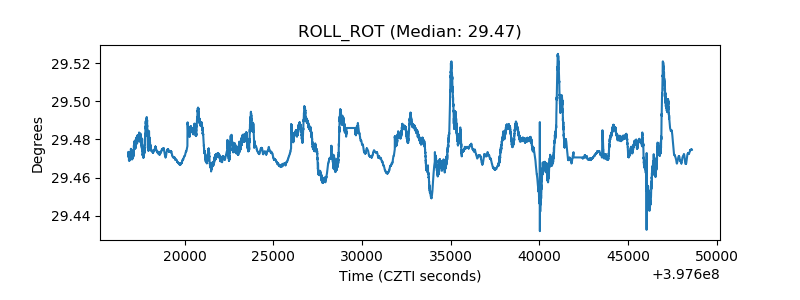 |
| _Roll_DEC | 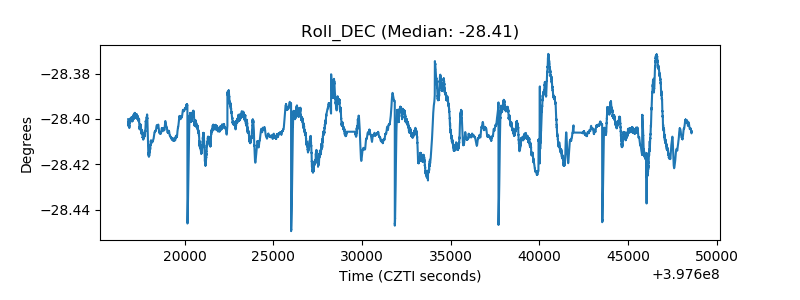 |
| _Roll_RA |  |
| Veto Counter | 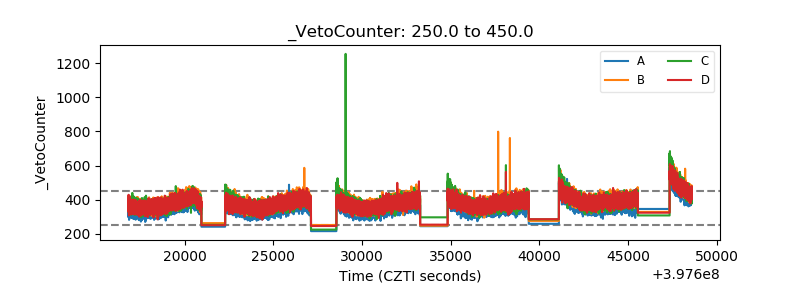 |