| Param | Original file | Final file |
|---|---|---|
| Filename | modeM0/AS1A09_138T04_9000005282_37099cztM0_level2.evt | modeM0/AS1A09_138T04_9000005282_37099cztM0_level2_quad_clean.evt |
| Size (bytes) | 2,133,599,040 | 315,999,360 |
| Size | 2.0 GB | 301.4 MB |
| Events in quadrant A | 15,012,336 | 1,940,344 |
| Events in quadrant B | 15,058,691 | 1,957,142 |
| Events in quadrant C | 14,247,713 | 1,920,987 |
| Events in quadrant D | 18,394,276 | 1,811,899 |
| Mode SS | |||
|---|---|---|---|
| Quadrant | BADHDUFLAG | Total packets | Discarded packets |
| A | 0 | 576 | 0 |
| B | 0 | 576 | 0 |
| C | 0 | 576 | 0 |
| D | 0 | 576 | 0 |
| Mode M0 | |||
|---|---|---|---|
| Quadrant | BADHDUFLAG | Total packets | Discarded packets |
| A | 0 | 61829 | 7 |
| B | 0 | 63024 | 10 |
| C | 0 | 58890 | 6 |
| D | 0 | 73411 | 6 |
| Mode M9 | |||
|---|---|---|---|
| Quadrant | BADHDUFLAG | Total packets | Discarded packets |
| A | 0 | 97 | 0 |
| B | 0 | 97 | 0 |
| C | 0 | 97 | 0 |
| D | 0 | 97 | 0 |
| Quadrant | Total seconds | Saturated seconds | Saturation percentage |
|---|---|---|---|
| A | 28223 | 226 | 0.800765% |
| B | 28222 | 472 | 1.672454% |
| C | 28223 | 84 | 0.297630% |
| D | 28223 | 843 | 2.986926% |
Noise dominated data is calculated using 1-second bins in cleaned event files. If a bin has >2000 counts, and if more than 50% of those come from <1% of pixels, then it is considered to be noise-dominated and hence unusable.
| Quadrant | # 1 sec bins | Bins with >0 counts | Bins with >2000 counts | High rate bins dominated by noise | Noise dominated (total time) | Noise dominated (detector-on time) | Marked lightcurve |
|---|---|---|---|---|---|---|---|
| A | 37962 | 28229 | 165 | 165 | 0.43% | 0.58% | 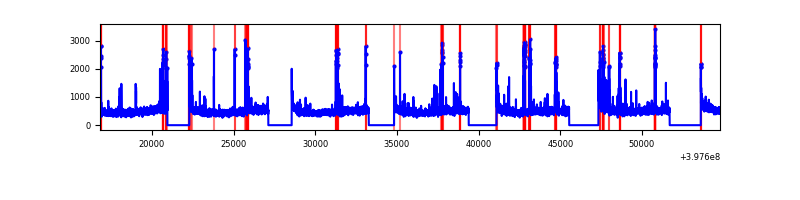 |
| B | 37962 | 28229 | 324 | 324 | 0.85% | 1.15% | 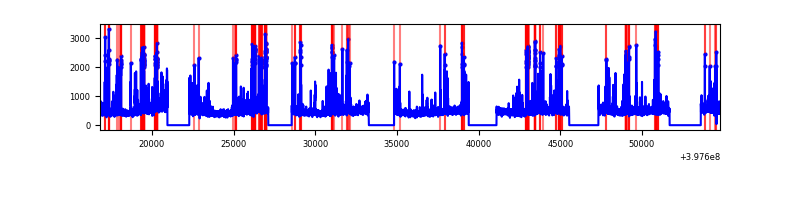 |
| C | 37962 | 28229 | 71 | 71 | 0.19% | 0.25% | 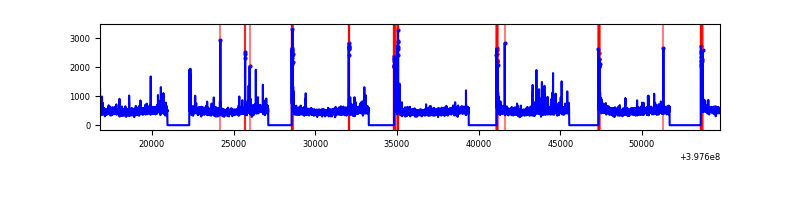 |
| D | 37962 | 28229 | 809 | 809 | 2.13% | 2.87% | 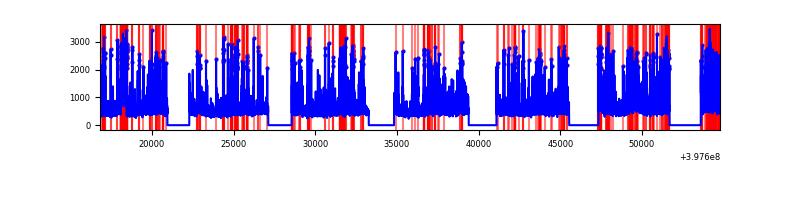 |
Top three noisy pixels from each quadrant. If the there are fewer than three noisy pixels in the level2.evt file, extra rows are filled as -1
| Pixel properties | Quadrant properties | ||||||
|---|---|---|---|---|---|---|---|
| Quadrant | DetID | PixID | Counts | Sigma | Mean | Median | Sigma |
| A | 10 | 83 | 1129616 | 1719.5 | 3312 | 3250 | 655.1 |
| A | 7 | 3 | 527919 | 800.95 | 3312 | 3250 | 655.1 |
| A | 15 | 237 | 332419 | 502.51 | 3312 | 3250 | 655.1 |
| B | 5 | 172 | 1097564 | 1768.6 | 3259 | 3175 | 618.8 |
| B | 5 | 255 | 329035 | 526.61 | 3259 | 3175 | 618.8 |
| B | 0 | 229 | 216339 | 344.49 | 3259 | 3175 | 618.8 |
| C | 15 | 214 | 1192242 | 1619.13 | 3194 | 3220 | 734.4 |
| C | 0 | 10 | 364368 | 491.79 | 3194 | 3220 | 734.4 |
| C | 0 | 207 | 160688 | 214.43 | 3194 | 3220 | 734.4 |
| D | 1 | 52 | 1492454 | 1926.81 | 3207 | 3122 | 773.0 |
| D | 1 | 47 | 1157279 | 1493.18 | 3207 | 3122 | 773.0 |
| D | 13 | 249 | 1025480 | 1322.67 | 3207 | 3122 | 773.0 |
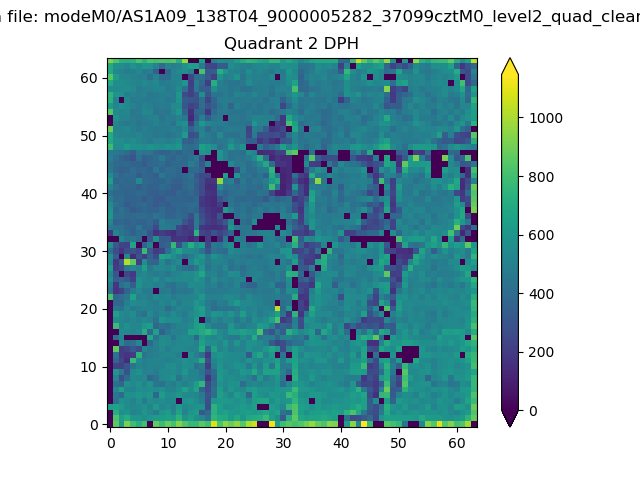
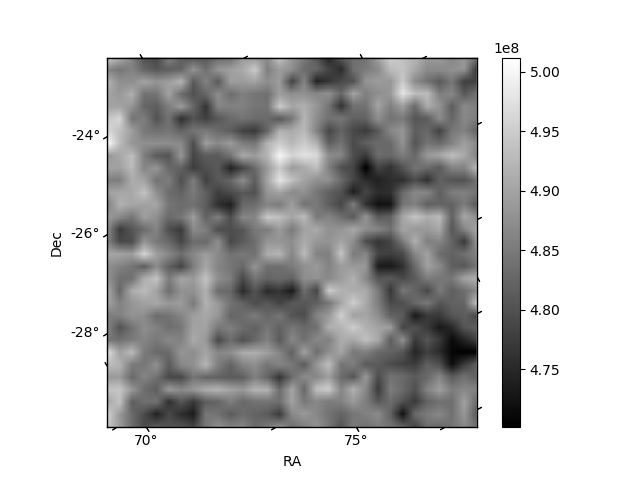
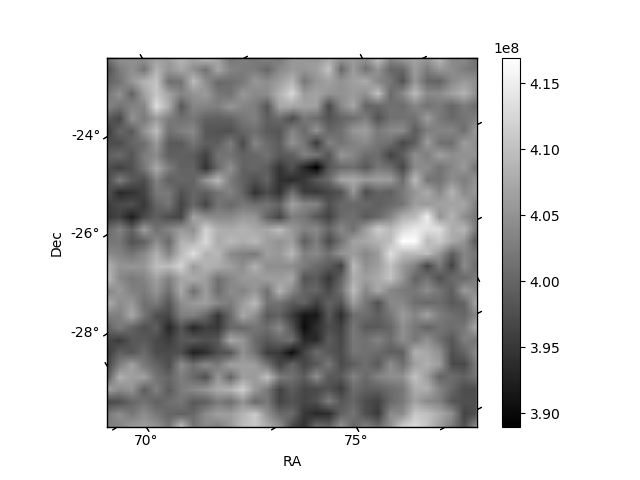
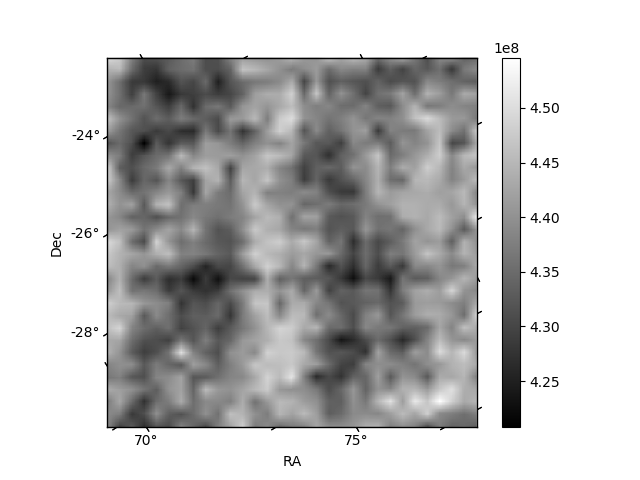
Histogram calculated using DETX and DETY for each event in the final _common_clean file
| Quadrant A | 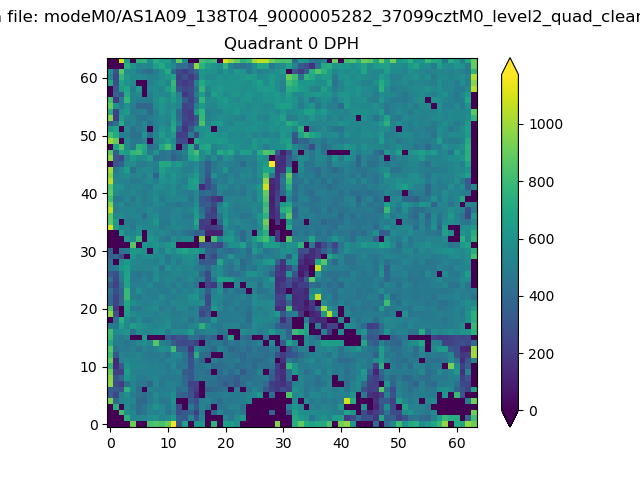 |
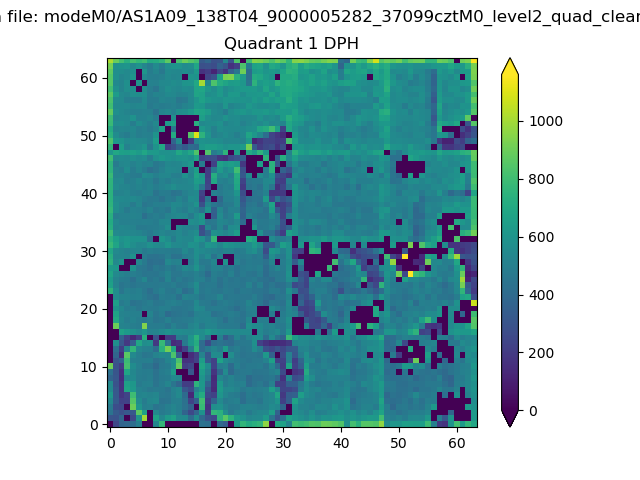 |
Quadrant B |
|---|---|---|---|
| Quadrant D | 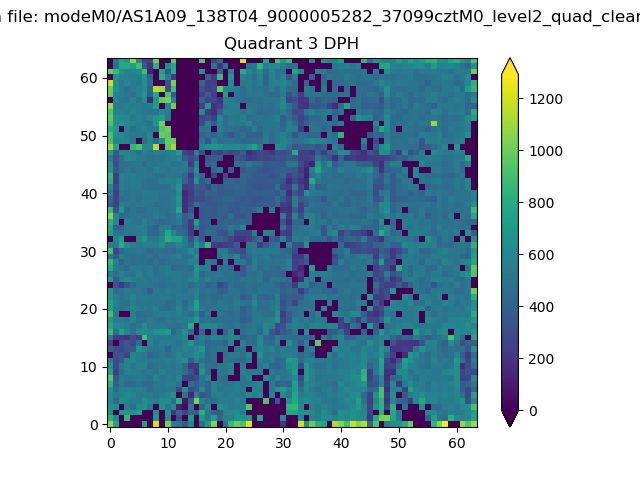 |
 |
Quadrant C |
| Plot type | Count rate plots | Images |
|---|---|---|
| Comparison with Poisson distribution Blue bars denote a histogram of data divided into 1 sec bins. Red curve is a Poisson curve with rate = median count rate of data. |
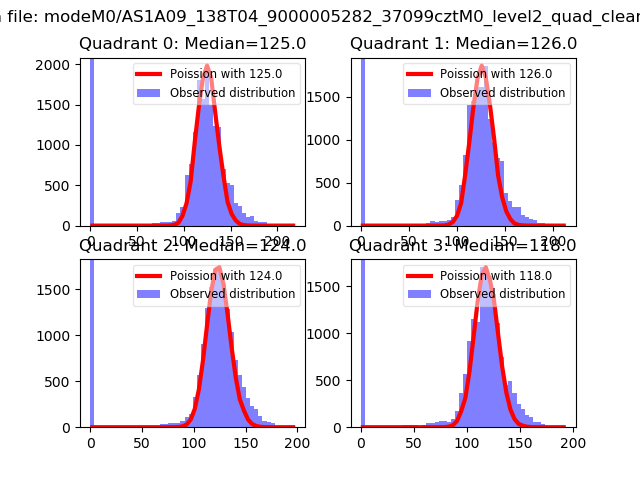 |
 |
| Quadrant-wise count rates Data is divided into 100 sec bins |
 |
|
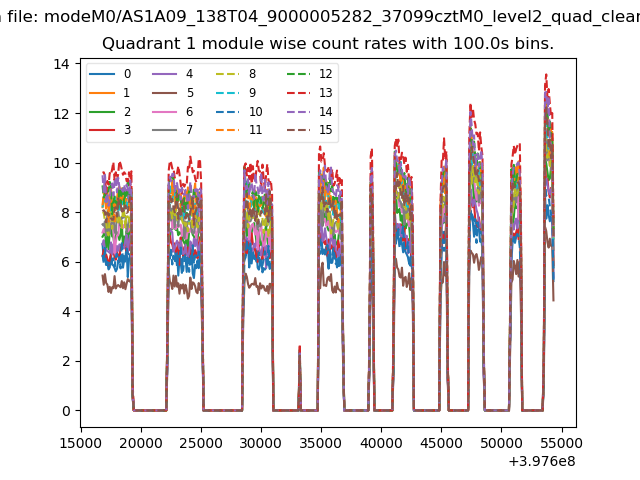
| Module-wise count rates for Quadrant A Data is divided into 100 sec bins |
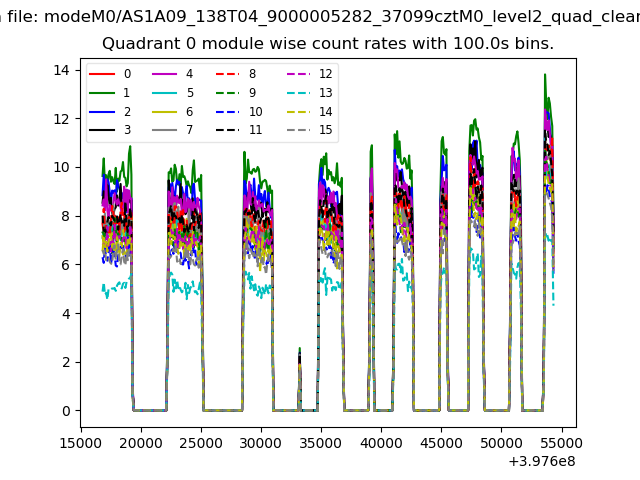 |
 |
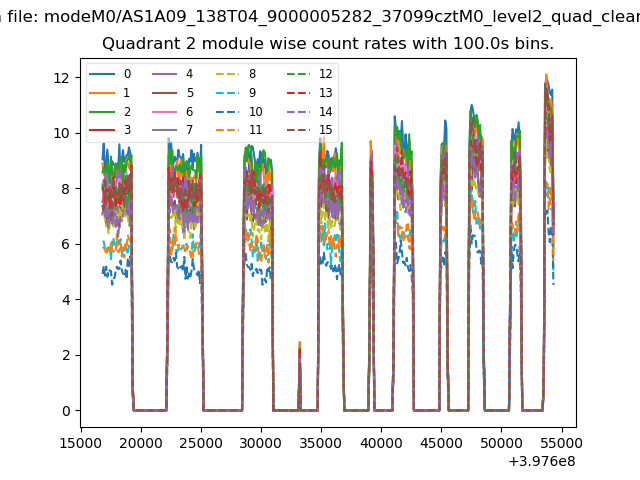
| Module-wise count rates for Quadrant B Data is divided into 100 sec bins |
 |
 |
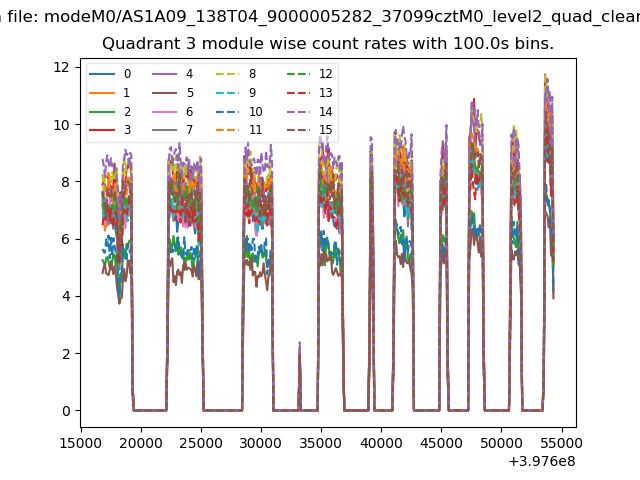
| Module-wise count rates for Quadrant C Data is divided into 100 sec bins |
 |
 |
| Module-wise count rates for Quadrant D Data is divided into 100 sec bins |
 |
 |
| Parameter | Plot |
|---|---|
| CZT HV Monitor | 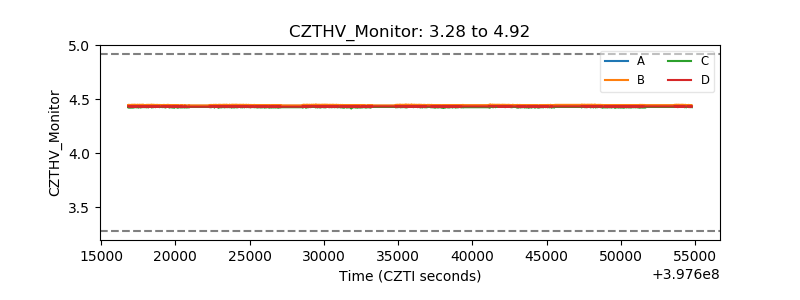 |
| D_VDD | 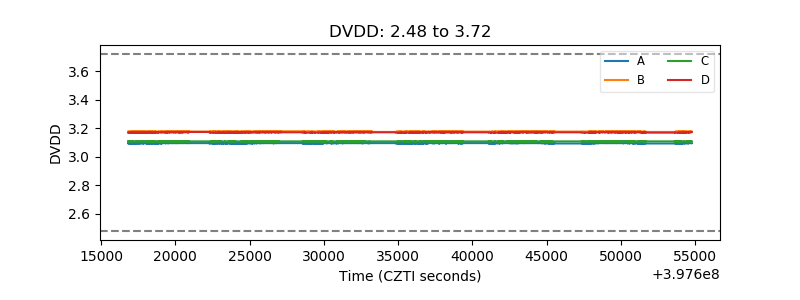 |
| Temperature 1 | 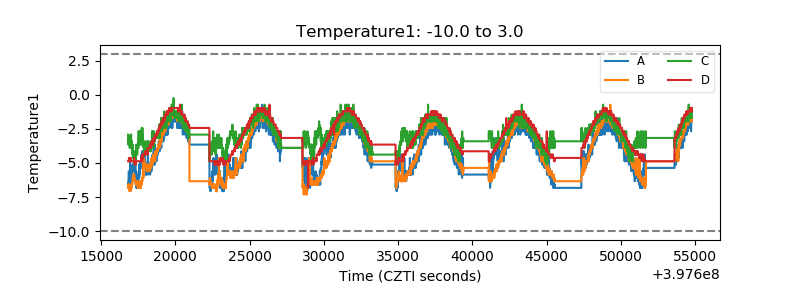 |
| Veto HV Monitor | 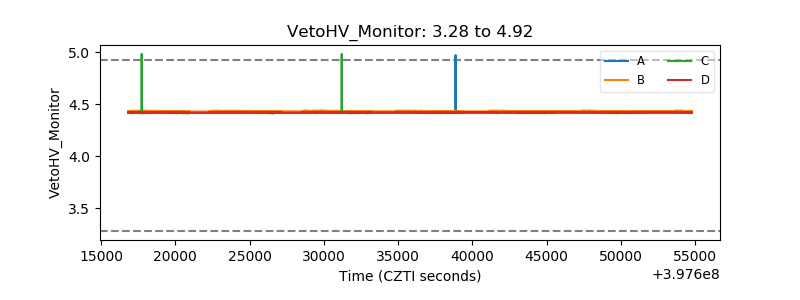 |
| Veto LLD | 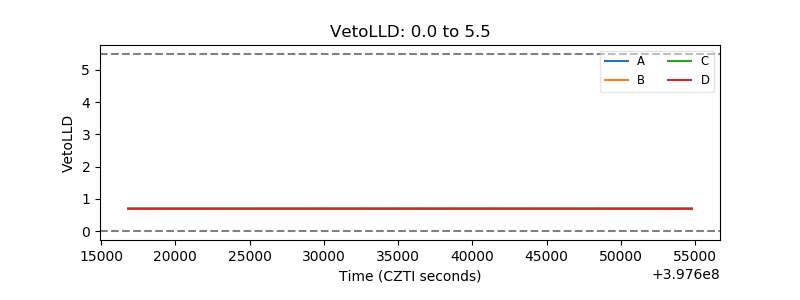 |
| Alpha Counter | 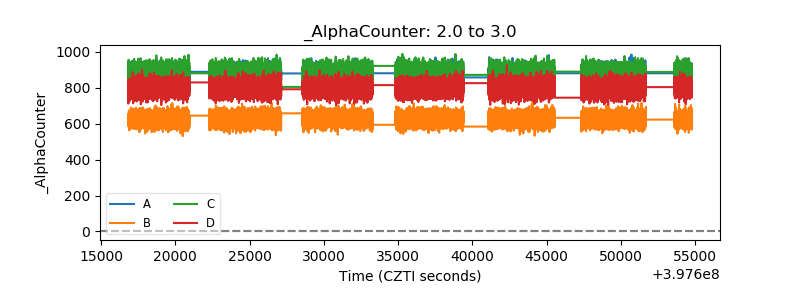 |
| _CPM_Rate | 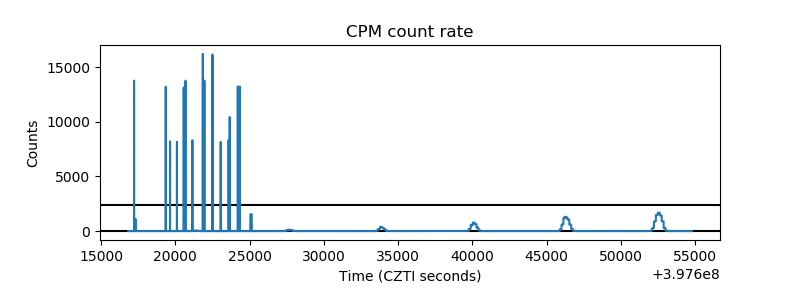 |
| CZT Counter | 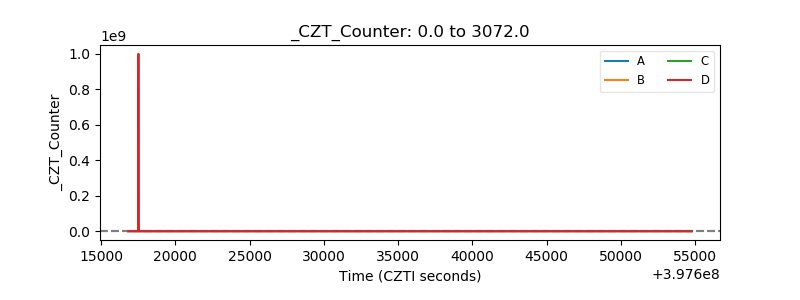 |
| +2.5 Volts monitor |  |
| +5 Volts monitor | 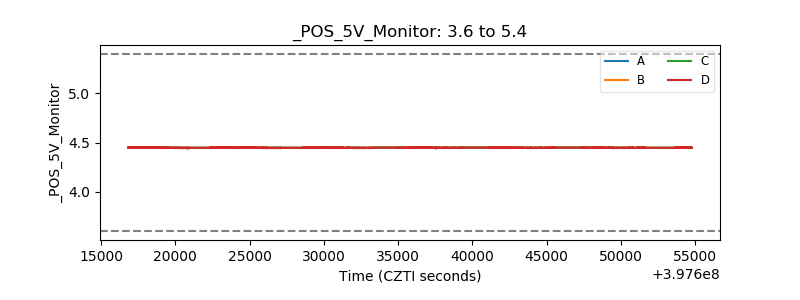 |
| _ROLL_ROT | 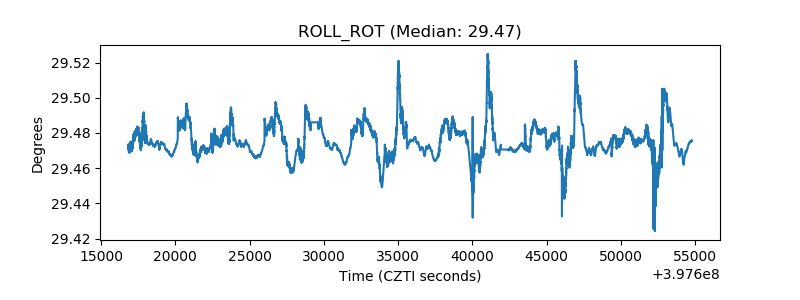 |
| _Roll_DEC | 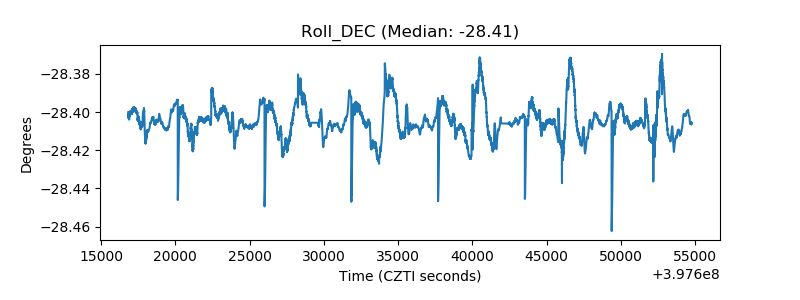 |
| _Roll_RA | 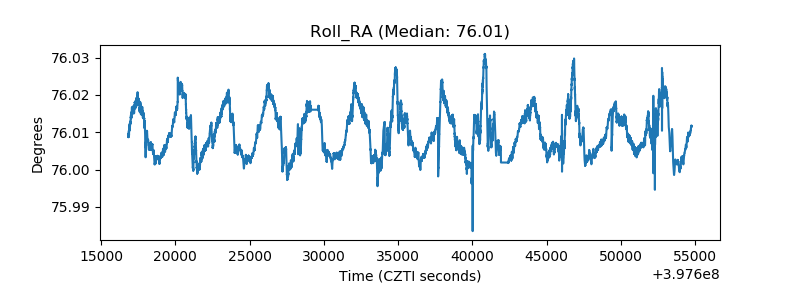 |
| Veto Counter | 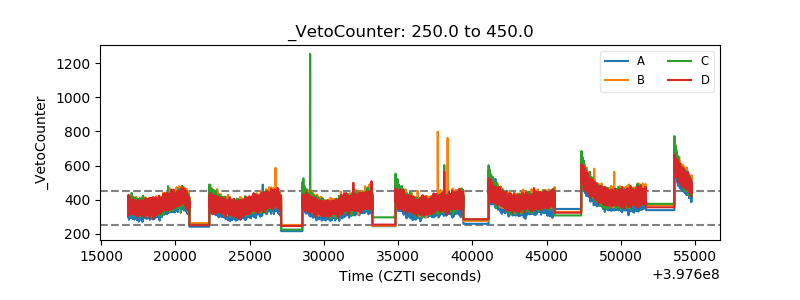 |