| Param | Original file | Final file |
|---|---|---|
| Filename | modeM0/AS1A09_138T04_9000005282_37100cztM0_level2.evt | modeM0/AS1A09_138T04_9000005282_37100cztM0_level2_quad_clean.evt |
| Size (bytes) | 452,099,520 | 58,371,840 |
| Size | 431.2 MB | 55.7 MB |
| Events in quadrant A | 3,017,847 | 360,064 |
| Events in quadrant B | 3,075,641 | 361,129 |
| Events in quadrant C | 2,871,224 | 345,019 |
| Events in quadrant D | 4,364,351 | 326,504 |
| Mode SS | |||
|---|---|---|---|
| Quadrant | BADHDUFLAG | Total packets | Discarded packets |
| A | 0 | 110 | 0 |
| B | 0 | 110 | 0 |
| C | 0 | 110 | 0 |
| D | 0 | 110 | 0 |
| Mode M0 | |||
|---|---|---|---|
| Quadrant | BADHDUFLAG | Total packets | Discarded packets |
| A | 0 | 12071 | 3 |
| B | 0 | 12243 | 2 |
| C | 0 | 11409 | 2 |
| D | 0 | 16681 | 2 |
| Mode M9 | |||
|---|---|---|---|
| Quadrant | BADHDUFLAG | Total packets | Discarded packets |
| A | 0 | 24 | 0 |
| B | 0 | 24 | 0 |
| C | 0 | 24 | 0 |
| D | 0 | 25 | 0 |
| Quadrant | Total seconds | Saturated seconds | Saturation percentage |
|---|---|---|---|
| A | 5344 | 16 | 0.299401% |
| B | 5344 | 41 | 0.767216% |
| C | 5344 | 13 | 0.243263% |
| D | 5344 | 208 | 3.892216% |
Noise dominated data is calculated using 1-second bins in cleaned event files. If a bin has >2000 counts, and if more than 50% of those come from <1% of pixels, then it is considered to be noise-dominated and hence unusable.
| Quadrant | # 1 sec bins | Bins with >0 counts | Bins with >2000 counts | High rate bins dominated by noise | Noise dominated (total time) | Noise dominated (detector-on time) | Marked lightcurve |
|---|---|---|---|---|---|---|---|
| A | 7377 | 5345 | 9 | 9 | 0.12% | 0.17% | 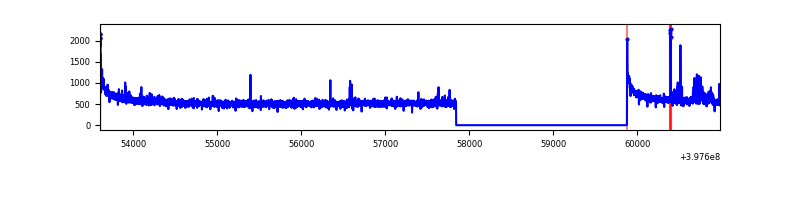 |
| B | 7377 | 5345 | 25 | 25 | 0.34% | 0.47% | 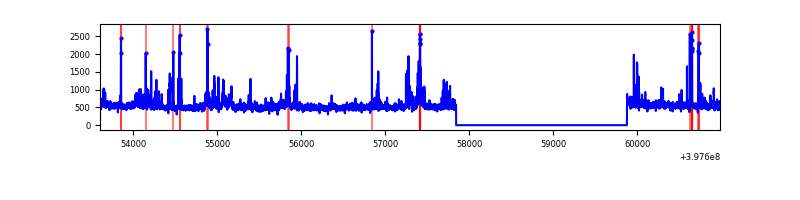 |
| C | 7377 | 5345 | 10 | 10 | 0.14% | 0.19% | 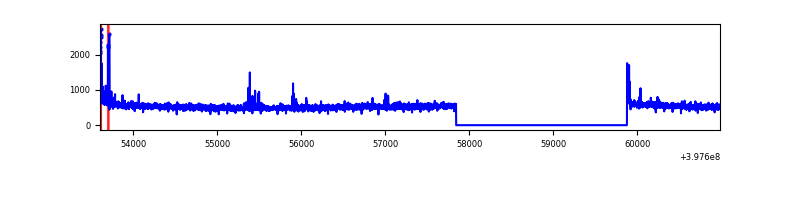 |
| D | 7377 | 5345 | 197 | 197 | 2.67% | 3.69% | 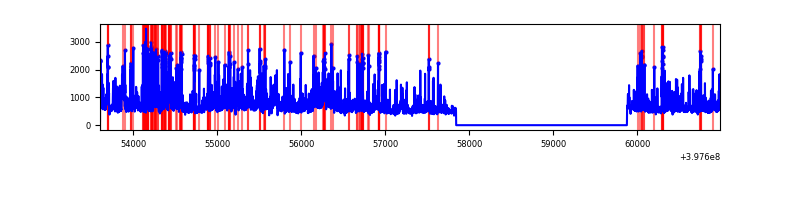 |
Top three noisy pixels from each quadrant. If the there are fewer than three noisy pixels in the level2.evt file, extra rows are filled as -1
| Pixel properties | Quadrant properties | ||||||
|---|---|---|---|---|---|---|---|
| Quadrant | DetID | PixID | Counts | Sigma | Mean | Median | Sigma |
| A | 10 | 83 | 268403 | 1939.71 | 691 | 680 | 138.0 |
| A | 7 | 3 | 46471 | 331.77 | 691 | 680 | 138.0 |
| A | 13 | 6 | 12188 | 83.38 | 691 | 680 | 138.0 |
| B | 5 | 255 | 96833 | 752.67 | 676 | 661 | 127.8 |
| B | 5 | 172 | 95498 | 742.22 | 676 | 661 | 127.8 |
| B | 5 | 184 | 79302 | 615.47 | 676 | 661 | 127.8 |
| C | 15 | 214 | 230651 | 1527.04 | 652 | 657 | 150.6 |
| C | 0 | 10 | 77467 | 509.98 | 652 | 657 | 150.6 |
| C | 0 | 207 | 8949 | 55.05 | 652 | 657 | 150.6 |
| D | 1 | 52 | 613636 | 3875.19 | 659 | 643 | 158.2 |
| D | 12 | 235 | 290604 | 1833.06 | 659 | 643 | 158.2 |
| D | 2 | 249 | 236944 | 1493.84 | 659 | 643 | 158.2 |
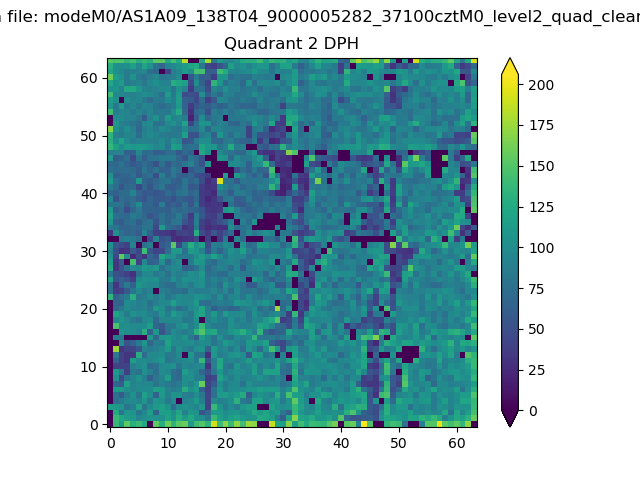
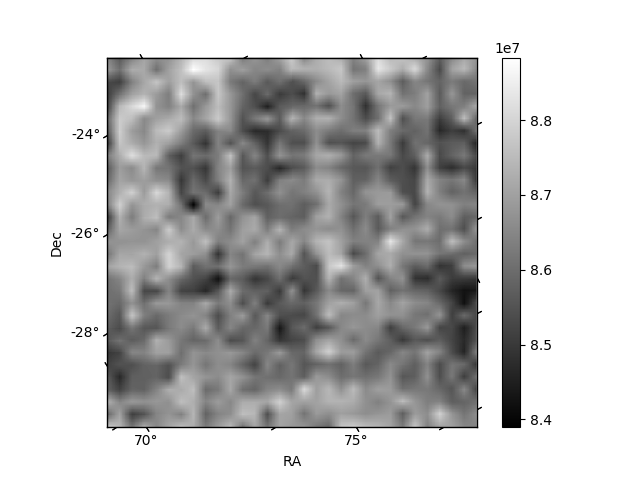
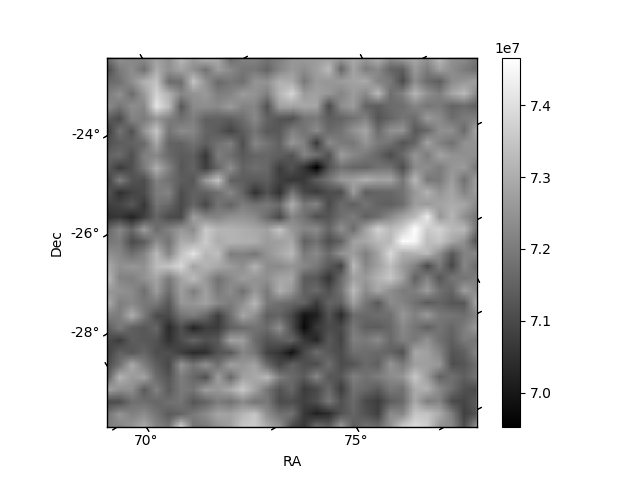
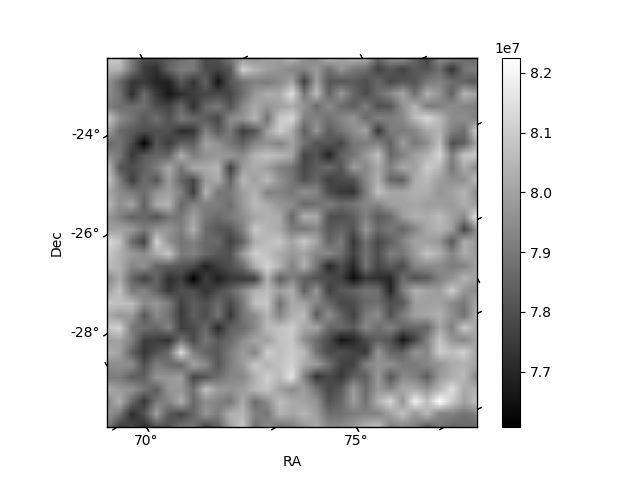
Histogram calculated using DETX and DETY for each event in the final _common_clean file
| Quadrant A | 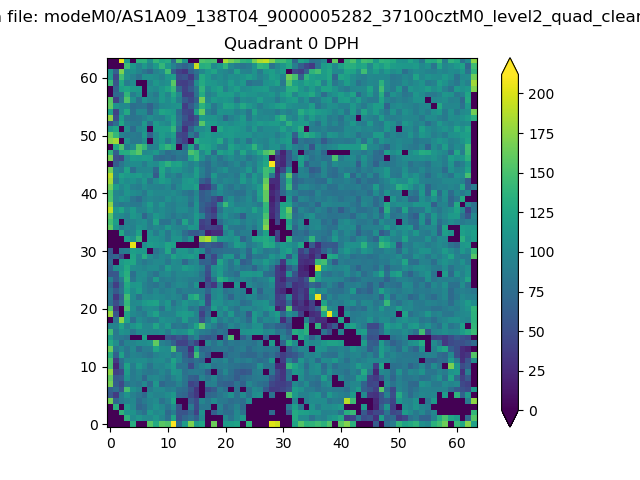 |
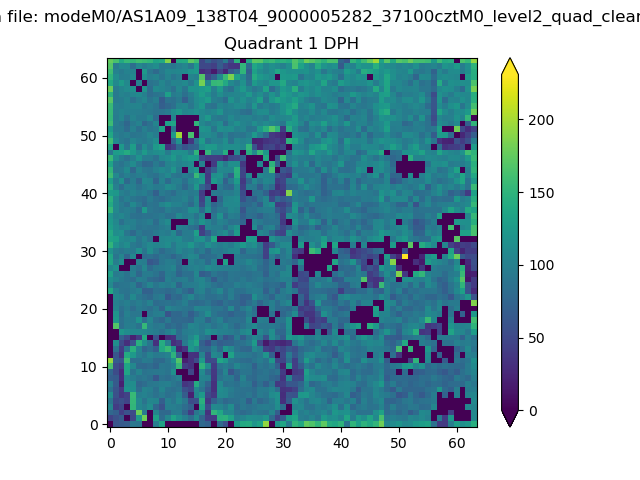 |
Quadrant B |
|---|---|---|---|
| Quadrant D | 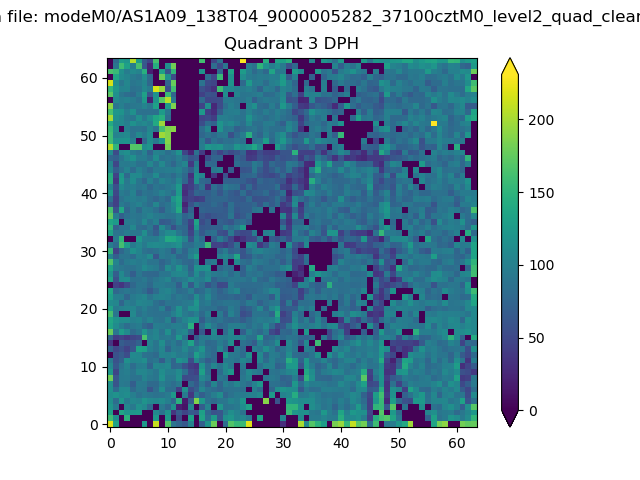 |
 |
Quadrant C |
| Plot type | Count rate plots | Images |
|---|---|---|
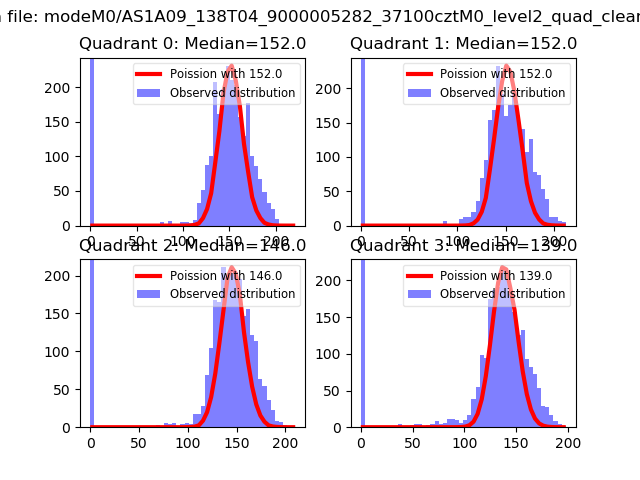
| Comparison with Poisson distribution Blue bars denote a histogram of data divided into 1 sec bins. Red curve is a Poisson curve with rate = median count rate of data. |
 |
 |
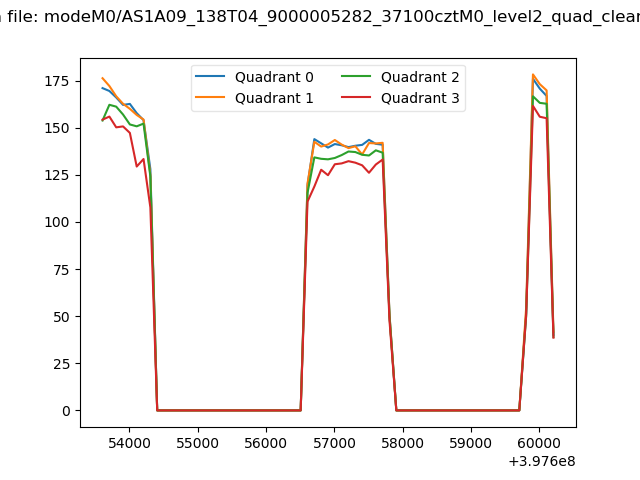
| Quadrant-wise count rates Data is divided into 100 sec bins |
 |
|
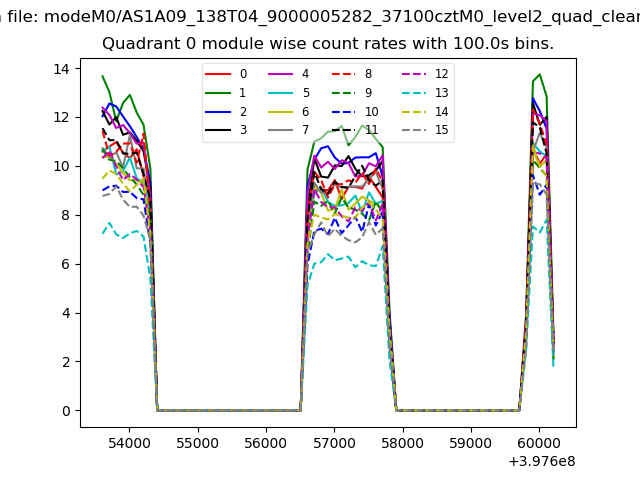
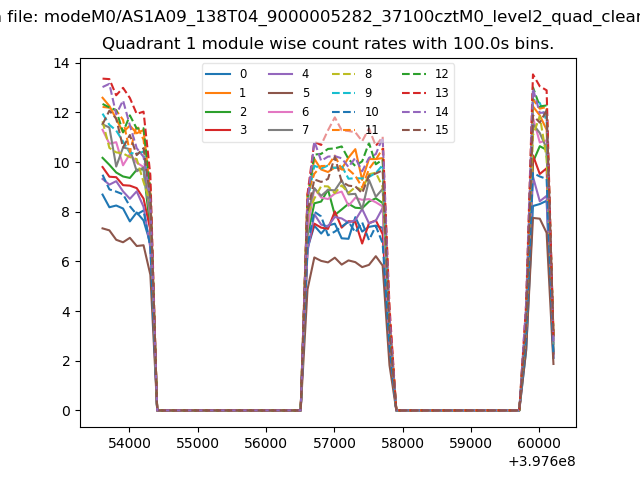
| Module-wise count rates for Quadrant A Data is divided into 100 sec bins |
 |
 |
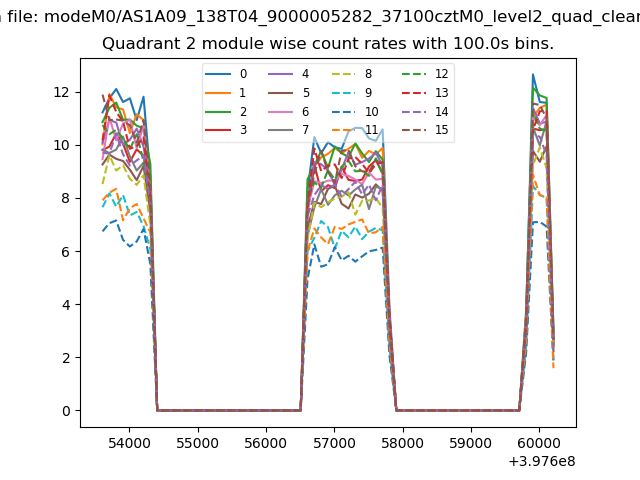
| Module-wise count rates for Quadrant B Data is divided into 100 sec bins |
 |
 |
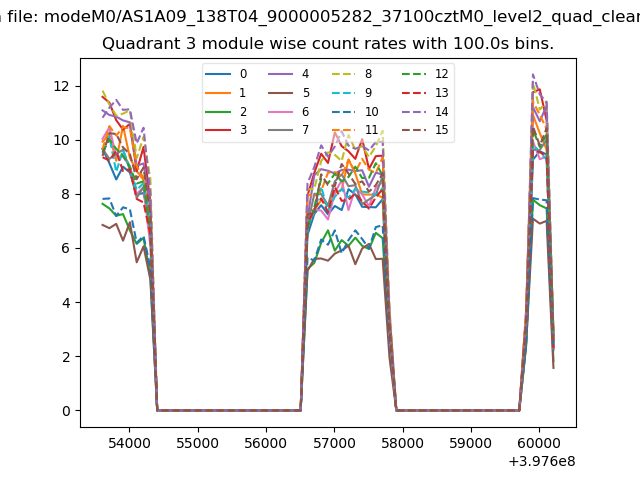
| Module-wise count rates for Quadrant C Data is divided into 100 sec bins |
 |
 |
| Module-wise count rates for Quadrant D Data is divided into 100 sec bins |
 |
 |
| Parameter | Plot |
|---|---|
| CZT HV Monitor | 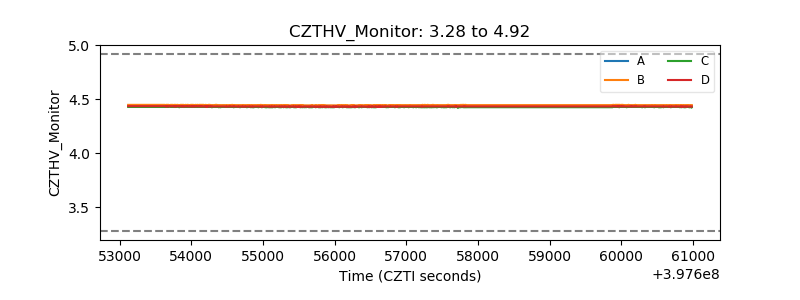 |
| D_VDD | 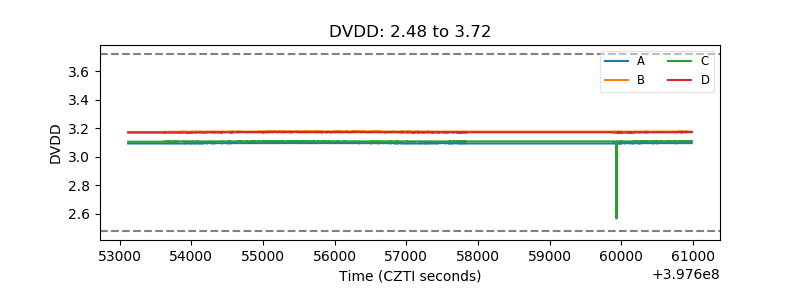 |
| Temperature 1 | 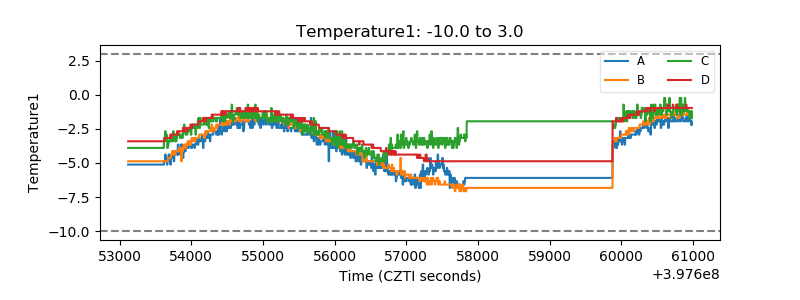 |
| Veto HV Monitor | 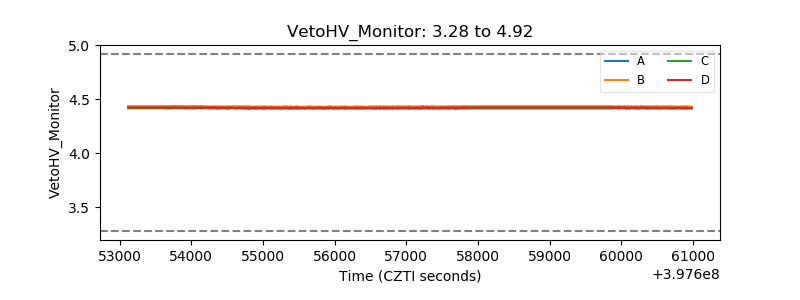 |
| Veto LLD | 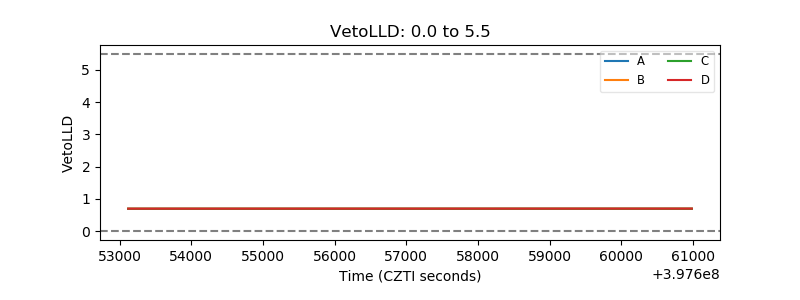 |
| Alpha Counter | 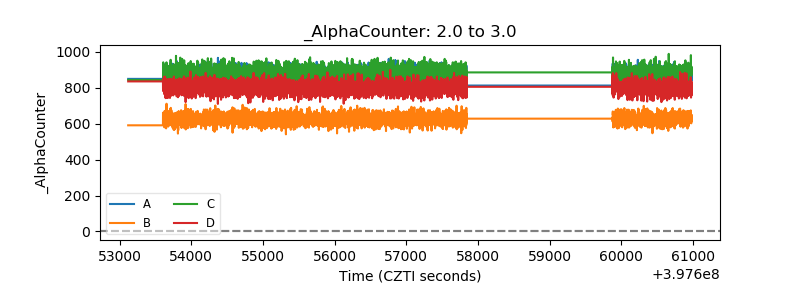 |
| _CPM_Rate | 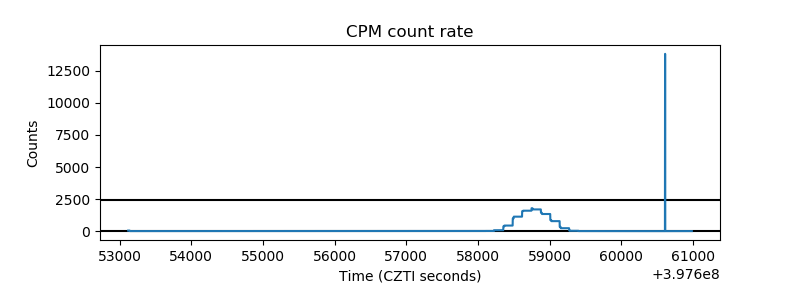 |
| CZT Counter | 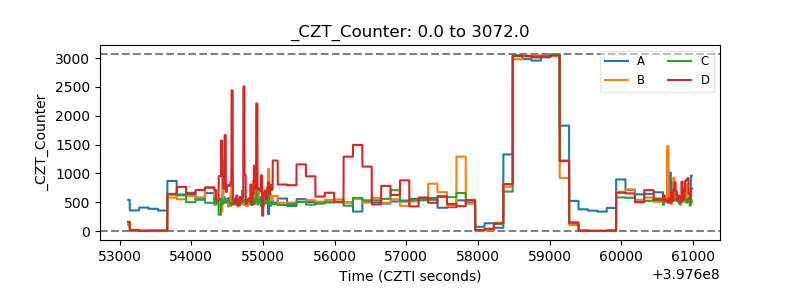 |
| +2.5 Volts monitor |  |
| +5 Volts monitor |  |
| _ROLL_ROT | 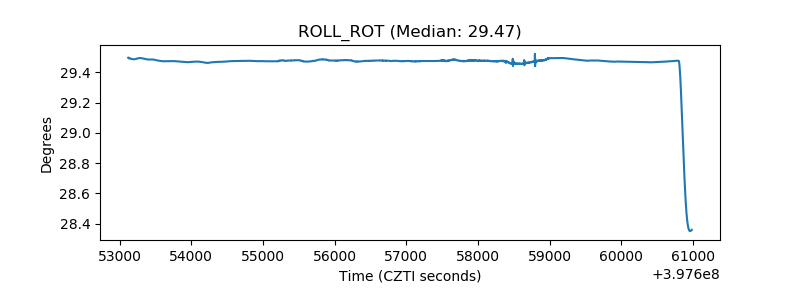 |
| _Roll_DEC | 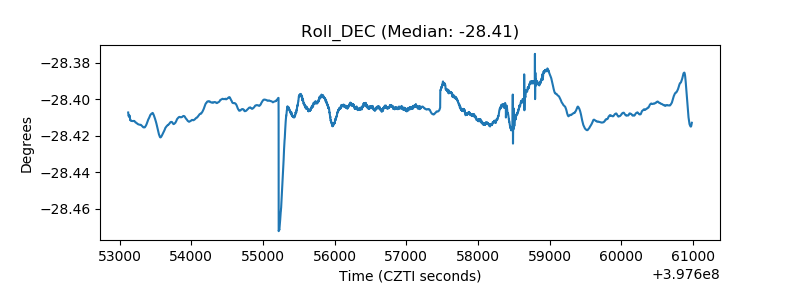 |
| _Roll_RA | 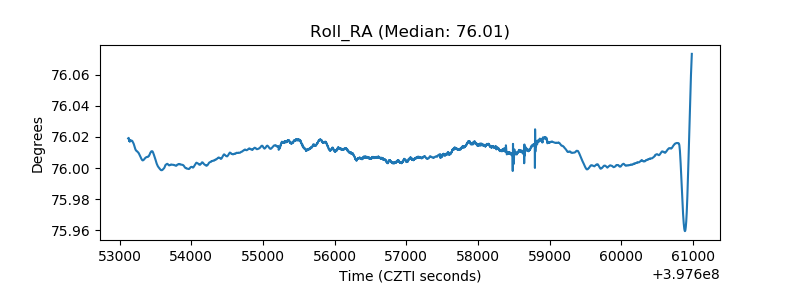 |
| Veto Counter | 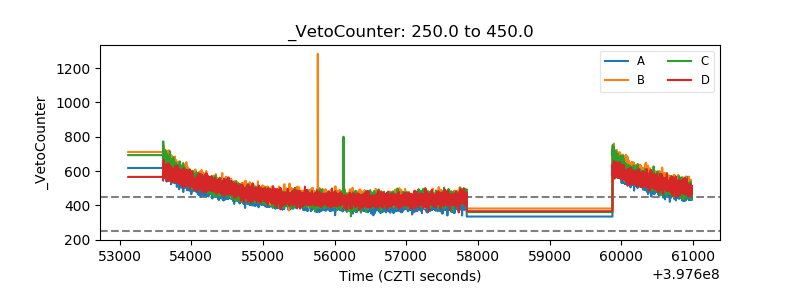 |