| Param | Original file | Final file |
|---|---|---|
| Filename | modeM0/AS1A09_138T04_9000005282_37101cztM0_level2.evt | modeM0/AS1A09_138T04_9000005282_37101cztM0_level2_quad_clean.evt |
| Size (bytes) | 445,703,040 | 48,136,320 |
| Size | 425.1 MB | 45.9 MB |
| Events in quadrant A | 3,055,017 | 284,217 |
| Events in quadrant B | 3,042,337 | 285,719 |
| Events in quadrant C | 2,746,735 | 271,082 |
| Events in quadrant D | 4,306,859 | 257,510 |
| Mode SS | |||
|---|---|---|---|
| Quadrant | BADHDUFLAG | Total packets | Discarded packets |
| A | 0 | 104 | 0 |
| B | 0 | 104 | 0 |
| C | 0 | 104 | 0 |
| D | 0 | 104 | 0 |
| Mode M0 | |||
|---|---|---|---|
| Quadrant | BADHDUFLAG | Total packets | Discarded packets |
| A | 0 | 12137 | 3 |
| B | 0 | 11977 | 2 |
| C | 0 | 10937 | 2 |
| D | 0 | 16210 | 2 |
| Mode M9 | |||
|---|---|---|---|
| Quadrant | BADHDUFLAG | Total packets | Discarded packets |
| A | 0 | 26 | 0 |
| B | 0 | 26 | 0 |
| C | 0 | 26 | 0 |
| D | 0 | 27 | 0 |
| Quadrant | Total seconds | Saturated seconds | Saturation percentage |
|---|---|---|---|
| A | 5117 | 40 | 0.781708% |
| B | 5117 | 107 | 2.091069% |
| C | 5117 | 2 | 0.039085% |
| D | 5117 | 351 | 6.859488% |
Noise dominated data is calculated using 1-second bins in cleaned event files. If a bin has >2000 counts, and if more than 50% of those come from <1% of pixels, then it is considered to be noise-dominated and hence unusable.
| Quadrant | # 1 sec bins | Bins with >0 counts | Bins with >2000 counts | High rate bins dominated by noise | Noise dominated (total time) | Noise dominated (detector-on time) | Marked lightcurve |
|---|---|---|---|---|---|---|---|
| A | 7241 | 5118 | 30 | 30 | 0.41% | 0.59% | 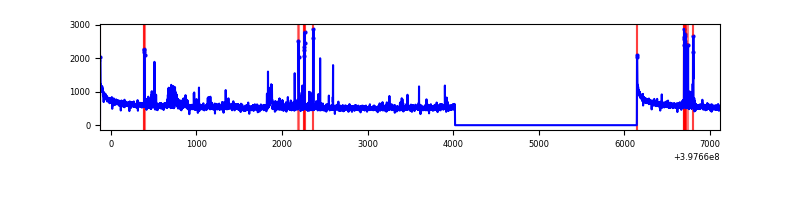 |
| B | 7241 | 5118 | 76 | 76 | 1.05% | 1.48% | 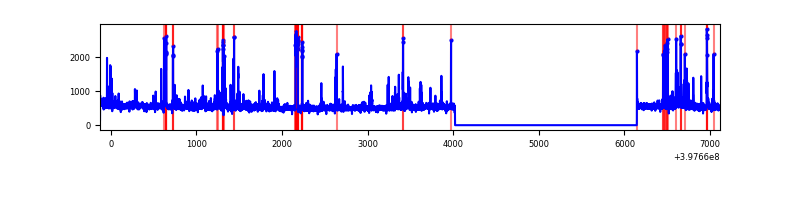 |
| C | 7241 | 5118 | 0 | 0 | 0.00% | 0.00% | 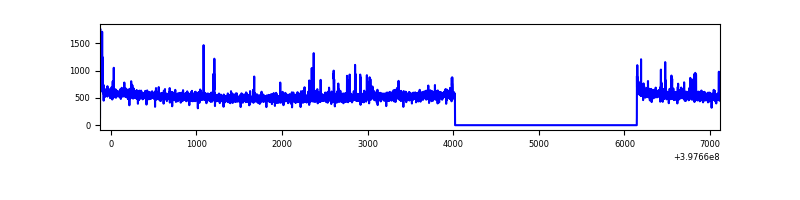 |
| D | 7240 | 5117 | 342 | 342 | 4.72% | 6.68% | 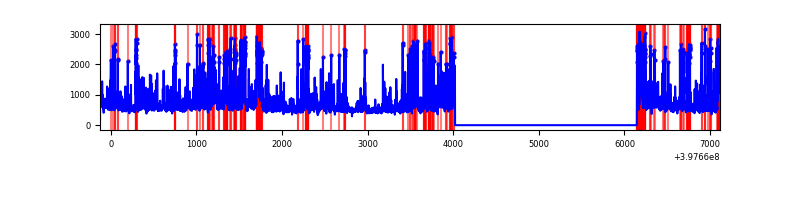 |
Top three noisy pixels from each quadrant. If the there are fewer than three noisy pixels in the level2.evt file, extra rows are filled as -1
| Pixel properties | Quadrant properties | ||||||
|---|---|---|---|---|---|---|---|
| Quadrant | DetID | PixID | Counts | Sigma | Mean | Median | Sigma |
| A | 10 | 83 | 266922 | 1993.13 | 664 | 654 | 133.6 |
| A | 7 | 3 | 122678 | 913.4 | 664 | 654 | 133.6 |
| A | 15 | 237 | 58701 | 434.51 | 664 | 654 | 133.6 |
| B | 5 | 172 | 206139 | 1664.74 | 652 | 639 | 123.4 |
| B | 5 | 184 | 59640 | 477.96 | 652 | 639 | 123.4 |
| B | 0 | 190 | 59472 | 476.6 | 652 | 639 | 123.4 |
| C | 15 | 214 | 221942 | 1519.94 | 628 | 632 | 145.6 |
| C | 0 | 207 | 35633 | 240.38 | 628 | 632 | 145.6 |
| C | 0 | 10 | 19709 | 131.02 | 628 | 632 | 145.6 |
| D | 1 | 52 | 766605 | 5095.95 | 622 | 608 | 150.3 |
| D | 13 | 249 | 221897 | 1472.17 | 622 | 608 | 150.3 |
| D | 1 | 47 | 220213 | 1460.97 | 622 | 608 | 150.3 |
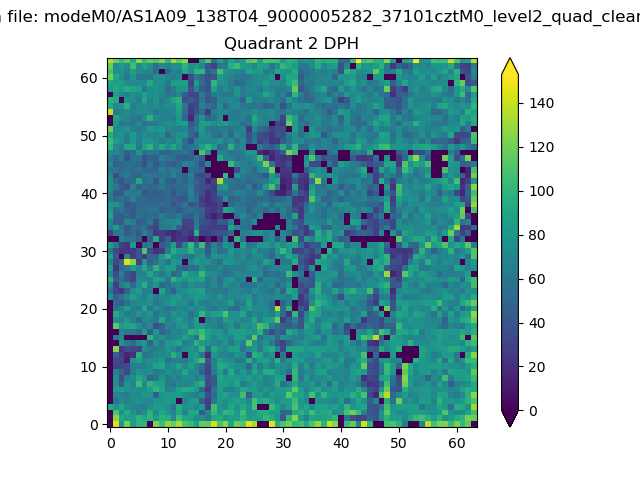
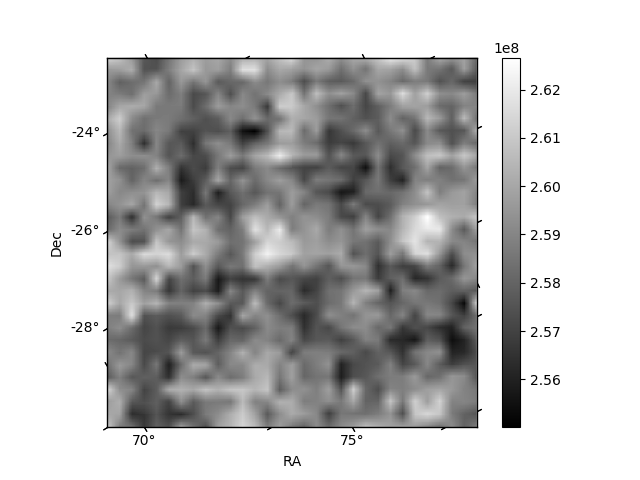
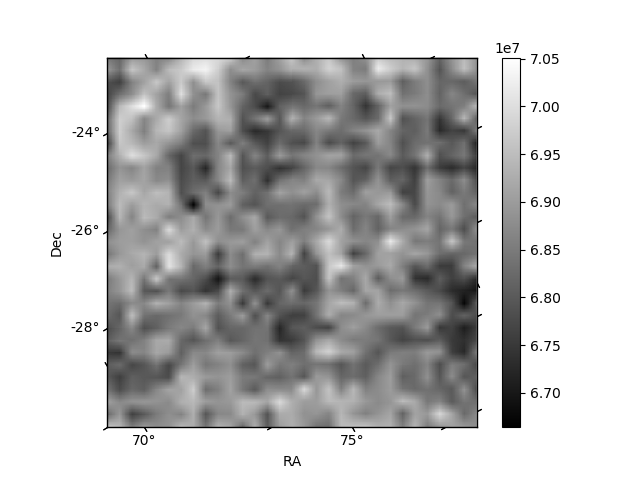
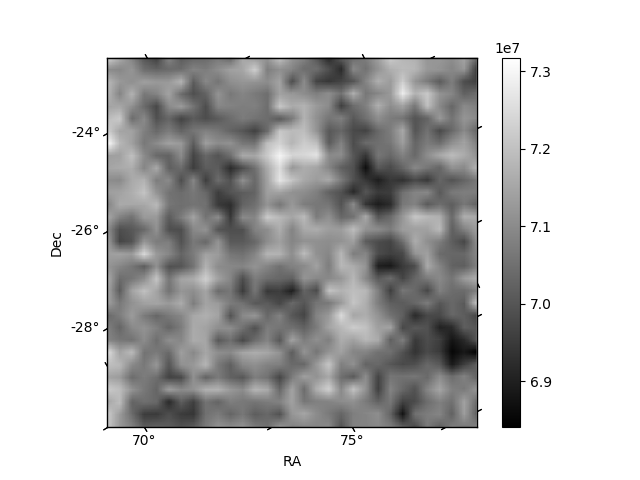
Histogram calculated using DETX and DETY for each event in the final _common_clean file
| Quadrant A | 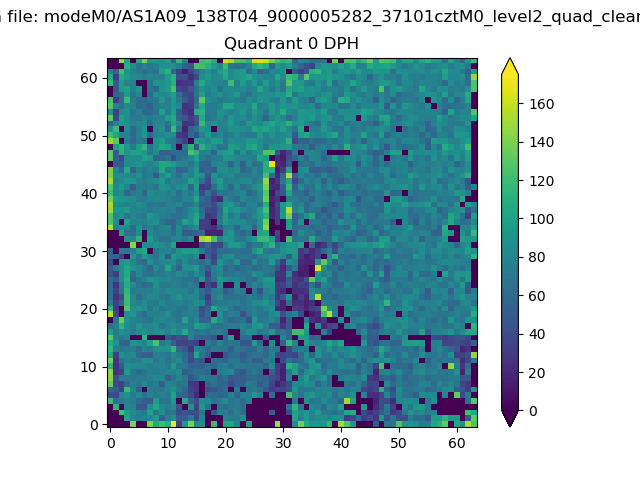 |
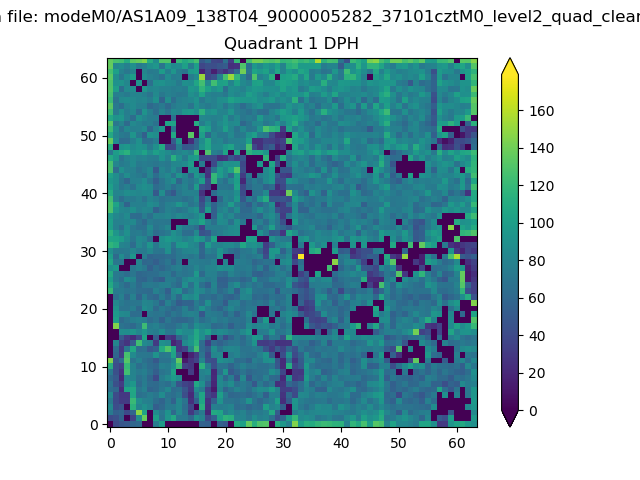 |
Quadrant B |
|---|---|---|---|
| Quadrant D | 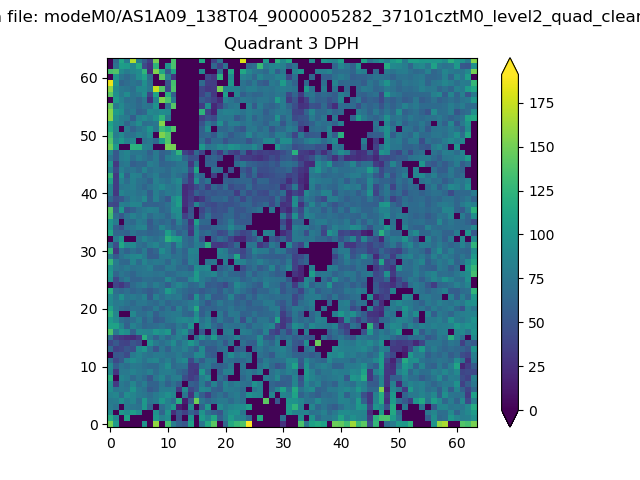 |
 |
Quadrant C |
| Plot type | Count rate plots | Images |
|---|---|---|
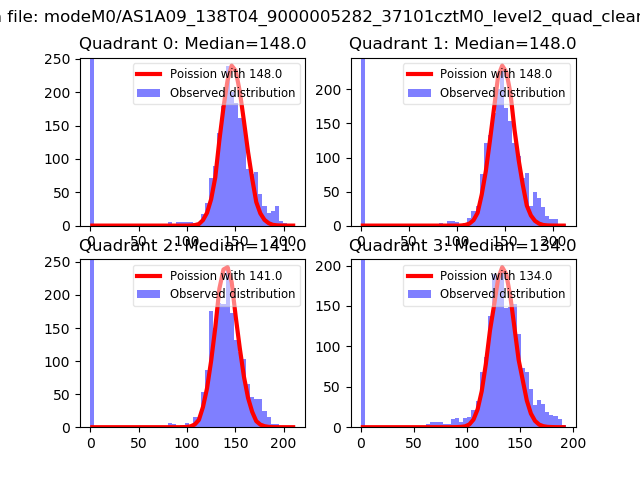
| Comparison with Poisson distribution Blue bars denote a histogram of data divided into 1 sec bins. Red curve is a Poisson curve with rate = median count rate of data. |
 |
 |
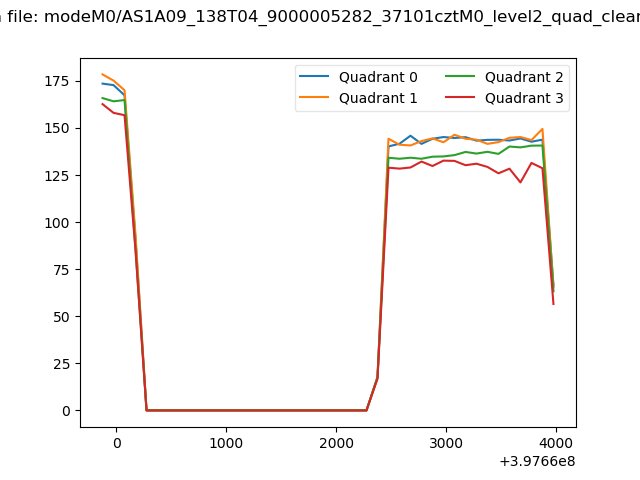
| Quadrant-wise count rates Data is divided into 100 sec bins |
 |
|
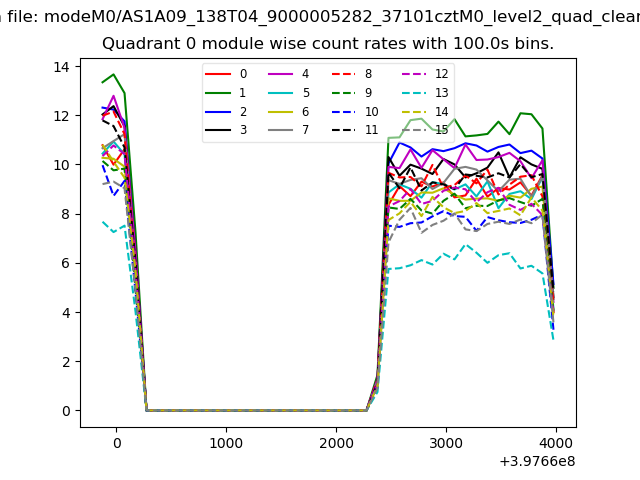
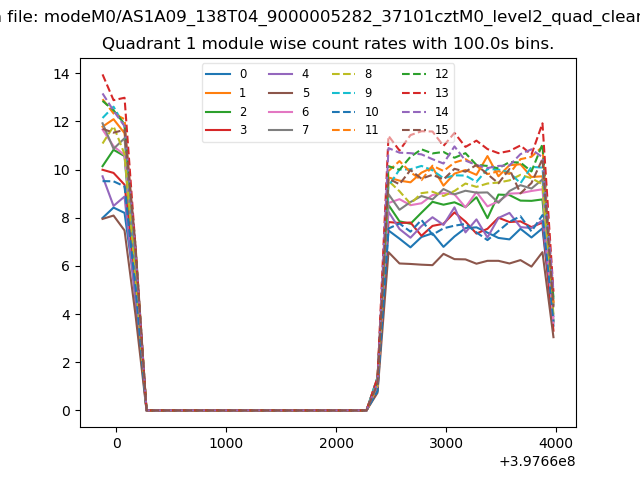
| Module-wise count rates for Quadrant A Data is divided into 100 sec bins |
 |
 |
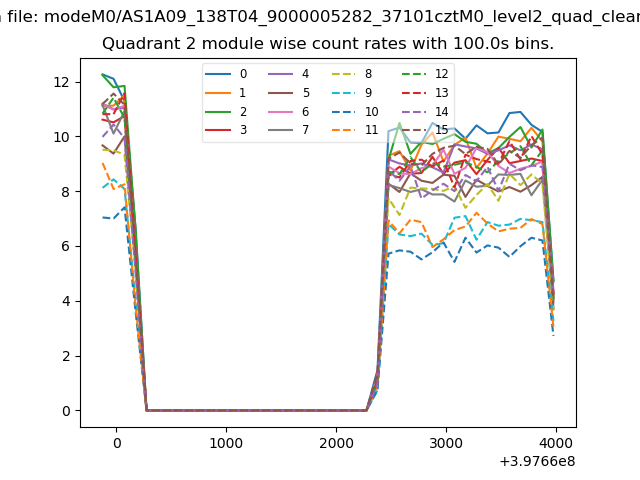
| Module-wise count rates for Quadrant B Data is divided into 100 sec bins |
 |
 |
| Module-wise count rates for Quadrant C Data is divided into 100 sec bins |
 |
 |
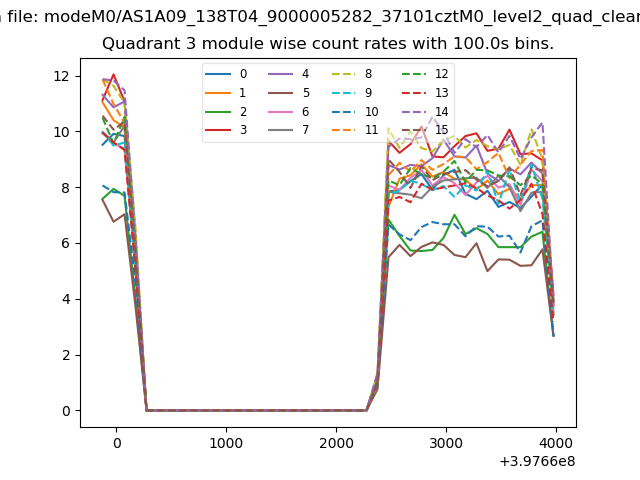
| Module-wise count rates for Quadrant D Data is divided into 100 sec bins |
 |
 |
| Parameter | Plot |
|---|---|
| CZT HV Monitor | 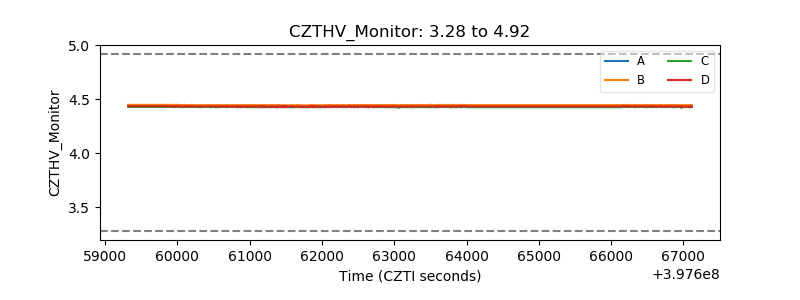 |
| D_VDD | 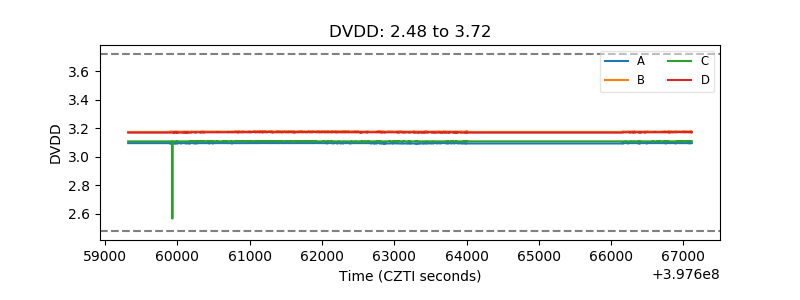 |
| Temperature 1 | 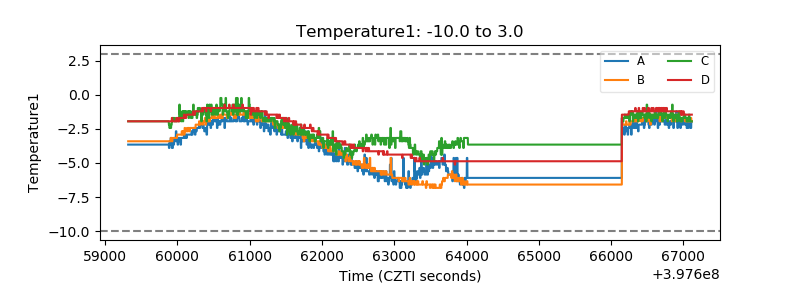 |
| Veto HV Monitor | 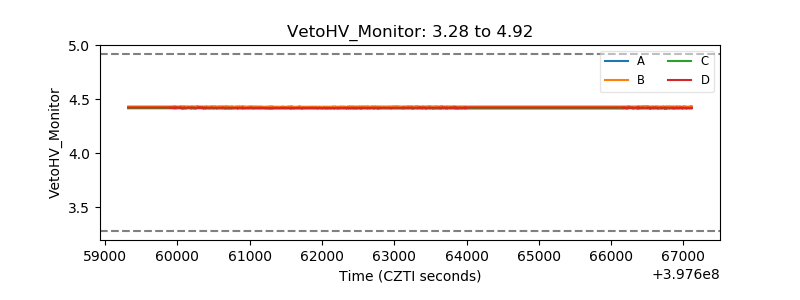 |
| Veto LLD | 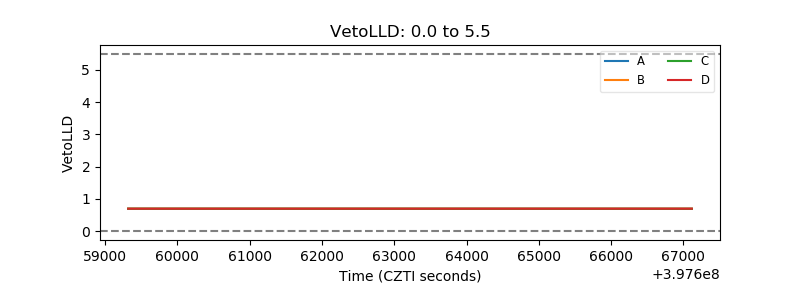 |
| Alpha Counter | 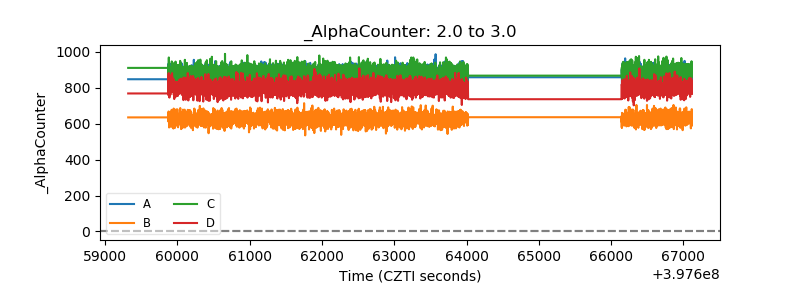 |
| _CPM_Rate | 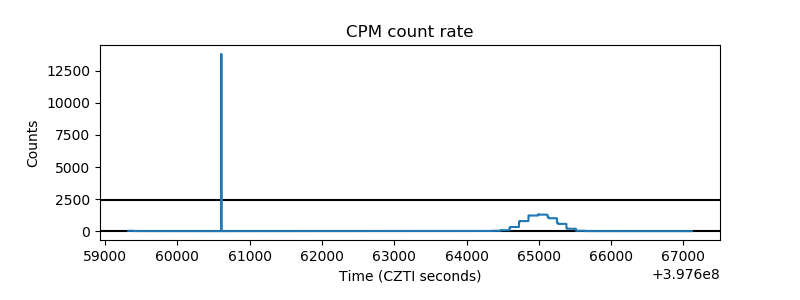 |
| CZT Counter | 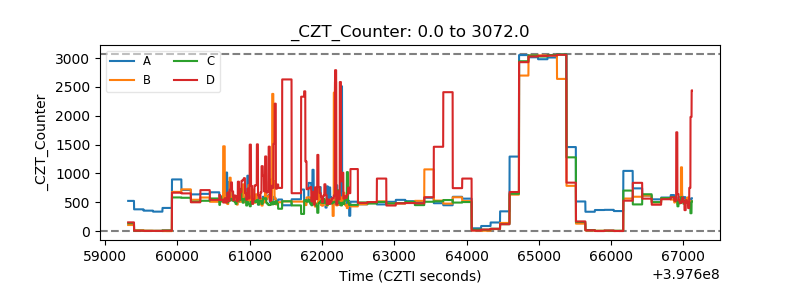 |
| +2.5 Volts monitor | 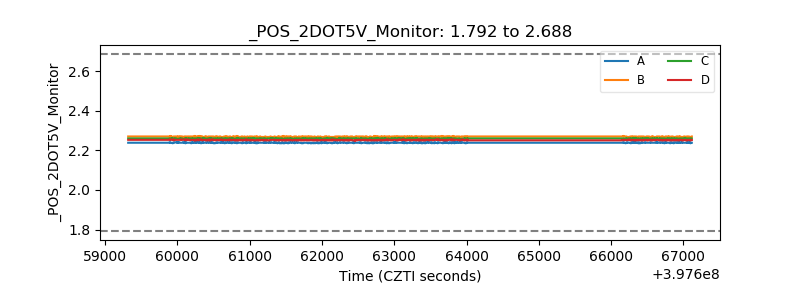 |
| +5 Volts monitor | 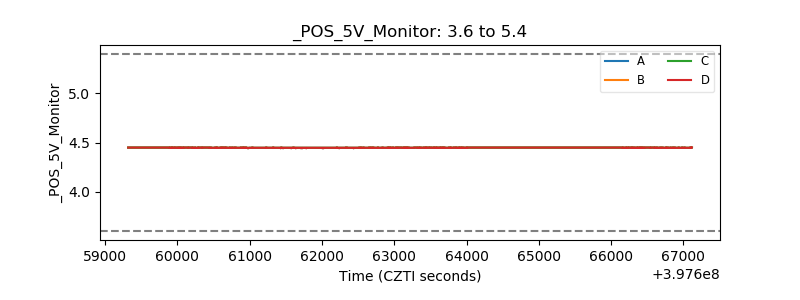 |
| _ROLL_ROT | 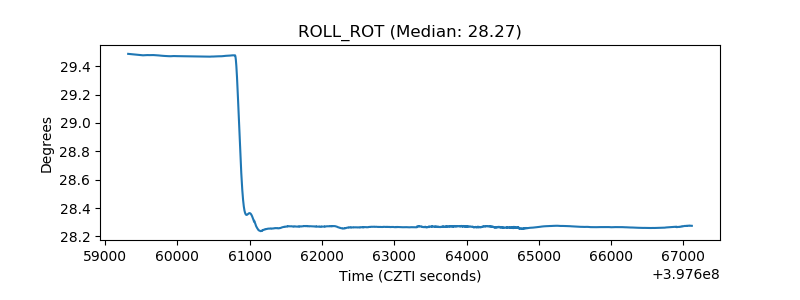 |
| _Roll_DEC | 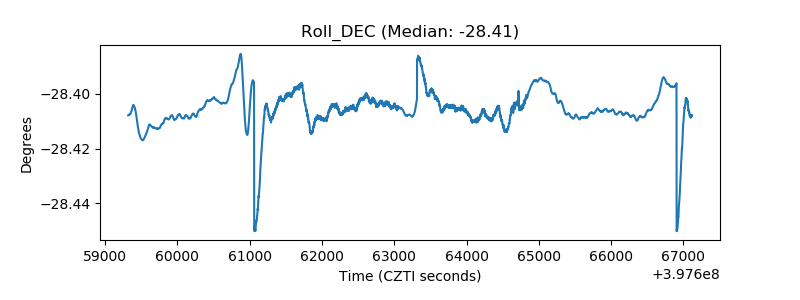 |
| _Roll_RA | 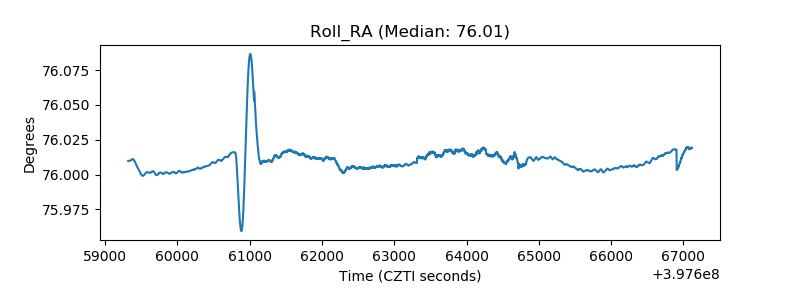 |
| Veto Counter | 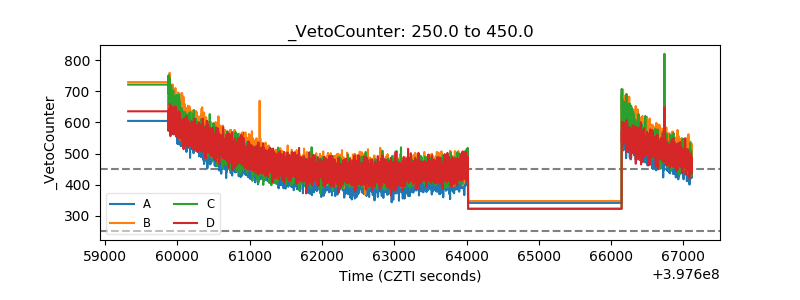 |