| Param | Original file | Final file |
|---|---|---|
| Filename | modeM0/AS1A09_138T04_9000005282_37102cztM0_level2.evt | modeM0/AS1A09_138T04_9000005282_37102cztM0_level2_quad_clean.evt |
| Size (bytes) | 434,511,360 | 47,701,440 |
| Size | 414.4 MB | 45.5 MB |
| Events in quadrant A | 3,037,360 | 279,832 |
| Events in quadrant B | 2,937,074 | 279,115 |
| Events in quadrant C | 2,895,588 | 268,469 |
| Events in quadrant D | 3,942,192 | 258,171 |
| Mode SS | |||
|---|---|---|---|
| Quadrant | BADHDUFLAG | Total packets | Discarded packets |
| A | 0 | 104 | 0 |
| B | 0 | 104 | 0 |
| C | 0 | 104 | 0 |
| D | 0 | 104 | 0 |
| Mode M0 | |||
|---|---|---|---|
| Quadrant | BADHDUFLAG | Total packets | Discarded packets |
| A | 0 | 11948 | 3 |
| B | 0 | 11660 | 2 |
| C | 0 | 11474 | 2 |
| D | 0 | 15048 | 2 |
| Mode M9 | |||
|---|---|---|---|
| Quadrant | BADHDUFLAG | Total packets | Discarded packets |
| A | 0 | 23 | 0 |
| B | 0 | 23 | 0 |
| C | 0 | 23 | 0 |
| D | 0 | 24 | 0 |
| Quadrant | Total seconds | Saturated seconds | Saturation percentage |
|---|---|---|---|
| A | 5111 | 85 | 1.663080% |
| B | 5111 | 86 | 1.682645% |
| C | 5111 | 30 | 0.586969% |
| D | 5111 | 321 | 6.280571% |
Noise dominated data is calculated using 1-second bins in cleaned event files. If a bin has >2000 counts, and if more than 50% of those come from <1% of pixels, then it is considered to be noise-dominated and hence unusable.
| Quadrant | # 1 sec bins | Bins with >0 counts | Bins with >2000 counts | High rate bins dominated by noise | Noise dominated (total time) | Noise dominated (detector-on time) | Marked lightcurve |
|---|---|---|---|---|---|---|---|
| A | 7235 | 5112 | 71 | 71 | 0.98% | 1.39% | 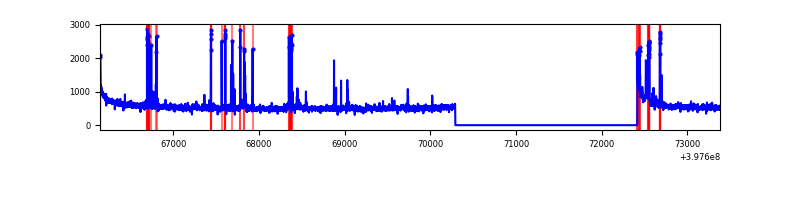 |
| B | 7235 | 5112 | 50 | 50 | 0.69% | 0.98% | 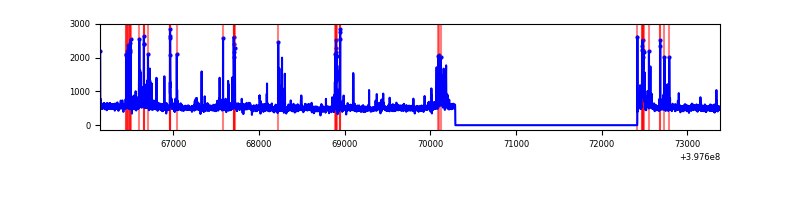 |
| C | 7235 | 5112 | 36 | 36 | 0.50% | 0.70% | 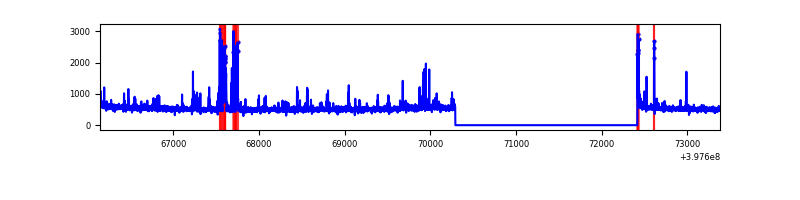 |
| D | 7235 | 5112 | 305 | 305 | 4.22% | 5.97% | 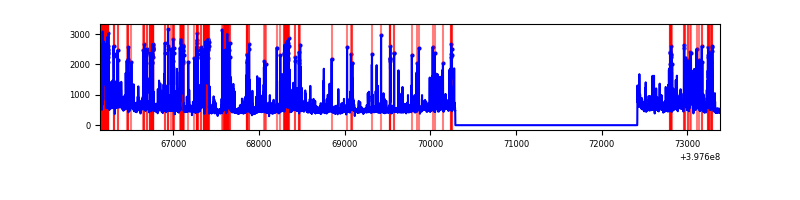 |
Top three noisy pixels from each quadrant. If the there are fewer than three noisy pixels in the level2.evt file, extra rows are filled as -1
| Pixel properties | Quadrant properties | ||||||
|---|---|---|---|---|---|---|---|
| Quadrant | DetID | PixID | Counts | Sigma | Mean | Median | Sigma |
| A | 10 | 83 | 264882 | 2069.47 | 640 | 631 | 127.7 |
| A | 15 | 237 | 224269 | 1751.41 | 640 | 631 | 127.7 |
| A | 7 | 16 | 22017 | 167.48 | 640 | 631 | 127.7 |
| B | 5 | 172 | 134170 | 1115.24 | 634 | 618 | 119.8 |
| B | 15 | 85 | 84291 | 698.72 | 634 | 618 | 119.8 |
| B | 0 | 190 | 82785 | 686.14 | 634 | 618 | 119.8 |
| C | 15 | 214 | 221104 | 1566.07 | 612 | 617 | 140.8 |
| C | 1 | 23 | 151637 | 1072.66 | 612 | 617 | 140.8 |
| C | 0 | 207 | 67218 | 473.05 | 612 | 617 | 140.8 |
| D | 1 | 52 | 1092778 | 7436.39 | 603 | 587 | 146.9 |
| D | 2 | 250 | 142308 | 964.93 | 603 | 587 | 146.9 |
| D | 13 | 249 | 129352 | 876.72 | 603 | 587 | 146.9 |
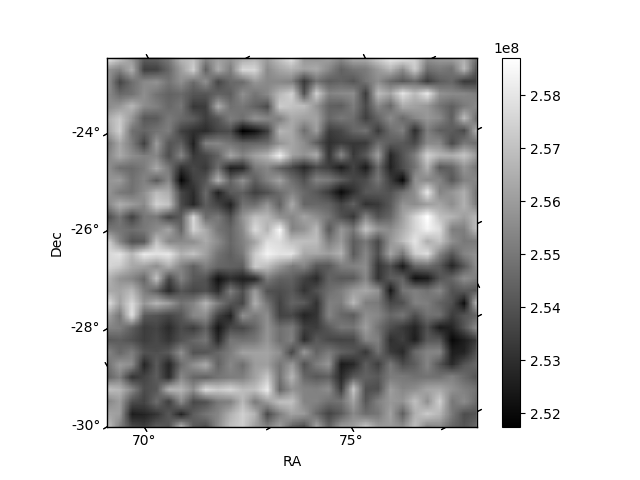
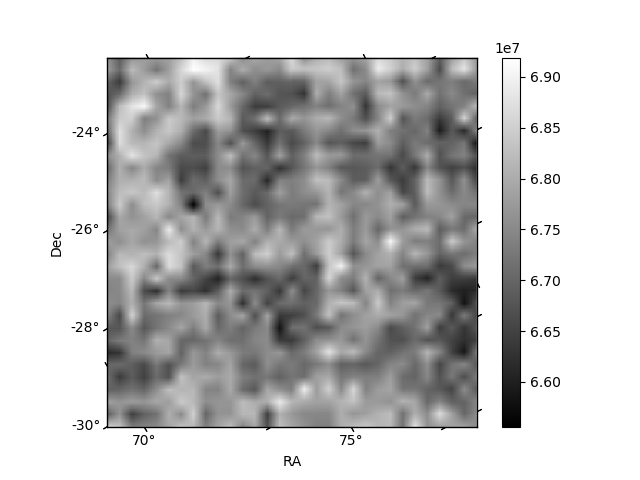
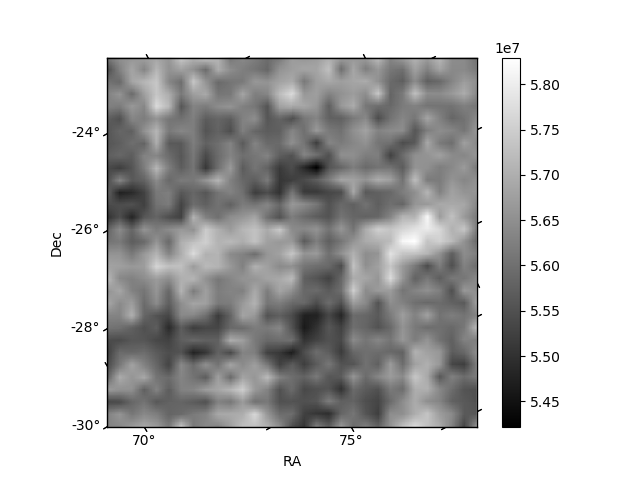
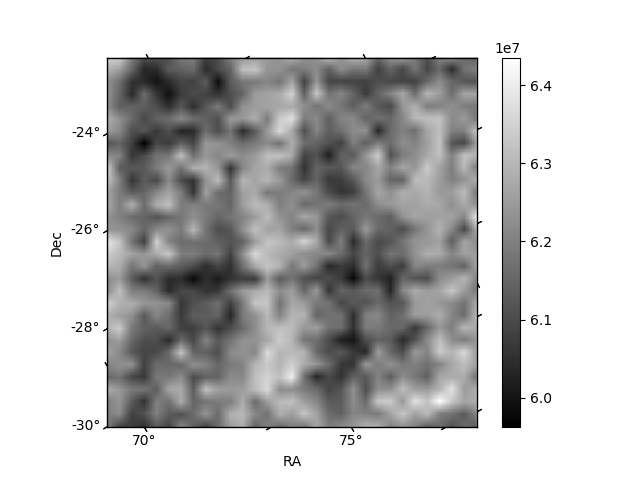
Histogram calculated using DETX and DETY for each event in the final _common_clean file
| Quadrant A | 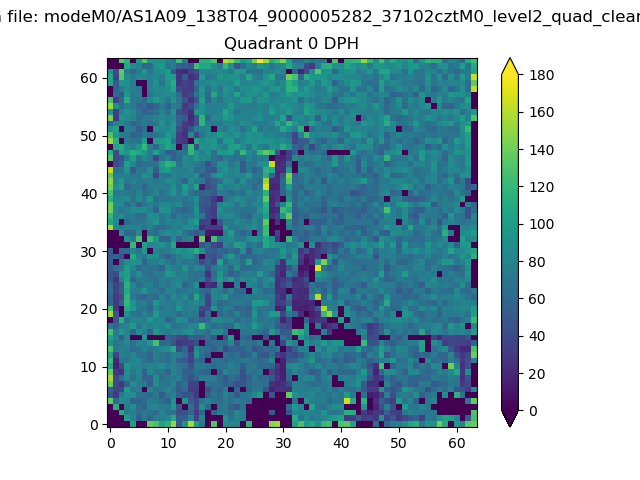 |
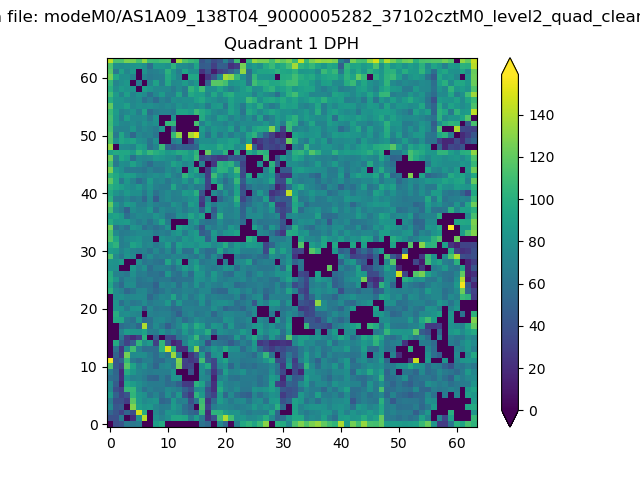 |
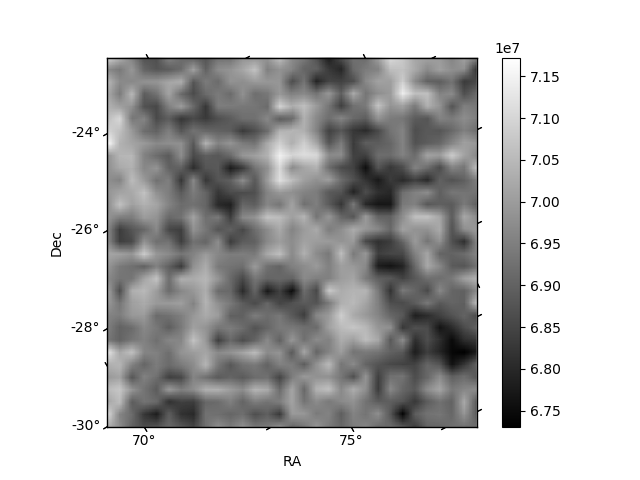
Quadrant B |
|---|---|---|---|
| Quadrant D | 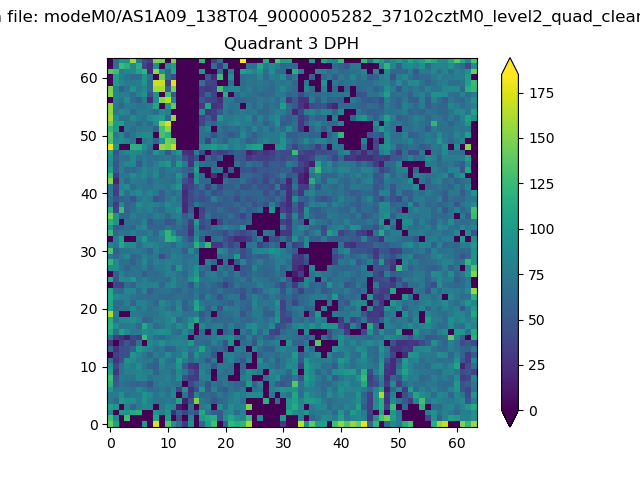 |
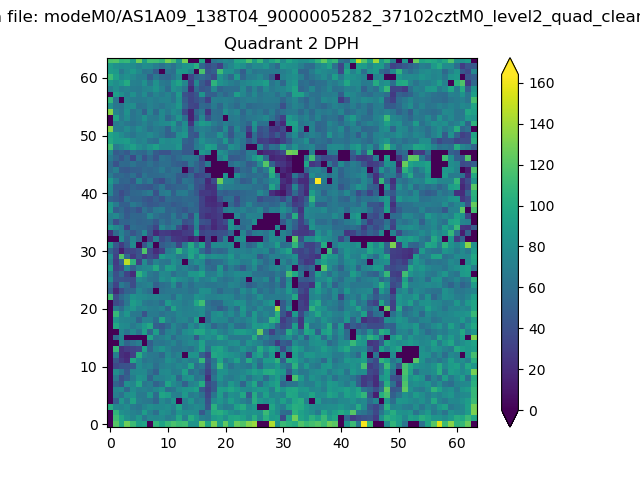 |
Quadrant C |
| Plot type | Count rate plots | Images |
|---|---|---|
| Comparison with Poisson distribution Blue bars denote a histogram of data divided into 1 sec bins. Red curve is a Poisson curve with rate = median count rate of data. |
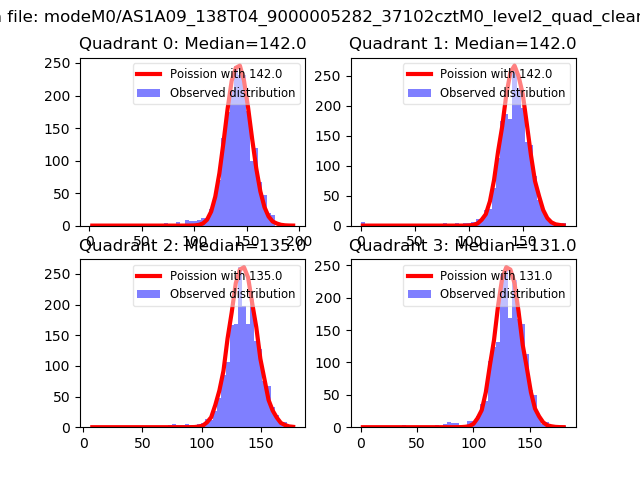 |
 |
| Quadrant-wise count rates Data is divided into 100 sec bins |
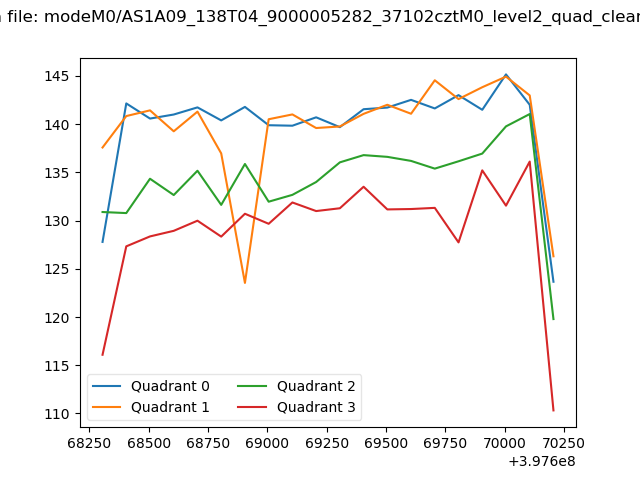 |
|
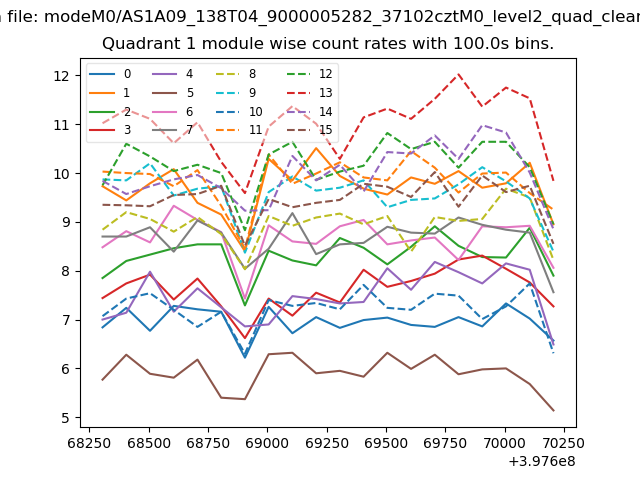
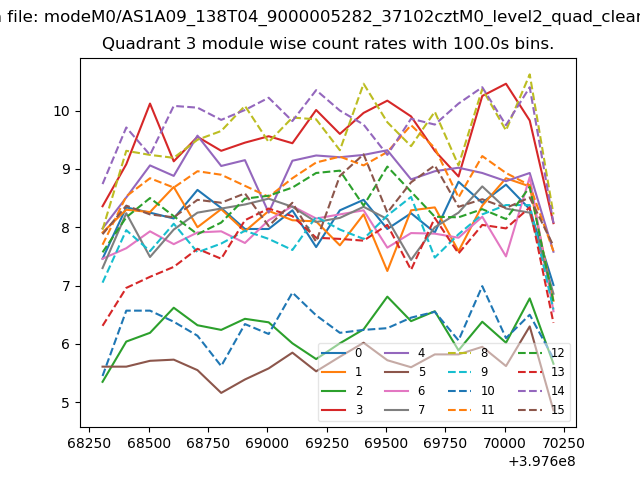
| Module-wise count rates for Quadrant A Data is divided into 100 sec bins |
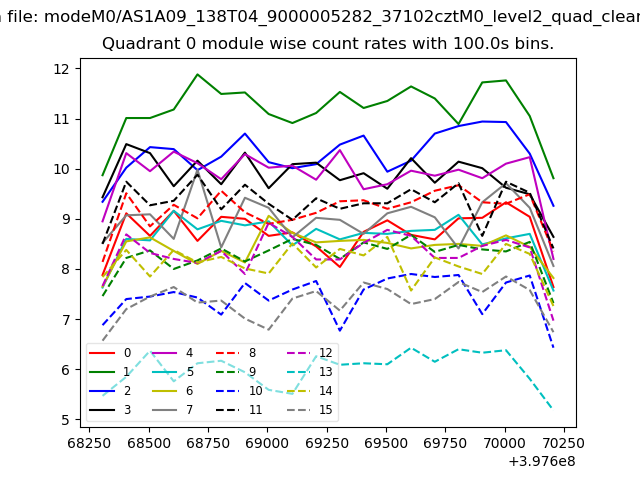 |
 |
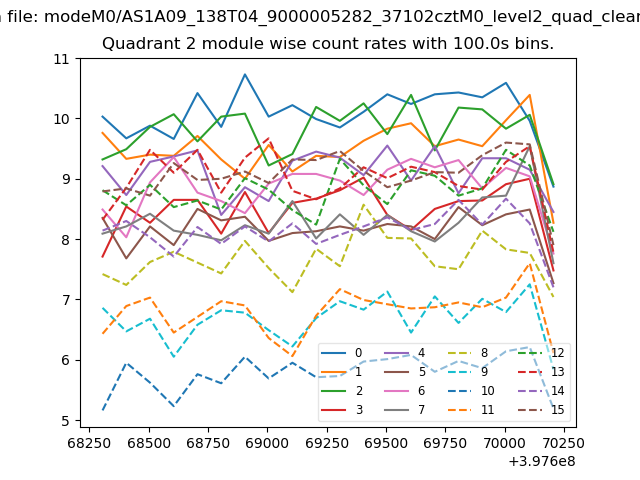
| Module-wise count rates for Quadrant B Data is divided into 100 sec bins |
 |
 |
| Module-wise count rates for Quadrant C Data is divided into 100 sec bins |
 |
 |
| Module-wise count rates for Quadrant D Data is divided into 100 sec bins |
 |
 |
| Parameter | Plot |
|---|---|
| CZT HV Monitor | 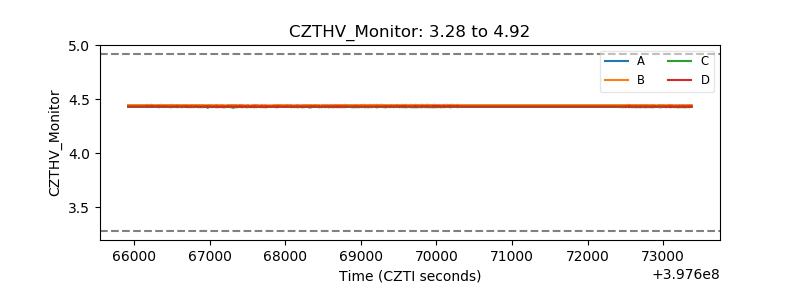 |
| D_VDD | 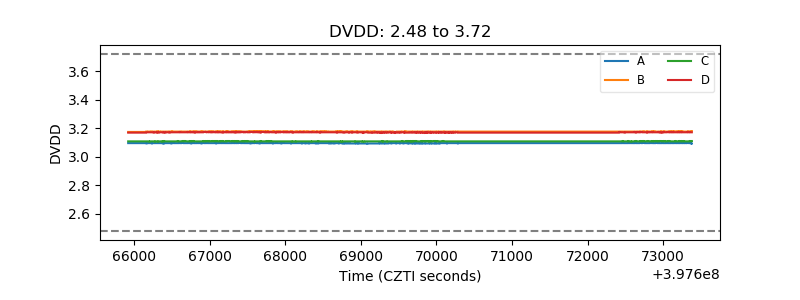 |
| Temperature 1 | 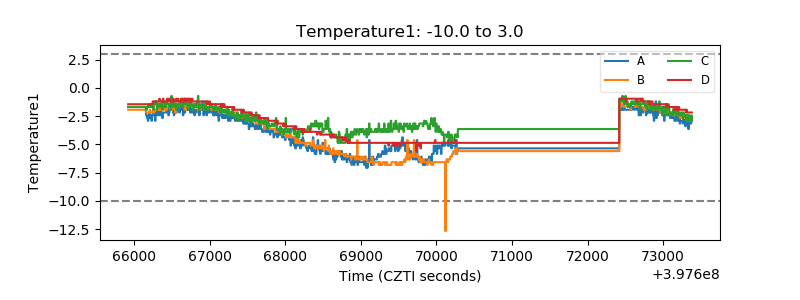 |
| Veto HV Monitor | 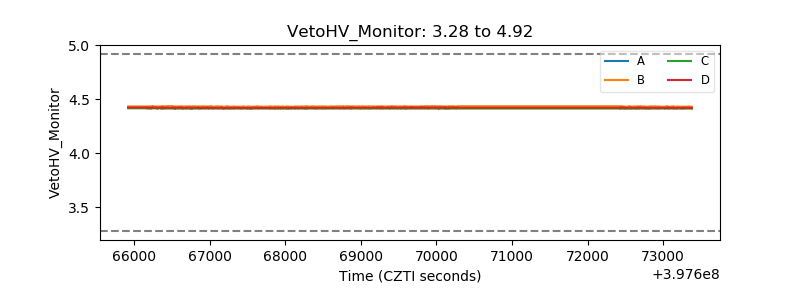 |
| Veto LLD | 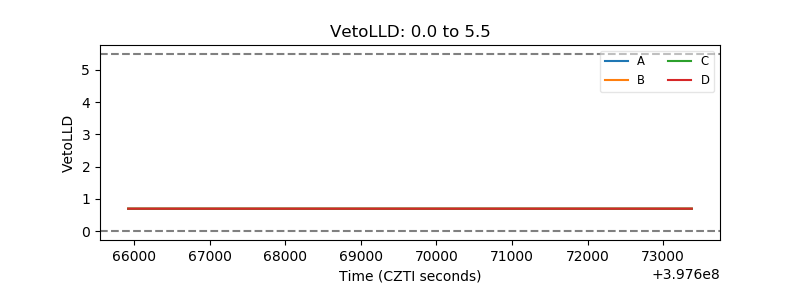 |
| Alpha Counter | 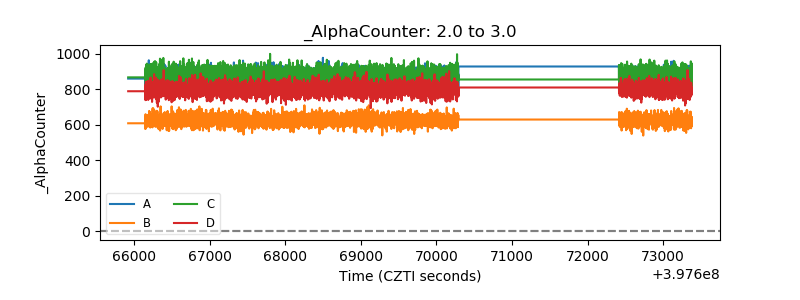 |
| _CPM_Rate | 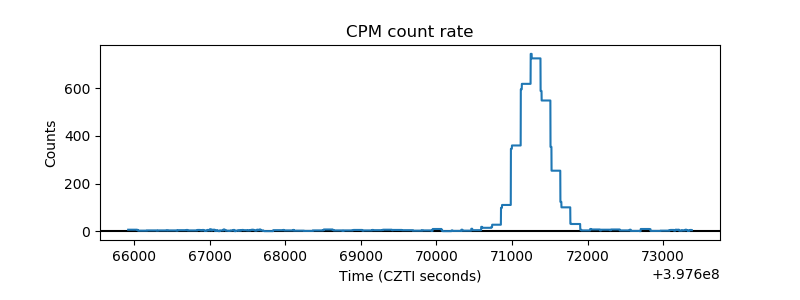 |
| CZT Counter | 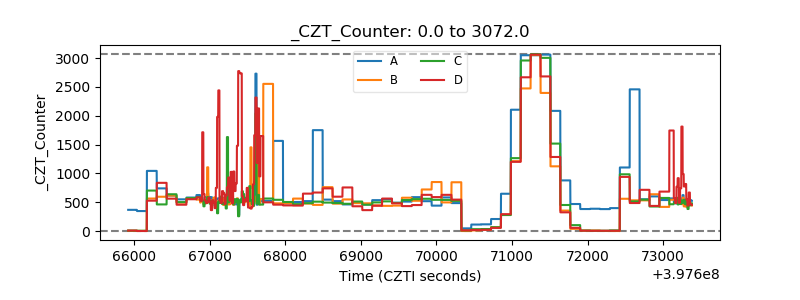 |
| +2.5 Volts monitor | 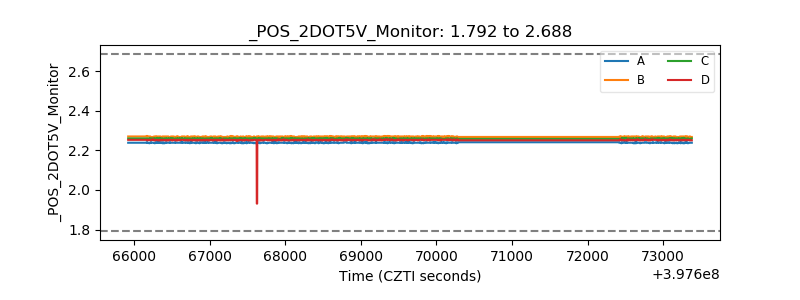 |
| +5 Volts monitor | 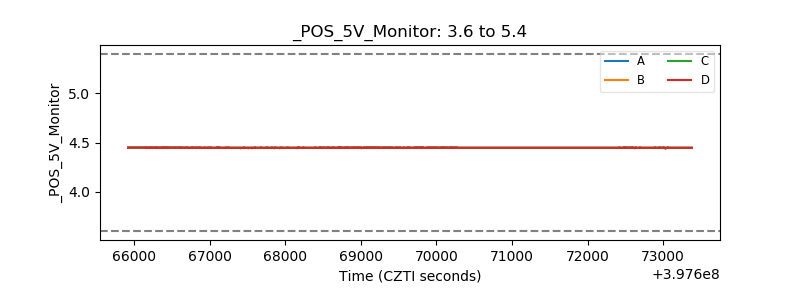 |
| _ROLL_ROT | 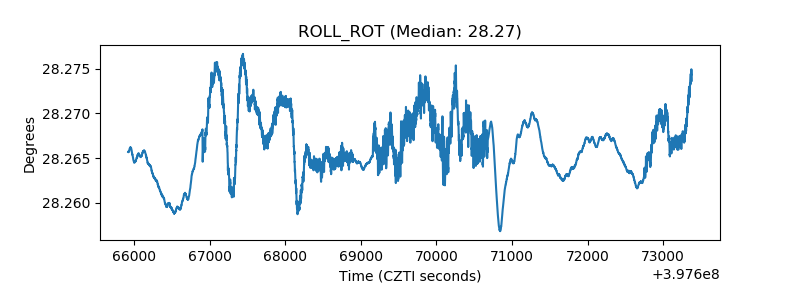 |
| _Roll_DEC | 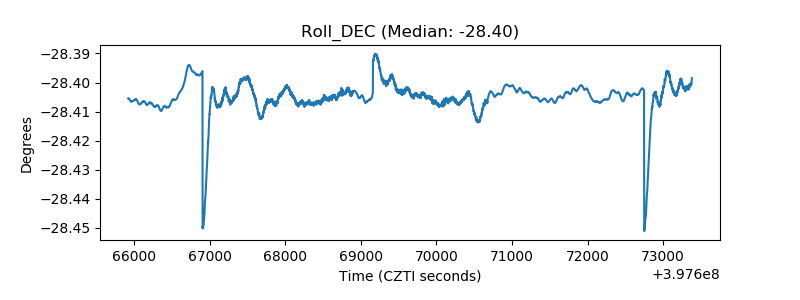 |
| _Roll_RA | 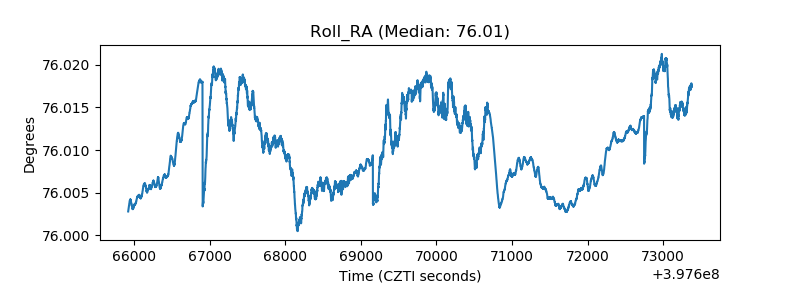 |
| Veto Counter | 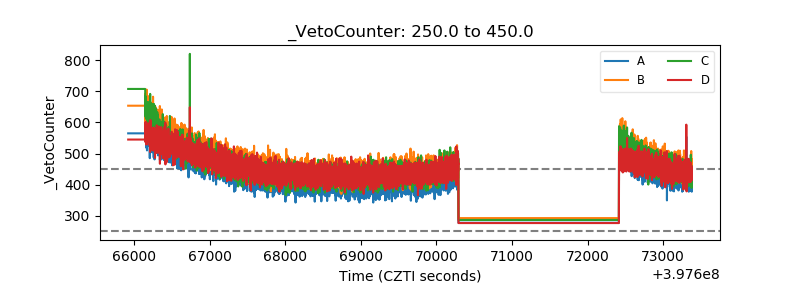 |