| Param | Original file | Final file |
|---|---|---|
| Filename | modeM0/AS1A09_138T04_9000005282_37103cztM0_level2.evt | modeM0/AS1A09_138T04_9000005282_37103cztM0_level2_quad_clean.evt |
| Size (bytes) | 384,511,680 | 54,953,280 |
| Size | 366.7 MB | 52.4 MB |
| Events in quadrant A | 2,728,983 | 339,388 |
| Events in quadrant B | 2,867,321 | 338,883 |
| Events in quadrant C | 2,547,688 | 326,942 |
| Events in quadrant D | 3,164,937 | 311,752 |
| Mode SS | |||
|---|---|---|---|
| Quadrant | BADHDUFLAG | Total packets | Discarded packets |
| A | 0 | 102 | 0 |
| B | 0 | 102 | 0 |
| C | 0 | 102 | 0 |
| D | 0 | 102 | 0 |
| Mode M0 | |||
|---|---|---|---|
| Quadrant | BADHDUFLAG | Total packets | Discarded packets |
| A | 0 | 11019 | 3 |
| B | 0 | 11492 | 2 |
| C | 0 | 10285 | 2 |
| D | 0 | 12595 | 2 |
| Mode M9 | |||
|---|---|---|---|
| Quadrant | BADHDUFLAG | Total packets | Discarded packets |
| A | 0 | 28 | 0 |
| B | 0 | 28 | 0 |
| C | 0 | 28 | 0 |
| D | 0 | 29 | 0 |
| Quadrant | Total seconds | Saturated seconds | Saturation percentage |
|---|---|---|---|
| A | 4937 | 57 | 1.154547% |
| B | 4937 | 107 | 2.167308% |
| C | 4937 | 15 | 0.303828% |
| D | 4937 | 135 | 2.734454% |
Noise dominated data is calculated using 1-second bins in cleaned event files. If a bin has >2000 counts, and if more than 50% of those come from <1% of pixels, then it is considered to be noise-dominated and hence unusable.
| Quadrant | # 1 sec bins | Bins with >0 counts | Bins with >2000 counts | High rate bins dominated by noise | Noise dominated (total time) | Noise dominated (detector-on time) | Marked lightcurve |
|---|---|---|---|---|---|---|---|
| A | 6971 | 4938 | 37 | 37 | 0.53% | 0.75% | 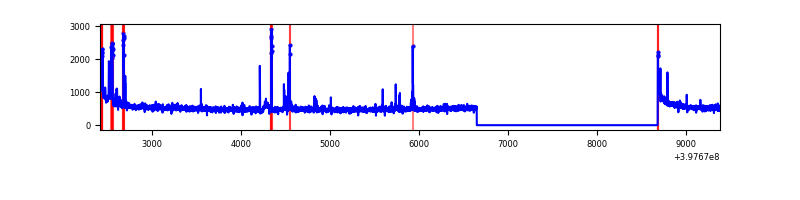 |
| B | 6971 | 4938 | 63 | 63 | 0.90% | 1.28% | 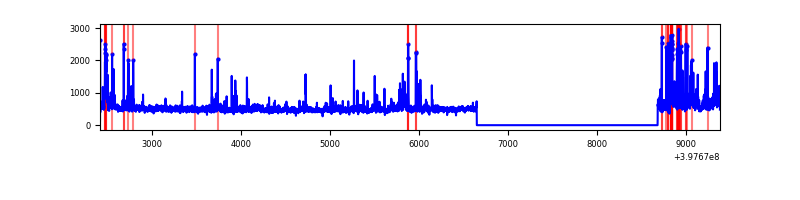 |
| C | 6971 | 4938 | 9 | 9 | 0.13% | 0.18% | 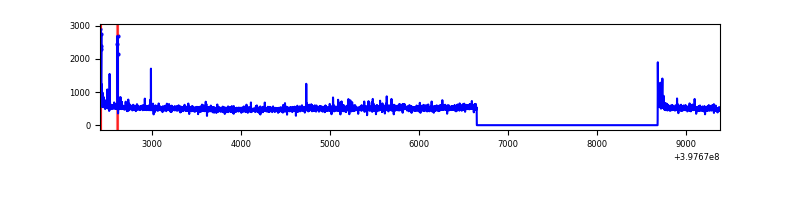 |
| D | 6971 | 4938 | 121 | 121 | 1.74% | 2.45% | 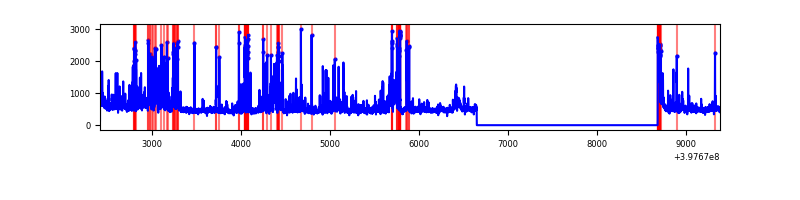 |
Top three noisy pixels from each quadrant. If the there are fewer than three noisy pixels in the level2.evt file, extra rows are filled as -1
| Pixel properties | Quadrant properties | ||||||
|---|---|---|---|---|---|---|---|
| Quadrant | DetID | PixID | Counts | Sigma | Mean | Median | Sigma |
| A | 10 | 83 | 258448 | 2148.79 | 593 | 582 | 120.0 |
| A | 15 | 237 | 119798 | 993.42 | 593 | 582 | 120.0 |
| A | 7 | 3 | 45009 | 370.21 | 593 | 582 | 120.0 |
| B | 5 | 172 | 226620 | 2011.83 | 586 | 572 | 112.4 |
| B | 5 | 184 | 159446 | 1413.98 | 586 | 572 | 112.4 |
| B | 15 | 85 | 36225 | 317.31 | 586 | 572 | 112.4 |
| C | 15 | 214 | 214392 | 1599.44 | 572 | 578 | 133.7 |
| C | 0 | 10 | 57413 | 425.16 | 572 | 578 | 133.7 |
| C | 0 | 207 | 23324 | 170.15 | 572 | 578 | 133.7 |
| D | 1 | 52 | 240875 | 1728.41 | 570 | 555 | 139.0 |
| D | 2 | 250 | 176112 | 1262.63 | 570 | 555 | 139.0 |
| D | 12 | 227 | 165783 | 1188.34 | 570 | 555 | 139.0 |
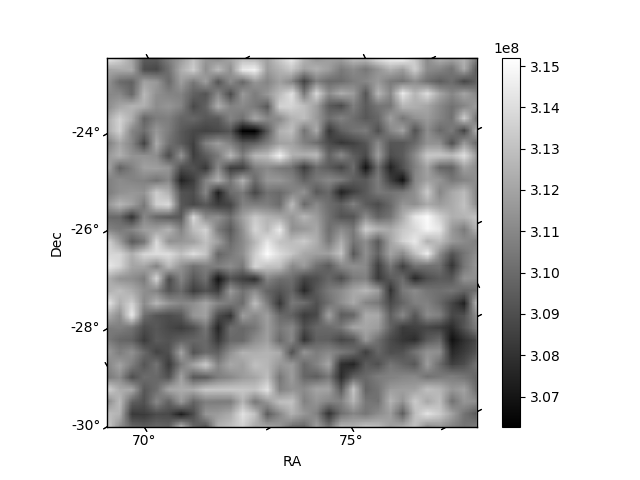
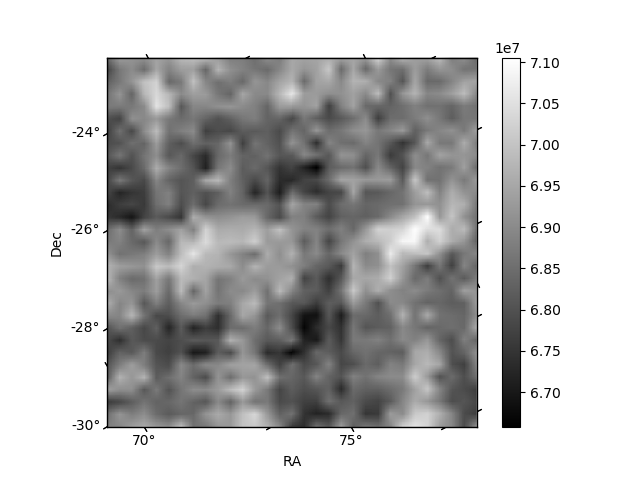
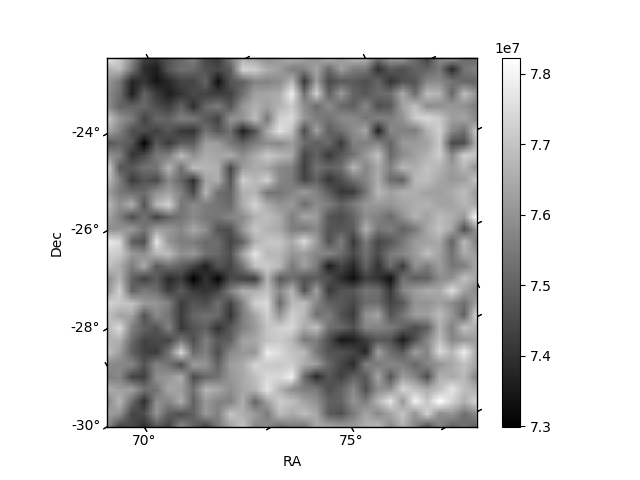
Histogram calculated using DETX and DETY for each event in the final _common_clean file
| Quadrant A | 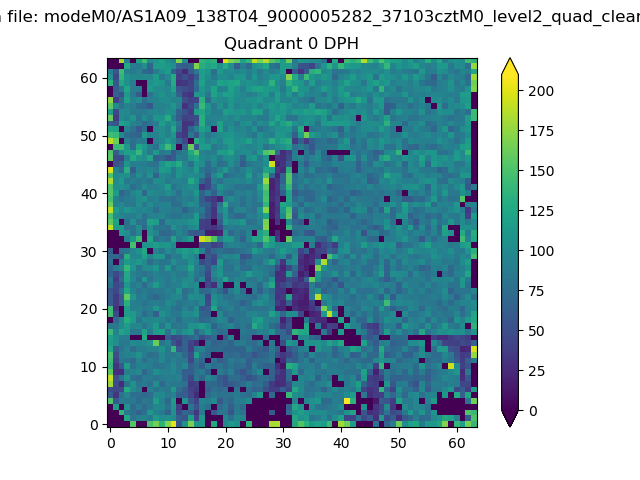 |
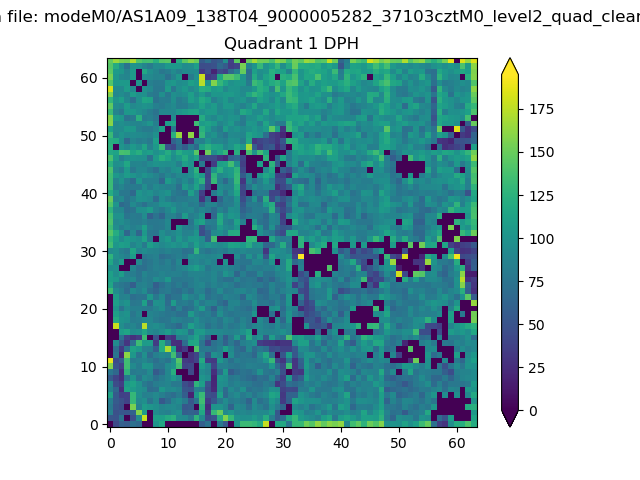 |
Quadrant B |
|---|---|---|---|
| Quadrant D | 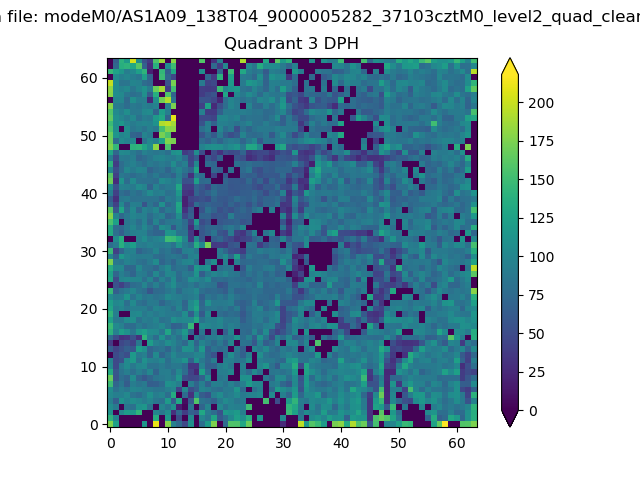 |
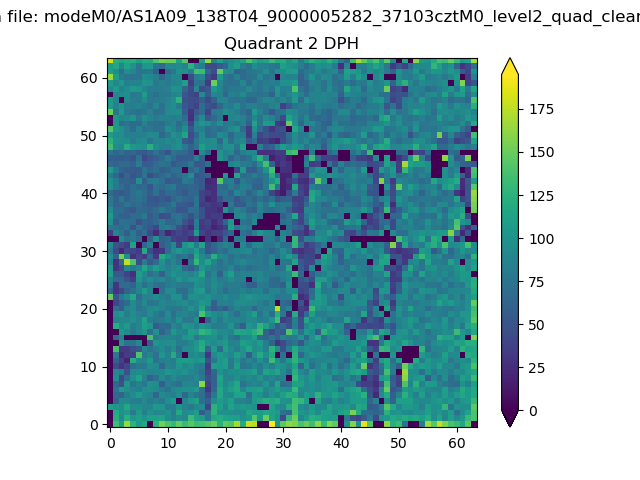 |
Quadrant C |
| Plot type | Count rate plots | Images |
|---|---|---|
| Comparison with Poisson distribution Blue bars denote a histogram of data divided into 1 sec bins. Red curve is a Poisson curve with rate = median count rate of data. |
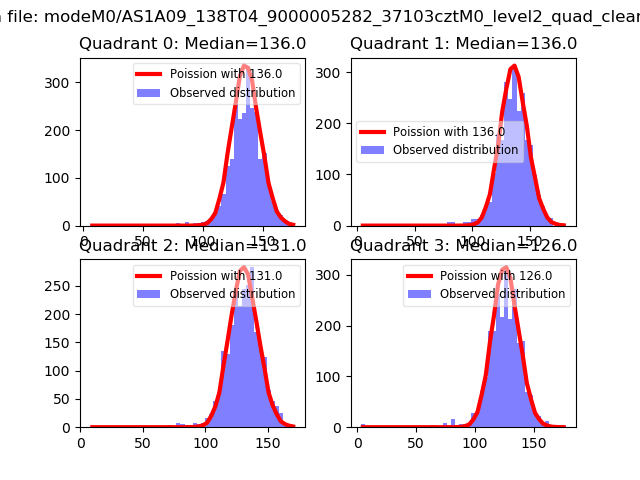 |
 |
| Quadrant-wise count rates Data is divided into 100 sec bins |
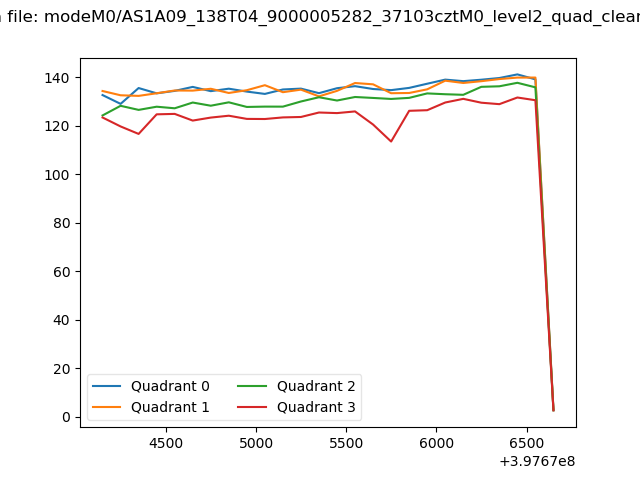 |
|
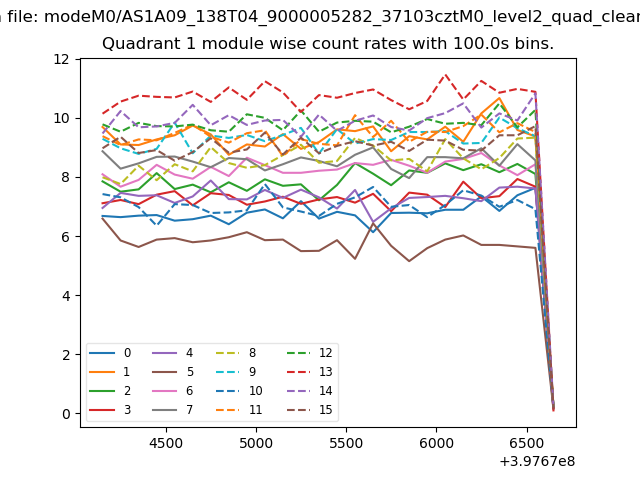
| Module-wise count rates for Quadrant A Data is divided into 100 sec bins |
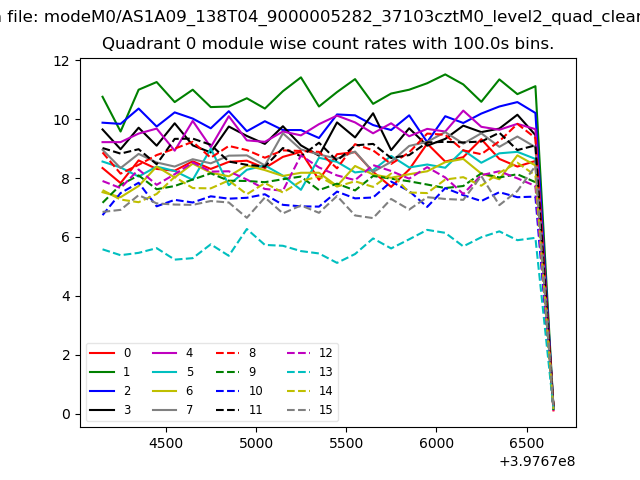 |
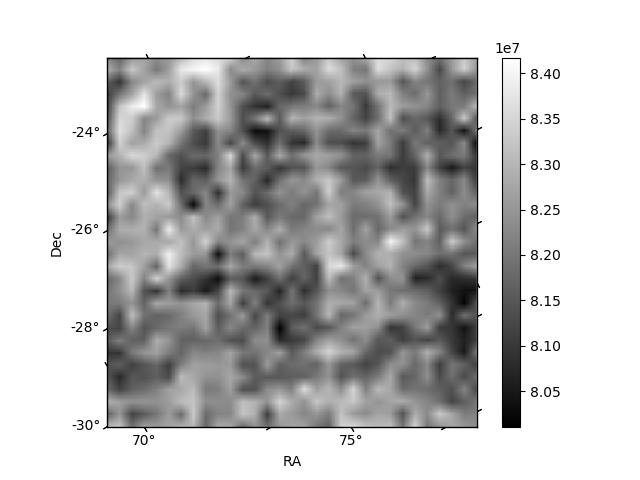 |
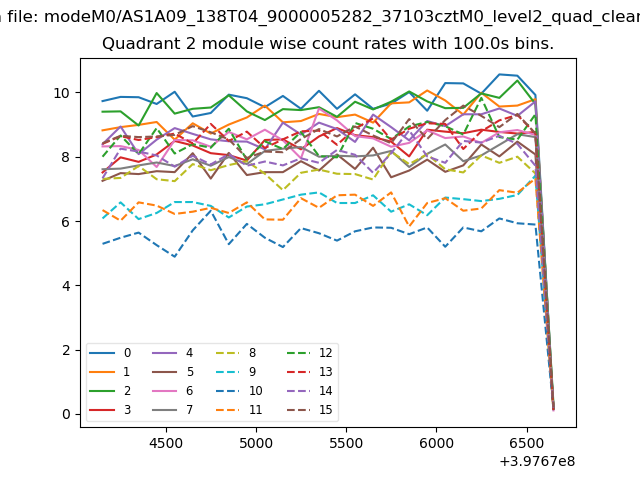
| Module-wise count rates for Quadrant B Data is divided into 100 sec bins |
 |
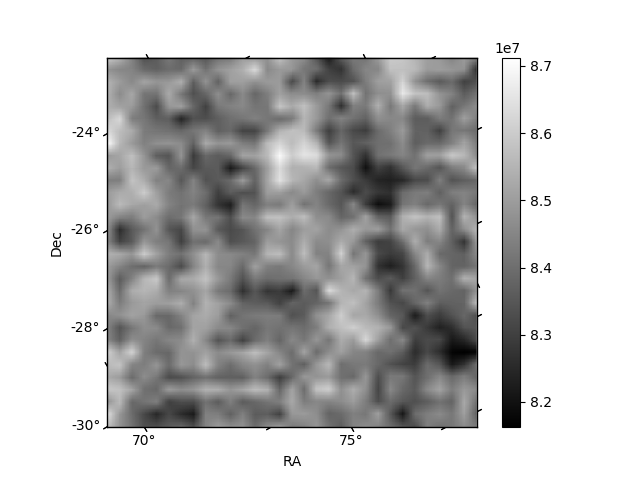 |
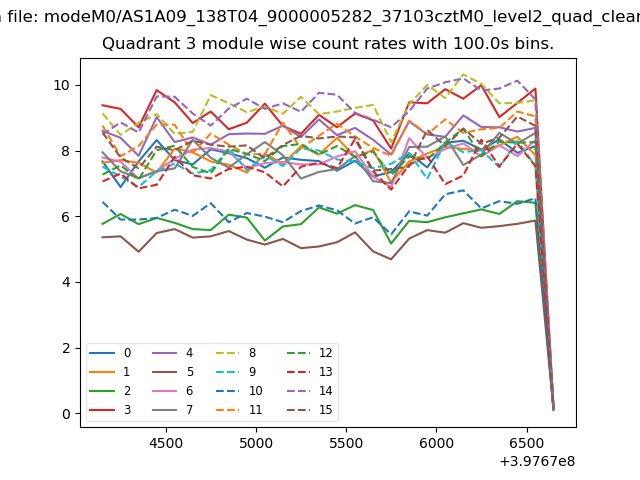
| Module-wise count rates for Quadrant C Data is divided into 100 sec bins |
 |
 |
| Module-wise count rates for Quadrant D Data is divided into 100 sec bins |
 |
 |
| Parameter | Plot |
|---|---|
| CZT HV Monitor | 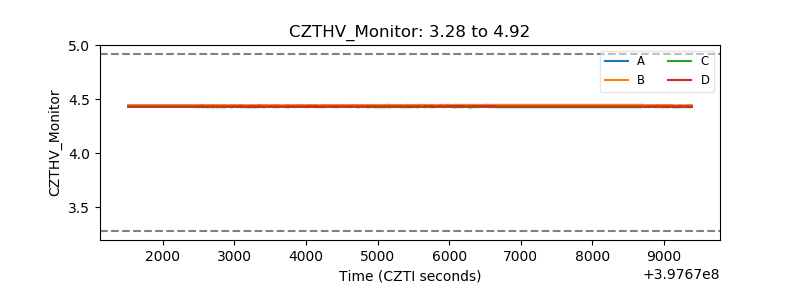 |
| D_VDD | 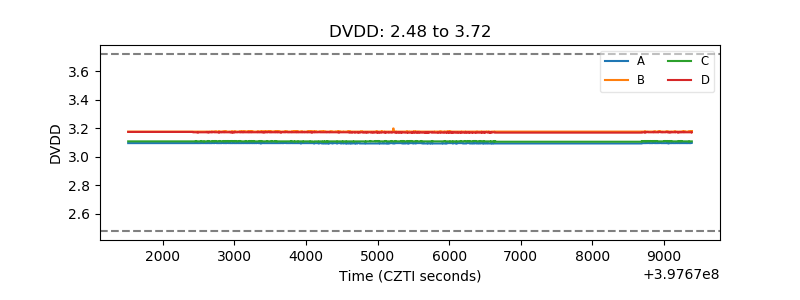 |
| Temperature 1 | 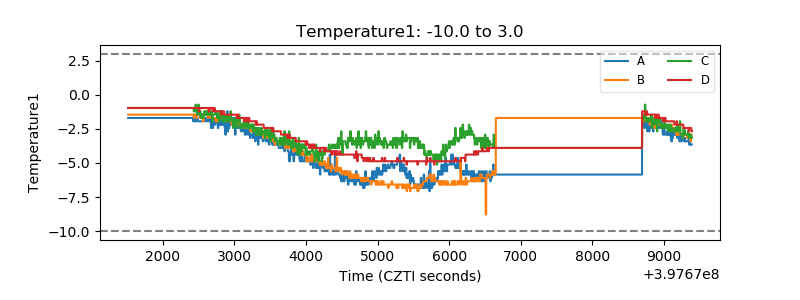 |
| Veto HV Monitor |  |
| Veto LLD | 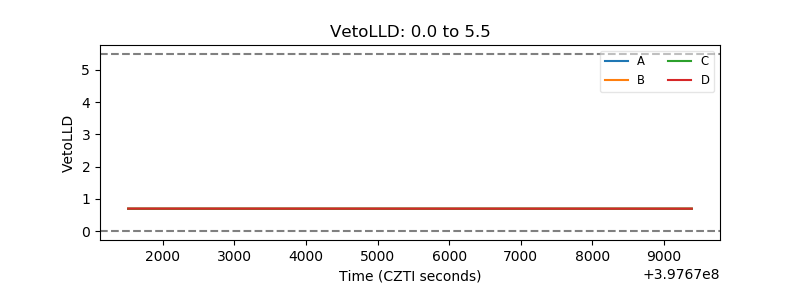 |
| Alpha Counter | 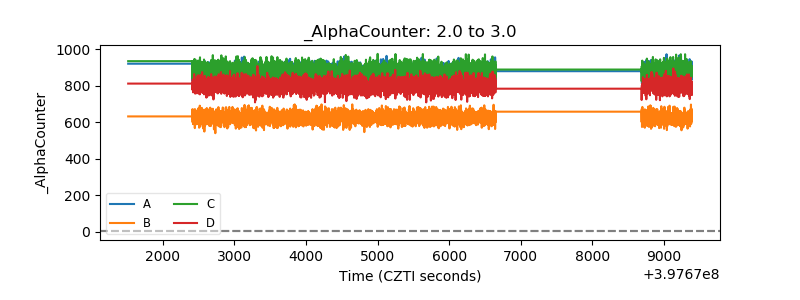 |
| _CPM_Rate | 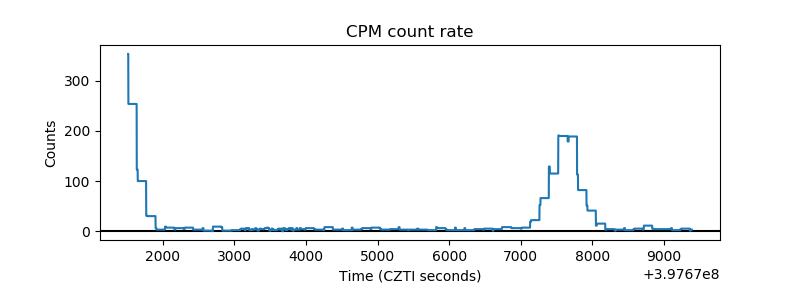 |
| CZT Counter | 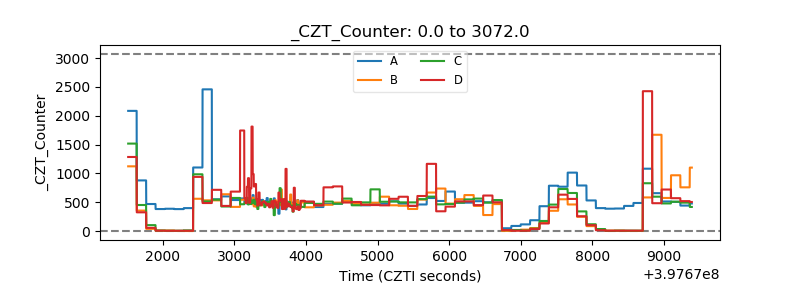 |
| +2.5 Volts monitor | 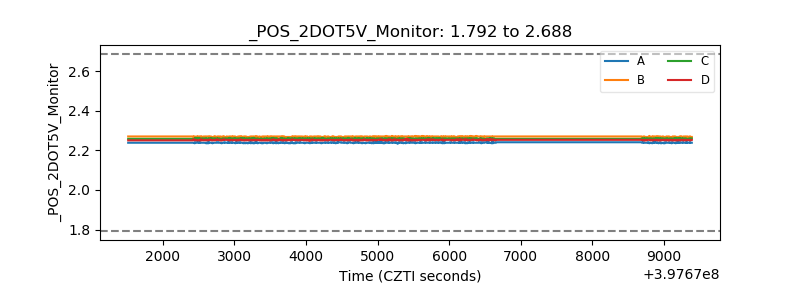 |
| +5 Volts monitor | 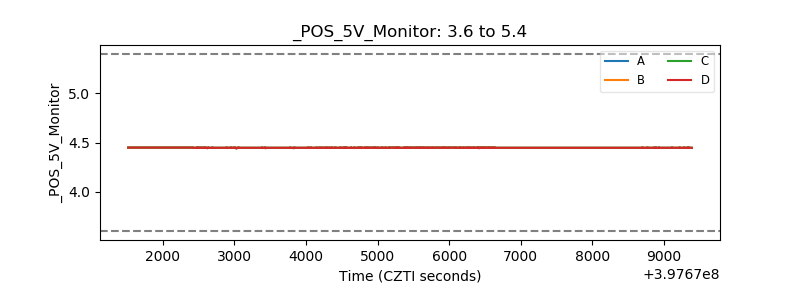 |
| _ROLL_ROT | 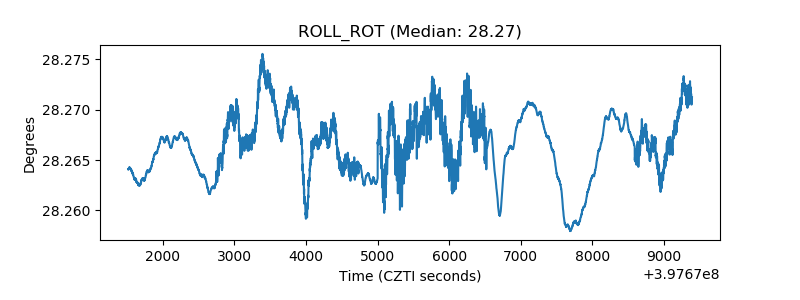 |
| _Roll_DEC | 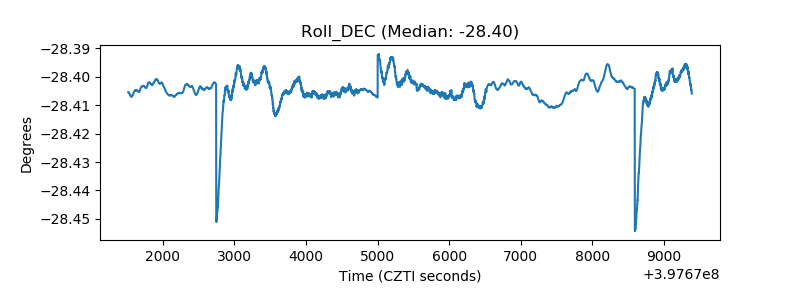 |
| _Roll_RA | 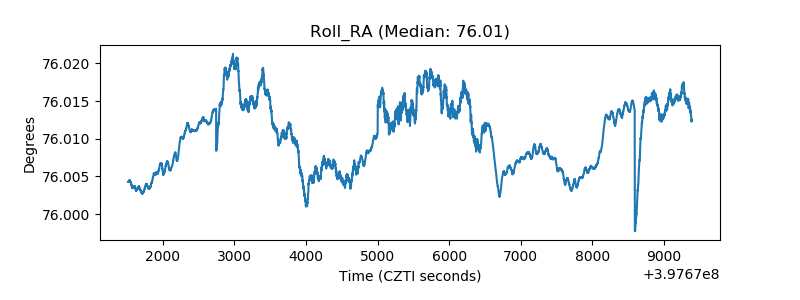 |
| Veto Counter | 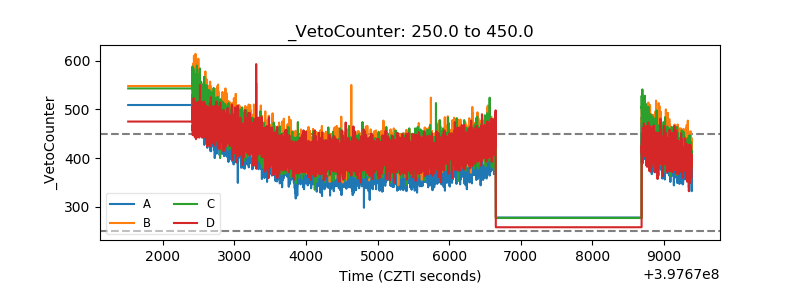 |