| Param | Original file | Final file |
|---|---|---|
| Filename | modeM0/AS1A09_138T04_9000005282_37104cztM0_level2.evt | modeM0/AS1A09_138T04_9000005282_37104cztM0_level2_quad_clean.evt |
| Size (bytes) | 416,540,160 | 66,271,680 |
| Size | 397.2 MB | 63.2 MB |
| Events in quadrant A | 2,706,426 | 419,545 |
| Events in quadrant B | 3,545,903 | 419,871 |
| Events in quadrant C | 2,928,929 | 404,494 |
| Events in quadrant D | 3,071,438 | 389,716 |
| Mode SS | |||
|---|---|---|---|
| Quadrant | BADHDUFLAG | Total packets | Discarded packets |
| A | 0 | 110 | 0 |
| B | 0 | 110 | 0 |
| C | 0 | 110 | 0 |
| D | 0 | 110 | 0 |
| Mode M0 | |||
|---|---|---|---|
| Quadrant | BADHDUFLAG | Total packets | Discarded packets |
| A | 0 | 11300 | 3 |
| B | 0 | 13978 | 2 |
| C | 0 | 11852 | 2 |
| D | 0 | 12648 | 2 |
| Mode M9 | |||
|---|---|---|---|
| Quadrant | BADHDUFLAG | Total packets | Discarded packets |
| A | 0 | 31 | 0 |
| B | 0 | 31 | 0 |
| C | 0 | 31 | 0 |
| D | 0 | 32 | 0 |
| Quadrant | Total seconds | Saturated seconds | Saturation percentage |
|---|---|---|---|
| A | 5320 | 20 | 0.375940% |
| B | 5320 | 328 | 6.165414% |
| C | 5320 | 48 | 0.902256% |
| D | 5320 | 131 | 2.462406% |
Noise dominated data is calculated using 1-second bins in cleaned event files. If a bin has >2000 counts, and if more than 50% of those come from <1% of pixels, then it is considered to be noise-dominated and hence unusable.
| Quadrant | # 1 sec bins | Bins with >0 counts | Bins with >2000 counts | High rate bins dominated by noise | Noise dominated (total time) | Noise dominated (detector-on time) | Marked lightcurve |
|---|---|---|---|---|---|---|---|
| A | 7053 | 5321 | 7 | 7 | 0.10% | 0.13% | 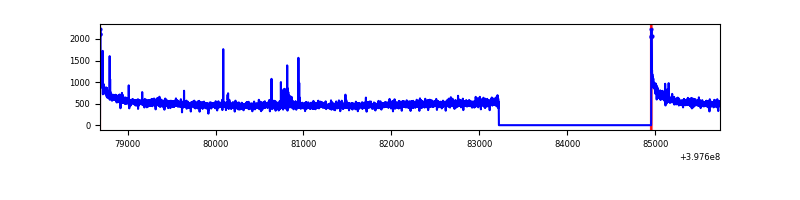 |
| B | 7053 | 5321 | 250 | 250 | 3.54% | 4.70% | 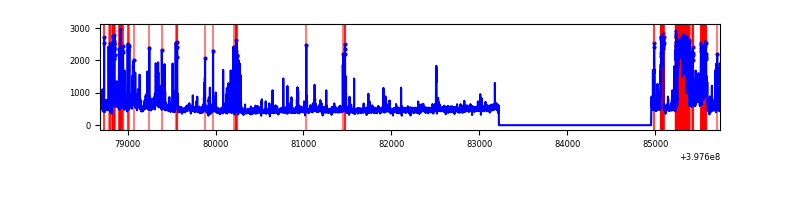 |
| C | 7053 | 5321 | 30 | 30 | 0.43% | 0.56% | 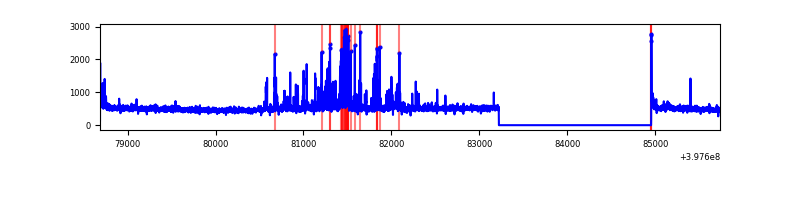 |
| D | 7053 | 5321 | 124 | 124 | 1.76% | 2.33% | 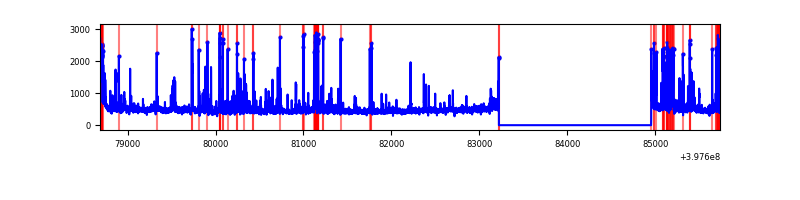 |
Top three noisy pixels from each quadrant. If the there are fewer than three noisy pixels in the level2.evt file, extra rows are filled as -1
| Pixel properties | Quadrant properties | ||||||
|---|---|---|---|---|---|---|---|
| Quadrant | DetID | PixID | Counts | Sigma | Mean | Median | Sigma |
| A | 10 | 83 | 267242 | 2135.44 | 618 | 607 | 124.9 |
| A | 13 | 6 | 21119 | 164.28 | 618 | 607 | 124.9 |
| A | 9 | 143 | 10611 | 80.12 | 618 | 607 | 124.9 |
| B | 5 | 184 | 605356 | 5243.26 | 597 | 581 | 115.3 |
| B | 5 | 172 | 408663 | 3537.98 | 597 | 581 | 115.3 |
| B | 0 | 190 | 74738 | 642.92 | 597 | 581 | 115.3 |
| C | 15 | 214 | 228437 | 1641.18 | 597 | 602 | 138.8 |
| C | 15 | 208 | 171354 | 1229.99 | 597 | 602 | 138.8 |
| C | 14 | 254 | 136869 | 981.58 | 597 | 602 | 138.8 |
| D | 2 | 250 | 165098 | 1136.76 | 596 | 580 | 144.7 |
| D | 1 | 47 | 156529 | 1077.55 | 596 | 580 | 144.7 |
| D | 12 | 227 | 105504 | 724.99 | 596 | 580 | 144.7 |
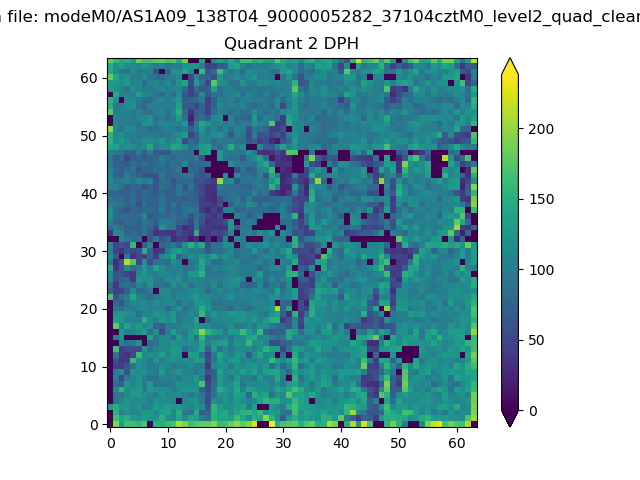
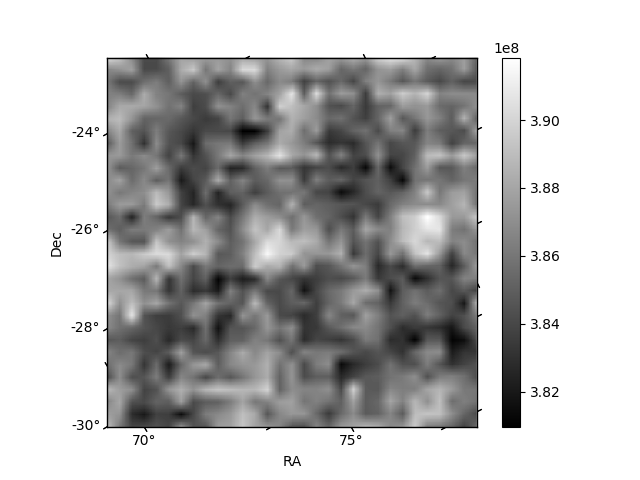
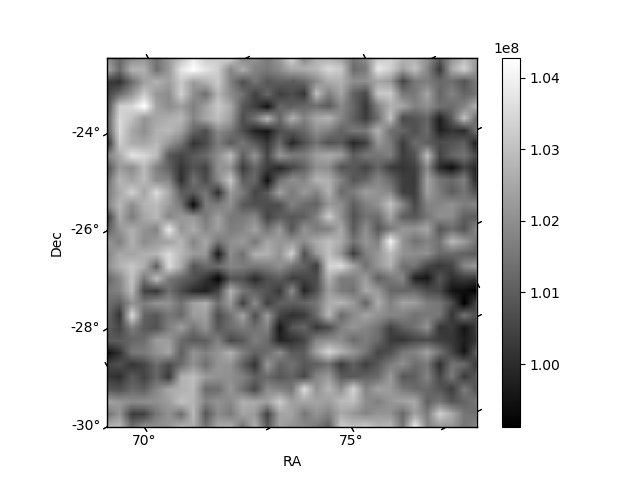
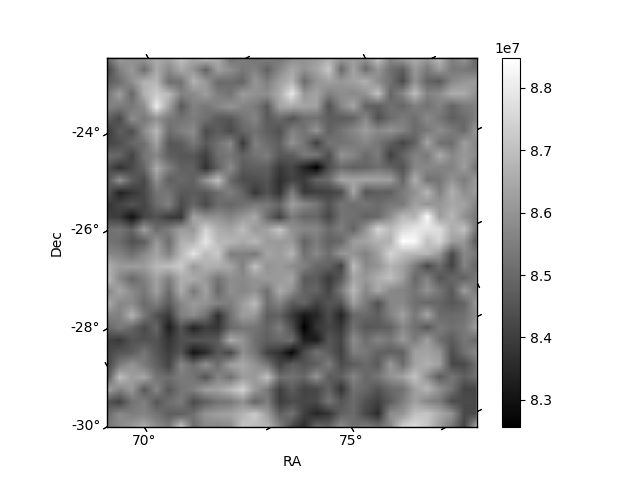
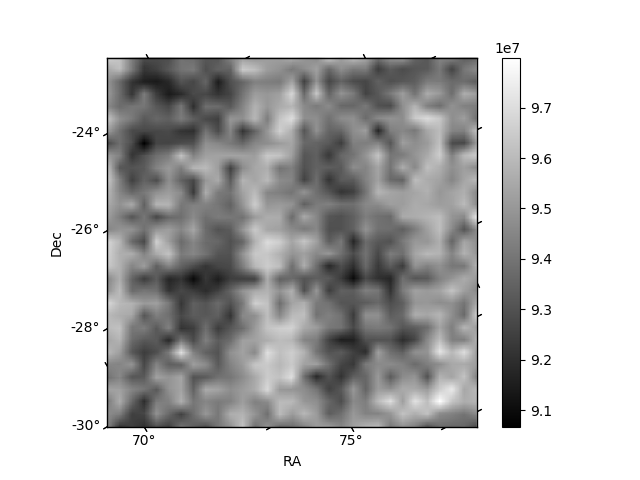
Histogram calculated using DETX and DETY for each event in the final _common_clean file
| Quadrant A | 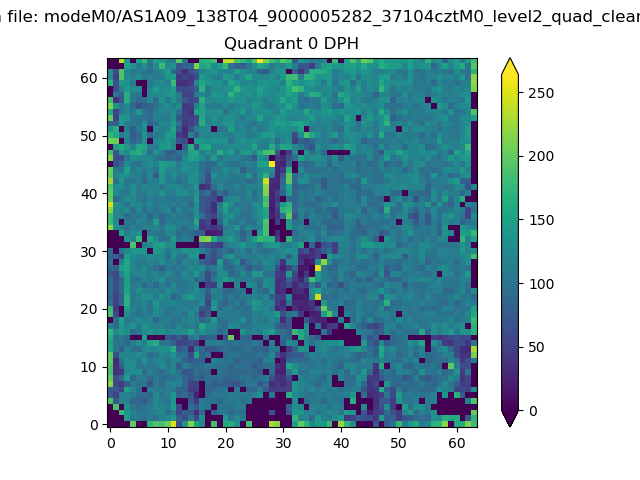 |
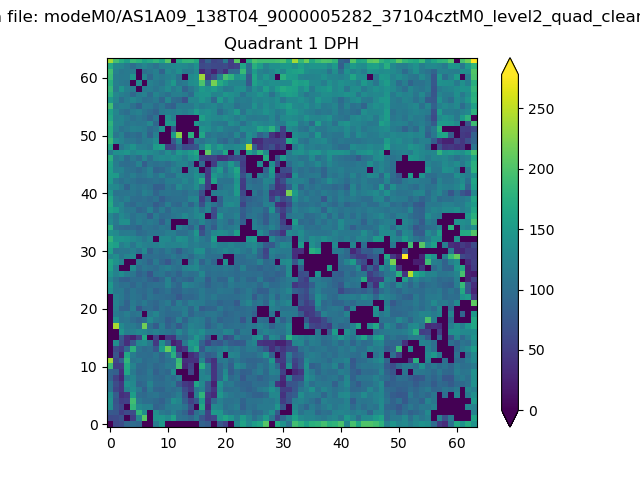 |
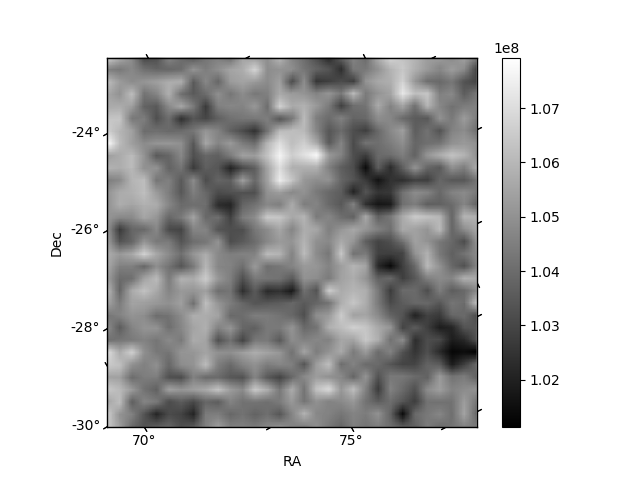
Quadrant B |
|---|---|---|---|
| Quadrant D | 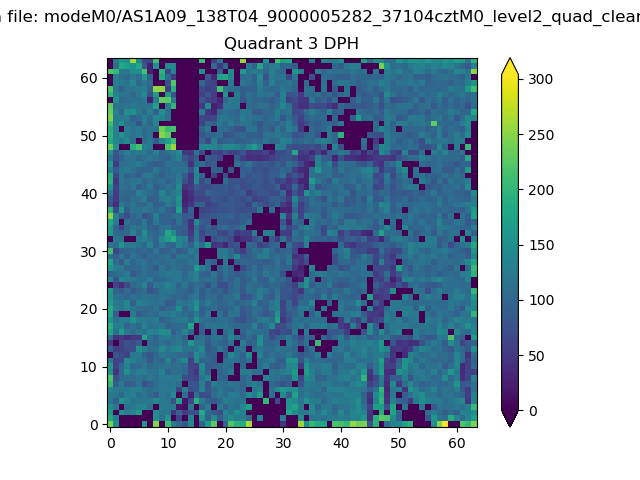 |
 |
Quadrant C |
| Plot type | Count rate plots | Images |
|---|---|---|
| Comparison with Poisson distribution Blue bars denote a histogram of data divided into 1 sec bins. Red curve is a Poisson curve with rate = median count rate of data. |
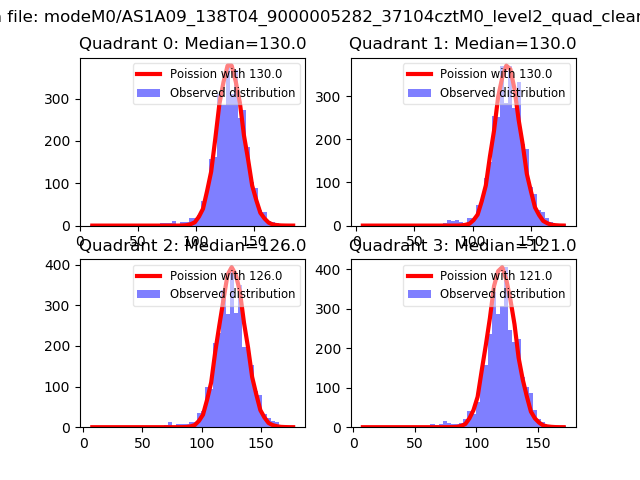 |
 |
| Quadrant-wise count rates Data is divided into 100 sec bins |
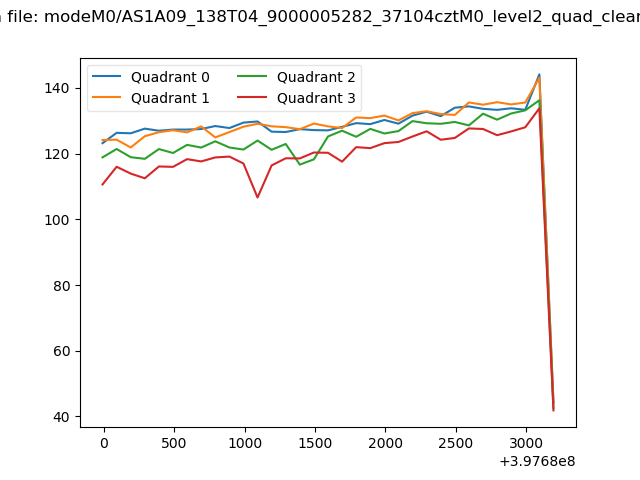 |
|
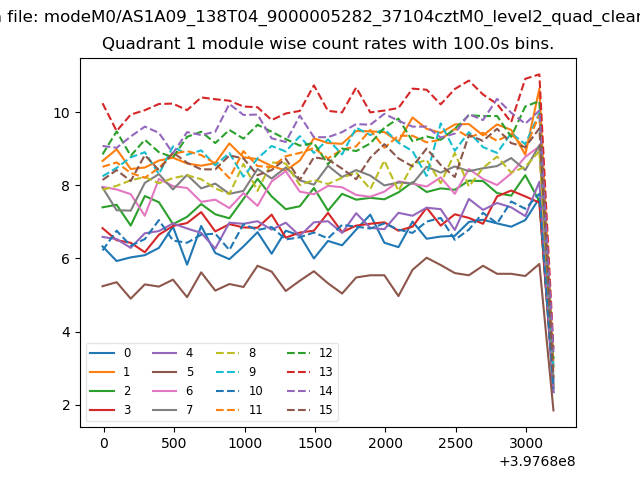
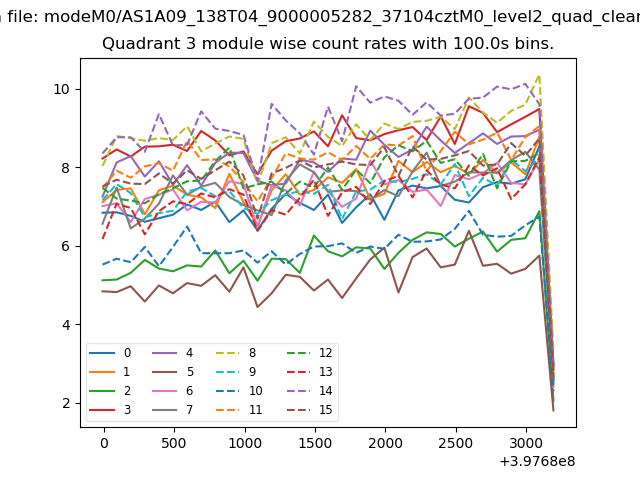
| Module-wise count rates for Quadrant A Data is divided into 100 sec bins |
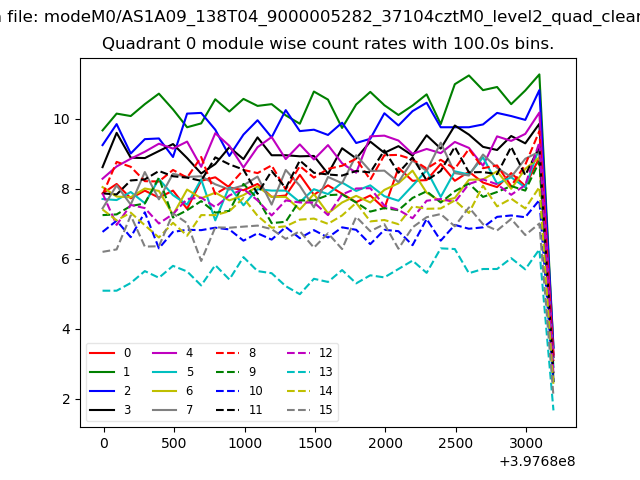 |
 |
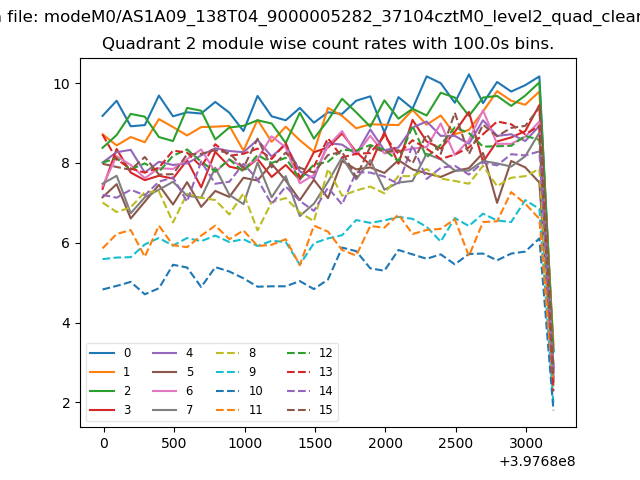
| Module-wise count rates for Quadrant B Data is divided into 100 sec bins |
 |
 |
| Module-wise count rates for Quadrant C Data is divided into 100 sec bins |
 |
 |
| Module-wise count rates for Quadrant D Data is divided into 100 sec bins |
 |
 |
| Parameter | Plot |
|---|---|
| CZT HV Monitor | 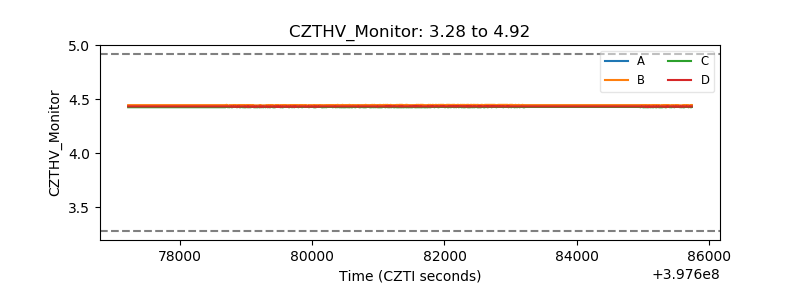 |
| D_VDD | 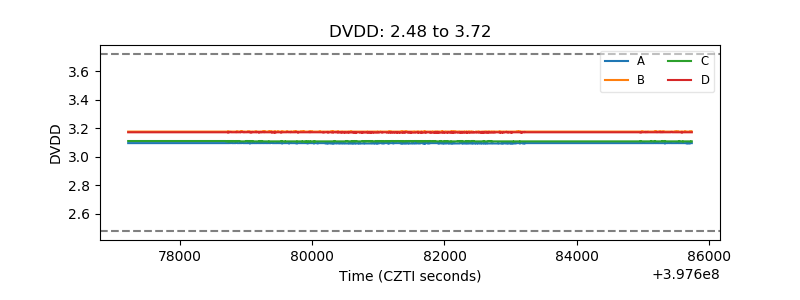 |
| Temperature 1 | 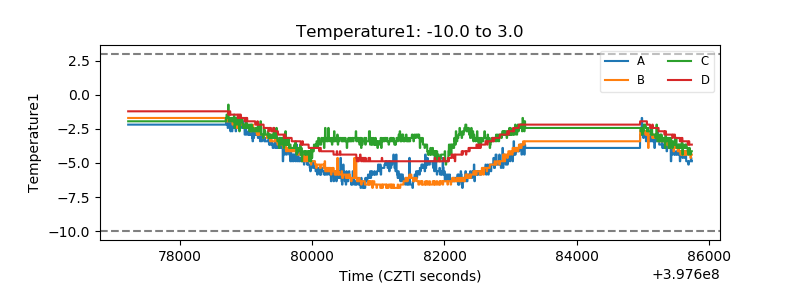 |
| Veto HV Monitor | 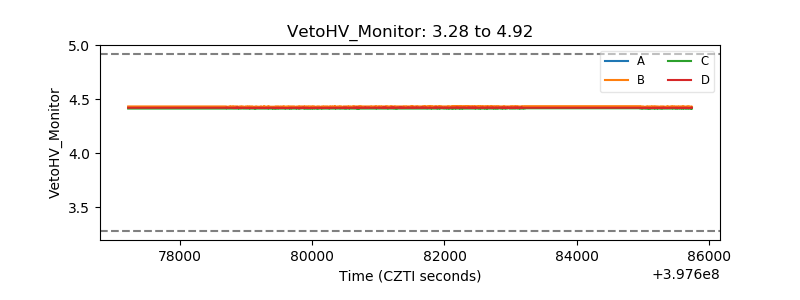 |
| Veto LLD | 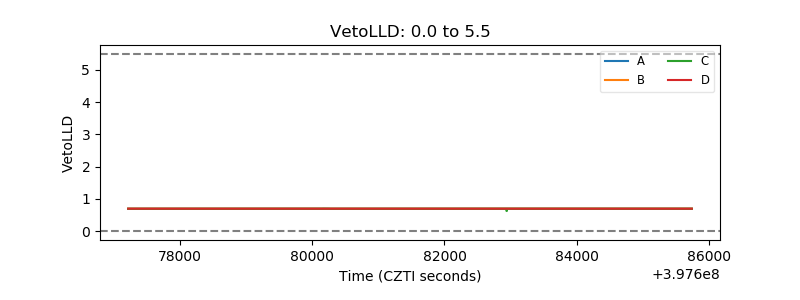 |
| Alpha Counter | 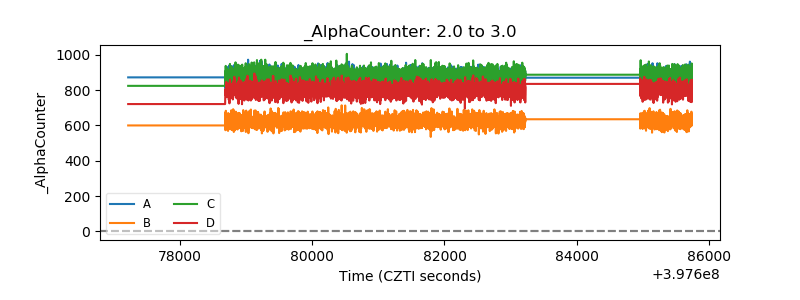 |
| _CPM_Rate | 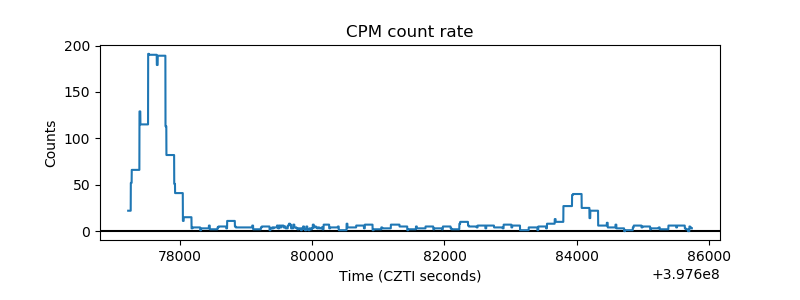 |
| CZT Counter | 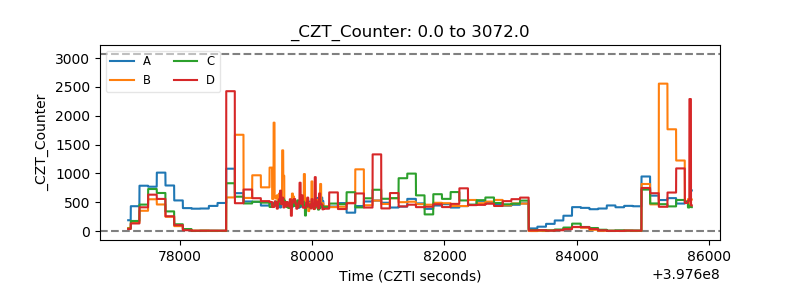 |
| +2.5 Volts monitor | 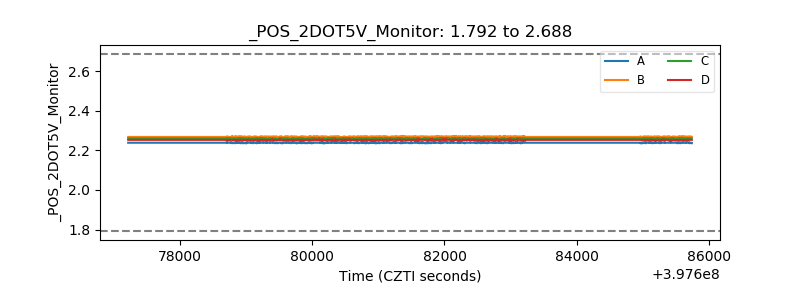 |
| +5 Volts monitor | 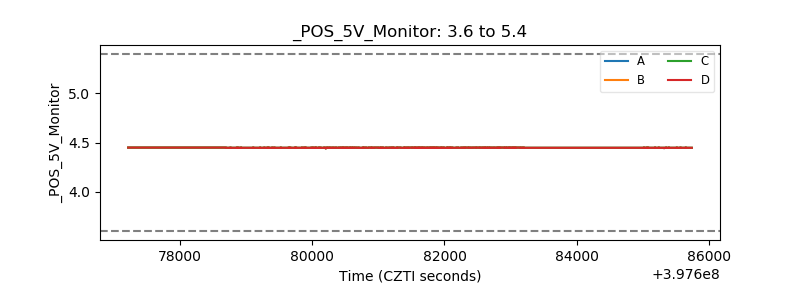 |
| _ROLL_ROT | 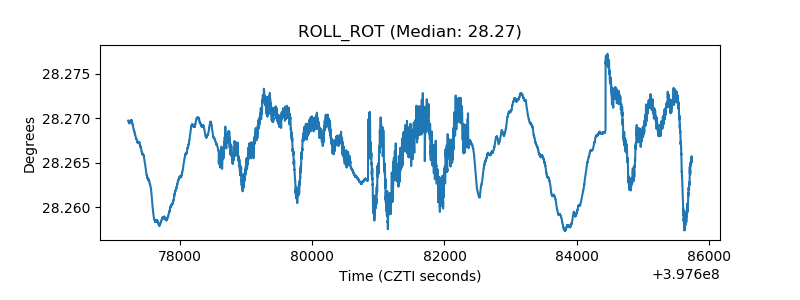 |
| _Roll_DEC | 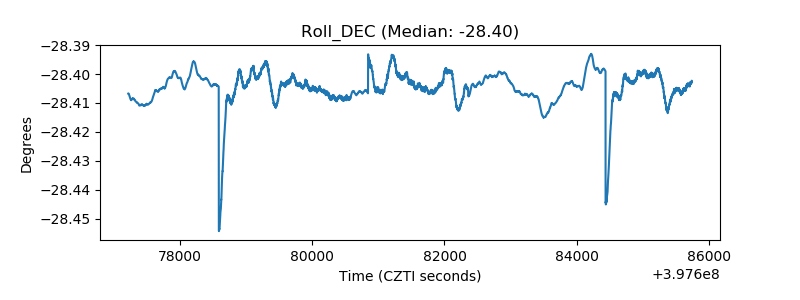 |
| _Roll_RA | 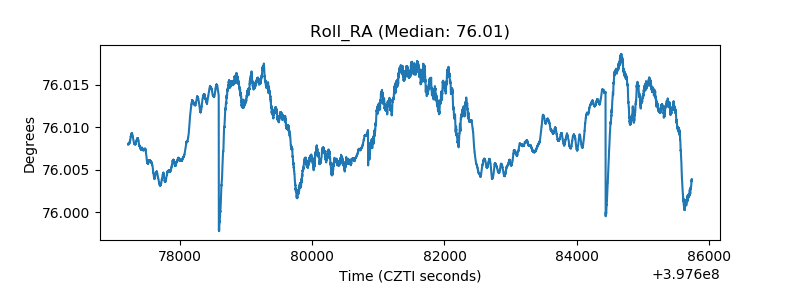 |
| Veto Counter | 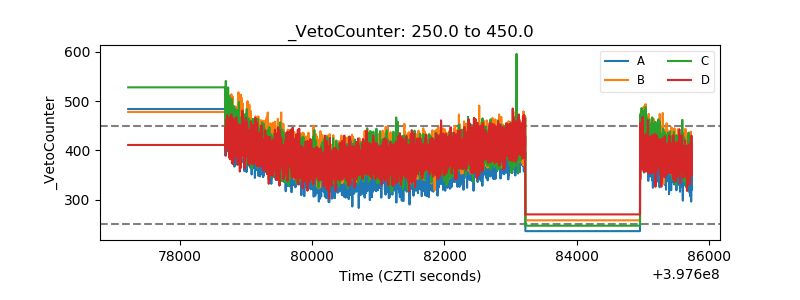 |