| Param | Original file | Final file |
|---|---|---|
| Filename | modeM0/AS1A09_138T04_9000005282_37105cztM0_level2.evt | modeM0/AS1A09_138T04_9000005282_37105cztM0_level2_quad_clean.evt |
| Size (bytes) | 443,995,200 | 77,166,720 |
| Size | 423.4 MB | 73.6 MB |
| Events in quadrant A | 2,997,162 | 500,538 |
| Events in quadrant B | 4,263,550 | 484,683 |
| Events in quadrant C | 2,789,253 | 485,726 |
| Events in quadrant D | 3,013,414 | 471,468 |
| Mode SS | |||
|---|---|---|---|
| Quadrant | BADHDUFLAG | Total packets | Discarded packets |
| A | 0 | 114 | 0 |
| B | 0 | 114 | 0 |
| C | 0 | 114 | 0 |
| D | 0 | 114 | 0 |
| Mode M0 | |||
|---|---|---|---|
| Quadrant | BADHDUFLAG | Total packets | Discarded packets |
| A | 0 | 12443 | 3 |
| B | 0 | 16319 | 2 |
| C | 0 | 11606 | 2 |
| D | 0 | 12844 | 2 |
| Mode M9 | |||
|---|---|---|---|
| Quadrant | BADHDUFLAG | Total packets | Discarded packets |
| A | 0 | 21 | 0 |
| B | 0 | 21 | 0 |
| C | 0 | 21 | 0 |
| D | 0 | 22 | 0 |
| Quadrant | Total seconds | Saturated seconds | Saturation percentage |
|---|---|---|---|
| A | 5638 | 80 | 1.418943% |
| B | 5638 | 504 | 8.939340% |
| C | 5638 | 11 | 0.195105% |
| D | 5638 | 80 | 1.418943% |
Noise dominated data is calculated using 1-second bins in cleaned event files. If a bin has >2000 counts, and if more than 50% of those come from <1% of pixels, then it is considered to be noise-dominated and hence unusable.
| Quadrant | # 1 sec bins | Bins with >0 counts | Bins with >2000 counts | High rate bins dominated by noise | Noise dominated (total time) | Noise dominated (detector-on time) | Marked lightcurve |
|---|---|---|---|---|---|---|---|
| A | 7071 | 5638 | 53 | 53 | 0.75% | 0.94% |  |
| B | 7071 | 5639 | 414 | 414 | 5.85% | 7.34% | 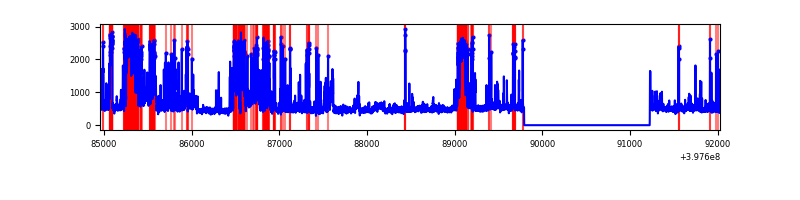 |
| C | 7071 | 5639 | 8 | 8 | 0.11% | 0.14% | 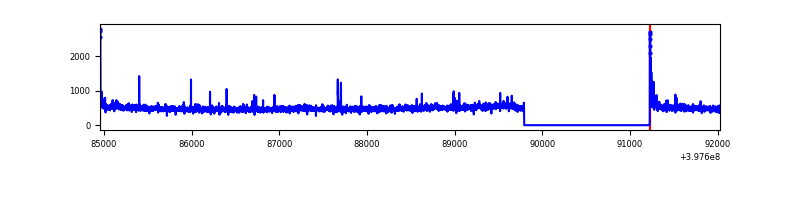 |
| D | 7071 | 5639 | 66 | 66 | 0.93% | 1.17% | 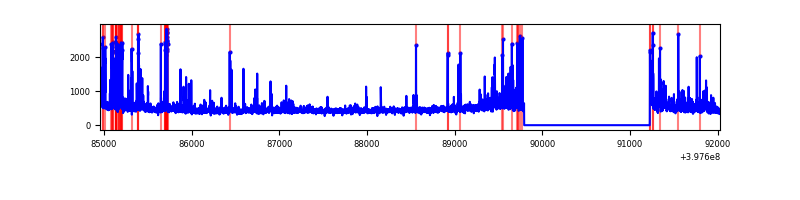 |
Top three noisy pixels from each quadrant. If the there are fewer than three noisy pixels in the level2.evt file, extra rows are filled as -1
| Pixel properties | Quadrant properties | ||||||
|---|---|---|---|---|---|---|---|
| Quadrant | DetID | PixID | Counts | Sigma | Mean | Median | Sigma |
| A | 10 | 83 | 272273 | 2081.43 | 648 | 635 | 130.5 |
| A | 15 | 237 | 150385 | 1147.46 | 648 | 635 | 130.5 |
| A | 7 | 16 | 33925 | 255.08 | 648 | 635 | 130.5 |
| B | 5 | 184 | 972080 | 8102.45 | 621 | 603 | 119.9 |
| B | 5 | 172 | 626740 | 5222.2 | 621 | 603 | 119.9 |
| B | 5 | 200 | 53880 | 444.35 | 621 | 603 | 119.9 |
| C | 15 | 214 | 240364 | 1629.15 | 630 | 635 | 147.1 |
| C | 0 | 10 | 46926 | 314.58 | 630 | 635 | 147.1 |
| C | 15 | 208 | 21623 | 142.63 | 630 | 635 | 147.1 |
| D | 12 | 233 | 131688 | 849.31 | 632 | 614 | 154.3 |
| D | 2 | 250 | 120266 | 775.3 | 632 | 614 | 154.3 |
| D | 13 | 171 | 96626 | 622.12 | 632 | 614 | 154.3 |
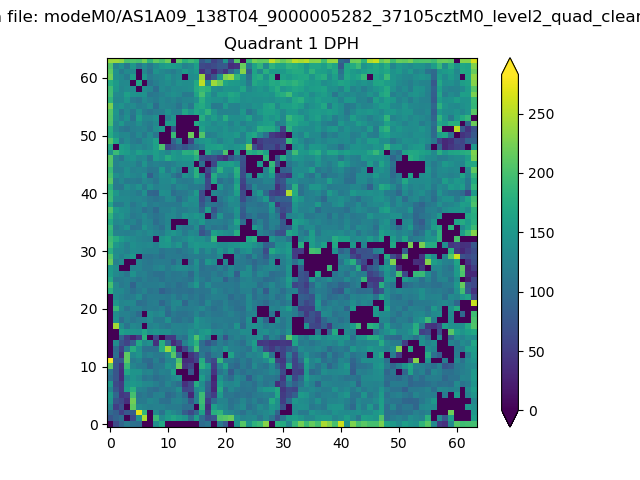
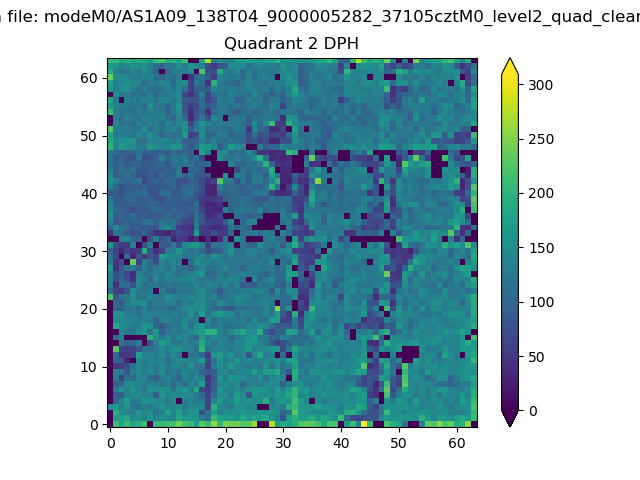
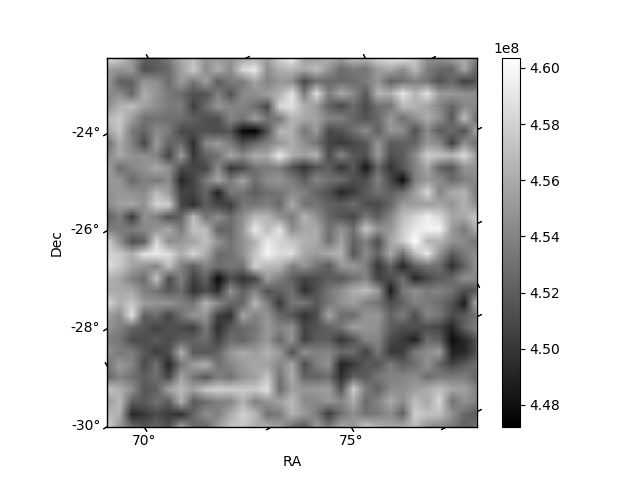
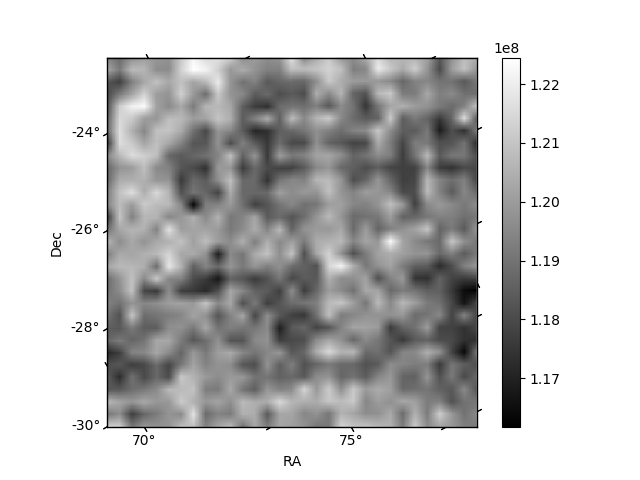
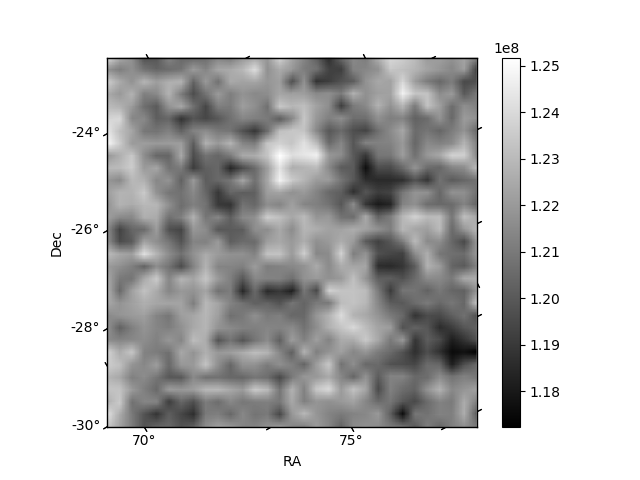
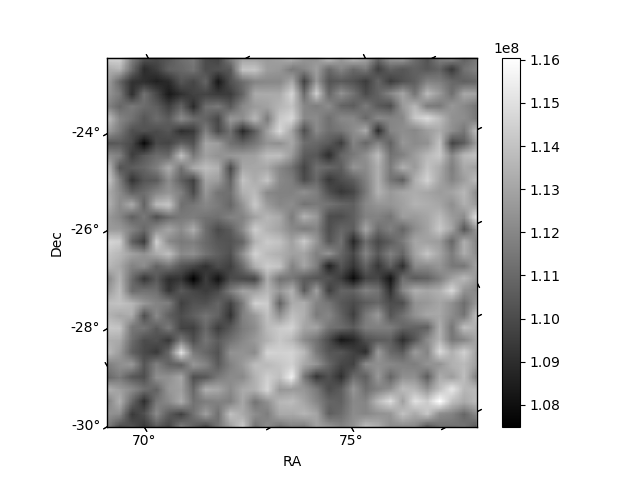
Histogram calculated using DETX and DETY for each event in the final _common_clean file
| Quadrant A | 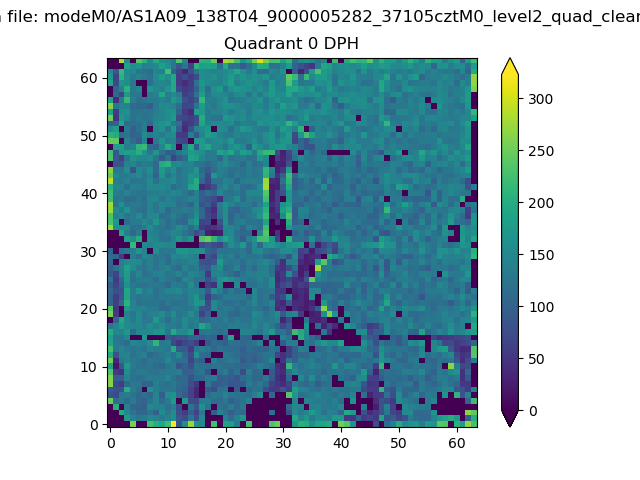 |
 |
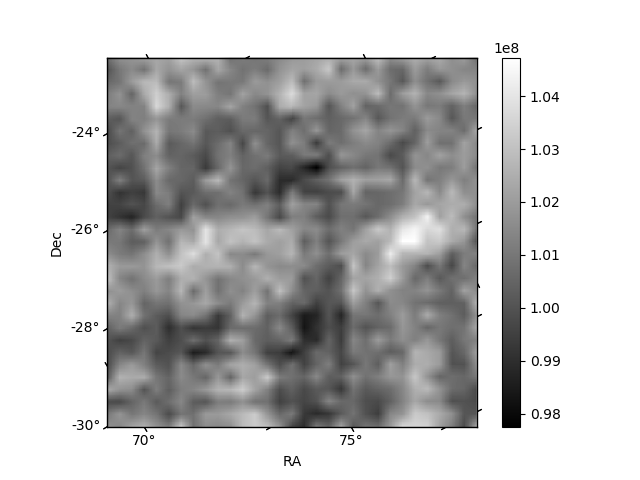
Quadrant B |
|---|---|---|---|
| Quadrant D | 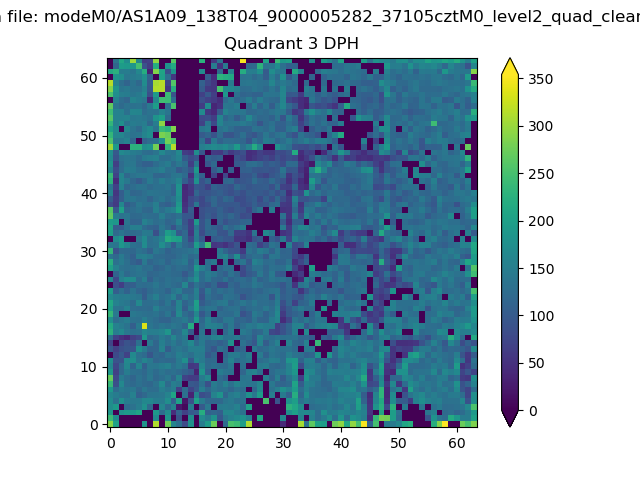 |
 |
Quadrant C |
| Plot type | Count rate plots | Images |
|---|---|---|
| Comparison with Poisson distribution Blue bars denote a histogram of data divided into 1 sec bins. Red curve is a Poisson curve with rate = median count rate of data. |
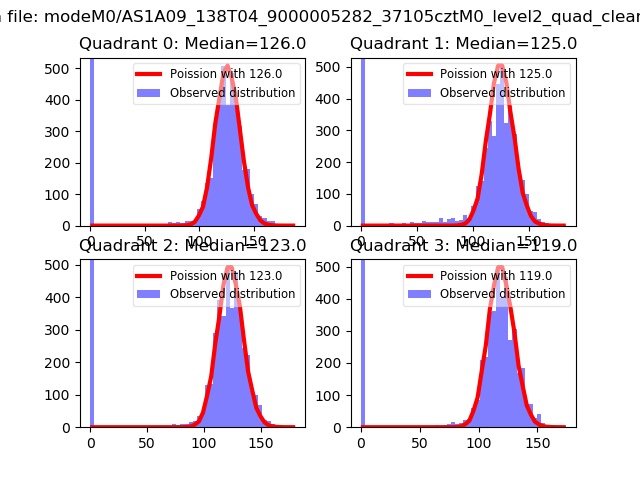 |
 |
| Quadrant-wise count rates Data is divided into 100 sec bins |
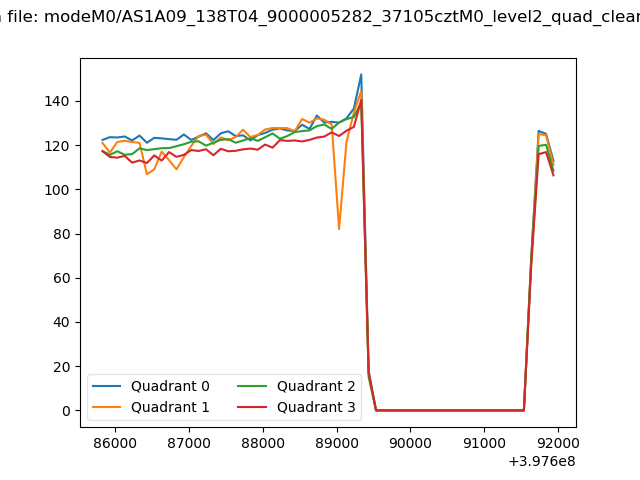 |
|
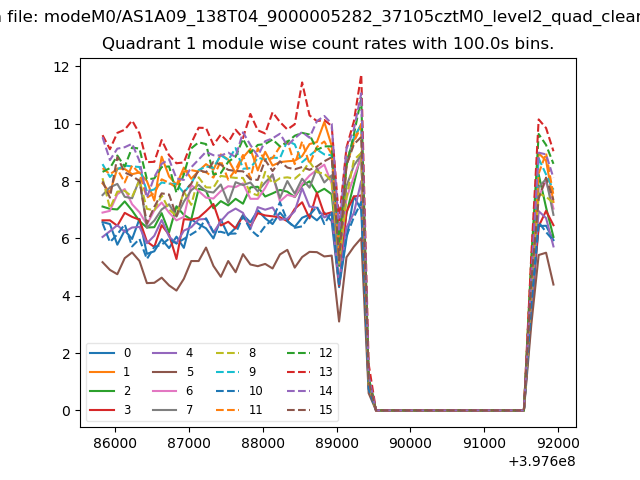
| Module-wise count rates for Quadrant A Data is divided into 100 sec bins |
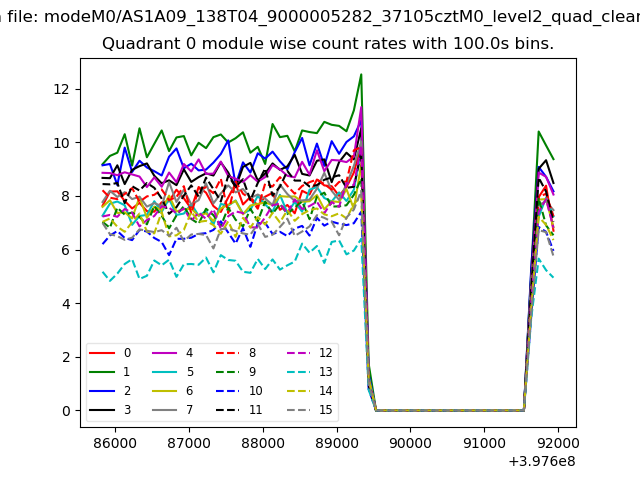 |
 |
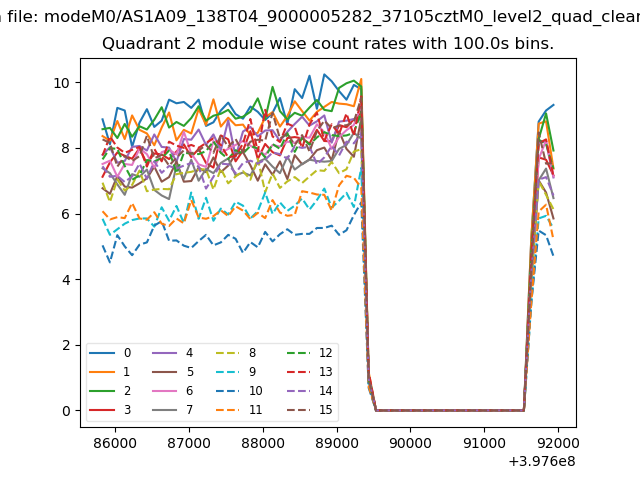
| Module-wise count rates for Quadrant B Data is divided into 100 sec bins |
 |
 |
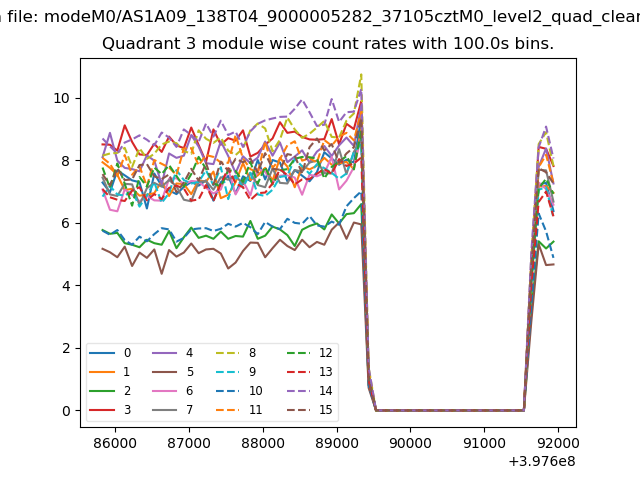
| Module-wise count rates for Quadrant C Data is divided into 100 sec bins |
 |
 |
| Module-wise count rates for Quadrant D Data is divided into 100 sec bins |
 |
 |
| Parameter | Plot |
|---|---|
| CZT HV Monitor | 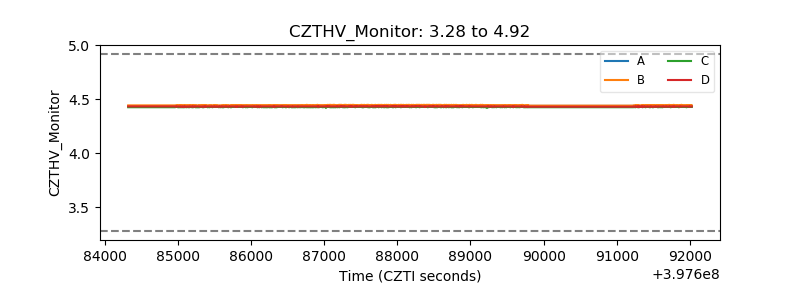 |
| D_VDD | 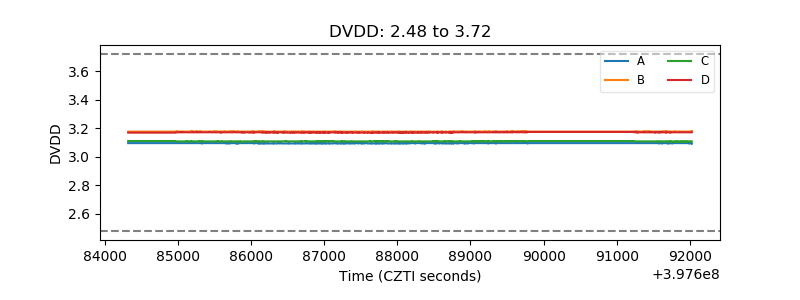 |
| Temperature 1 | 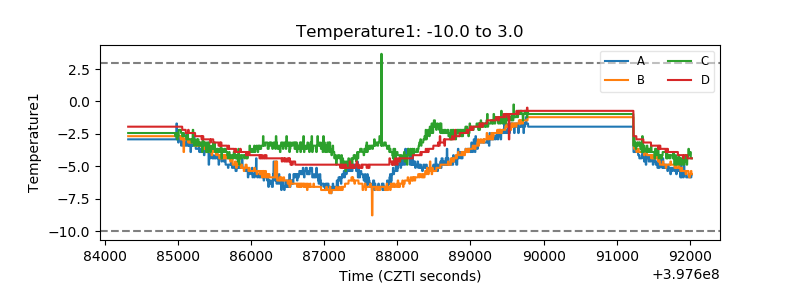 |
| Veto HV Monitor | 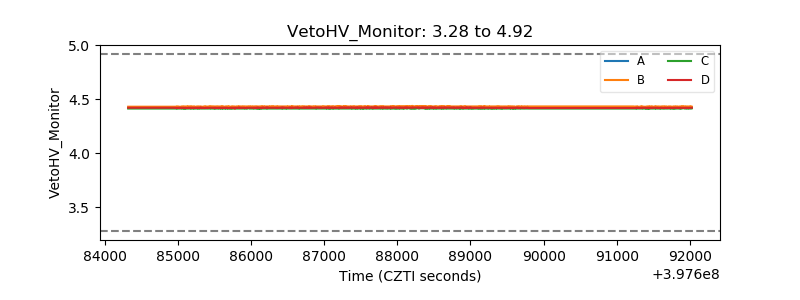 |
| Veto LLD | 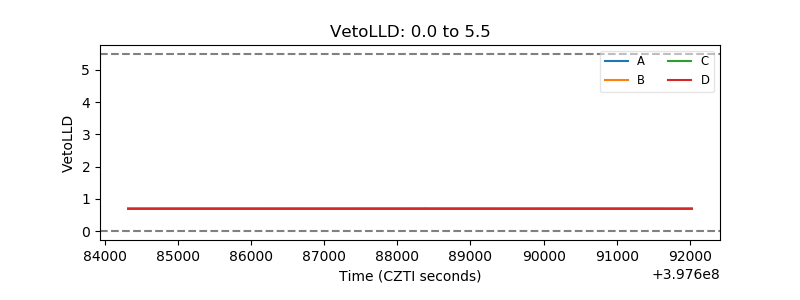 |
| Alpha Counter | 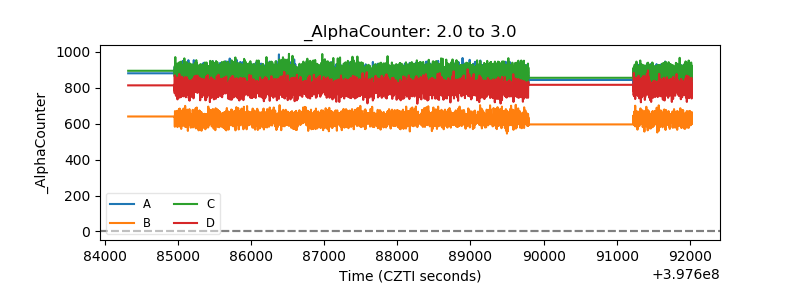 |
| _CPM_Rate | 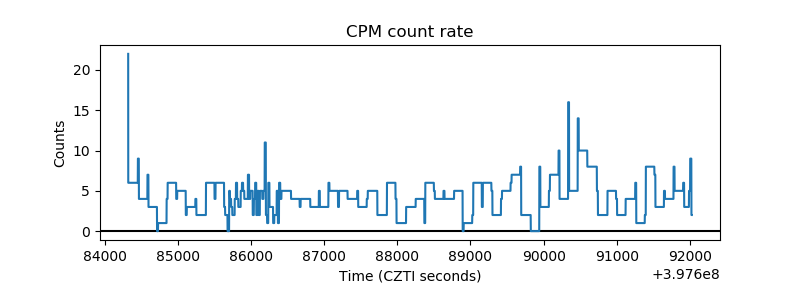 |
| CZT Counter | 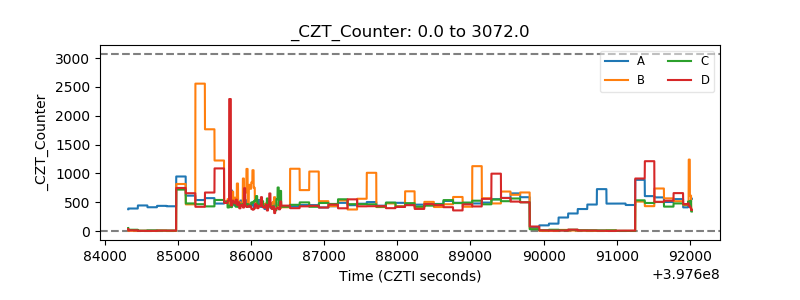 |
| +2.5 Volts monitor | 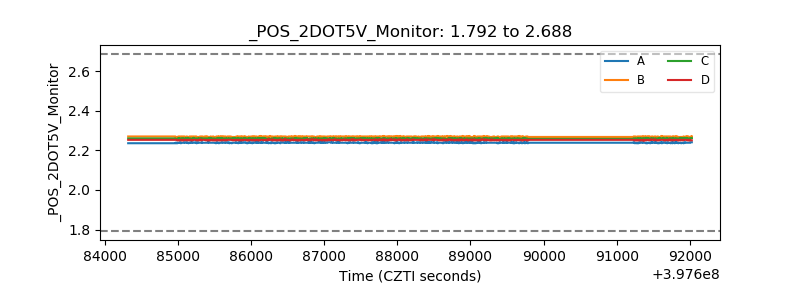 |
| +5 Volts monitor | 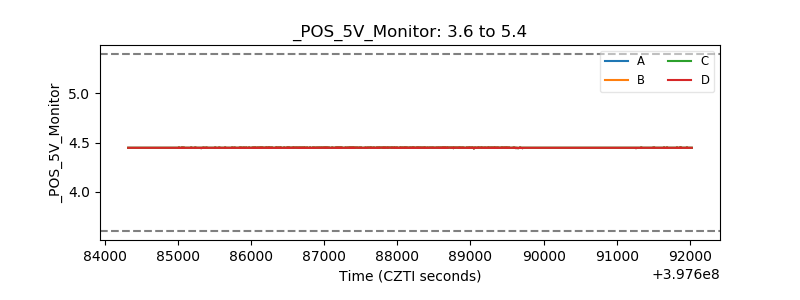 |
| _ROLL_ROT | 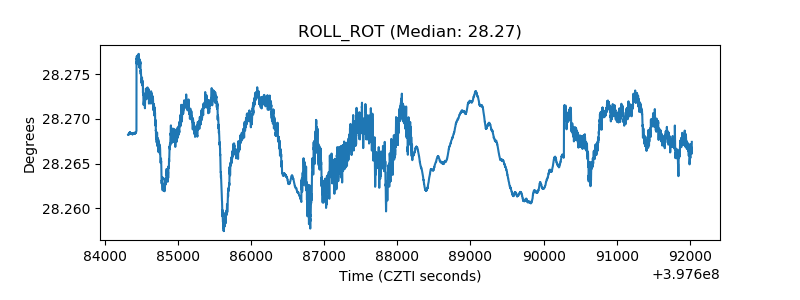 |
| _Roll_DEC | 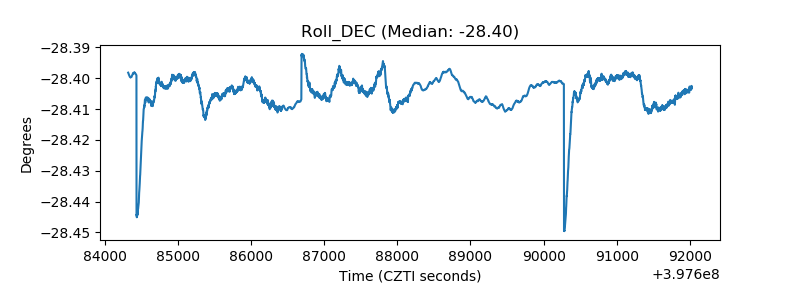 |
| _Roll_RA | 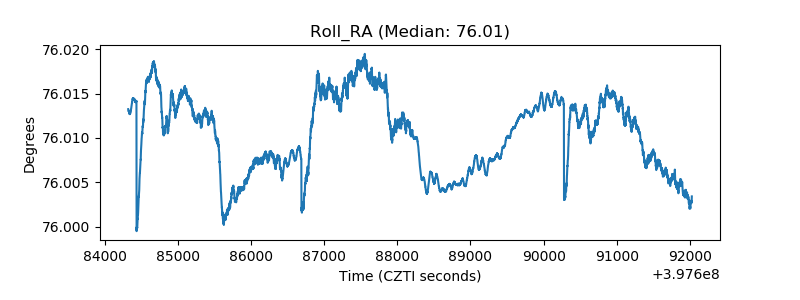 |
| Veto Counter |  |