| Param | Original file | Final file |
|---|---|---|
| Filename | modeM0/AS1A09_138T04_9000005282_37106cztM0_level2.evt | modeM0/AS1A09_138T04_9000005282_37106cztM0_level2_quad_clean.evt |
| Size (bytes) | 441,149,760 | 85,389,120 |
| Size | 420.7 MB | 81.4 MB |
| Events in quadrant A | 2,953,704 | 556,490 |
| Events in quadrant B | 3,547,581 | 554,355 |
| Events in quadrant C | 2,997,472 | 545,165 |
| Events in quadrant D | 3,461,810 | 518,894 |
| Mode SS | |||
|---|---|---|---|
| Quadrant | BADHDUFLAG | Total packets | Discarded packets |
| A | 0 | 120 | 0 |
| B | 0 | 120 | 0 |
| C | 0 | 120 | 0 |
| D | 0 | 120 | 0 |
| Mode M0 | |||
|---|---|---|---|
| Quadrant | BADHDUFLAG | Total packets | Discarded packets |
| A | 0 | 12441 | 3 |
| B | 0 | 14260 | 2 |
| C | 0 | 12407 | 2 |
| D | 0 | 14384 | 2 |
| Mode M9 | |||
|---|---|---|---|
| Quadrant | BADHDUFLAG | Total packets | Discarded packets |
| A | 0 | 19 | 0 |
| B | 0 | 19 | 0 |
| C | 0 | 19 | 0 |
| D | 0 | 20 | 0 |
| Quadrant | Total seconds | Saturated seconds | Saturation percentage |
|---|---|---|---|
| A | 5881 | 14 | 0.238055% |
| B | 5881 | 193 | 3.281755% |
| C | 5881 | 22 | 0.374086% |
| D | 5881 | 116 | 1.972454% |
Noise dominated data is calculated using 1-second bins in cleaned event files. If a bin has >2000 counts, and if more than 50% of those come from <1% of pixels, then it is considered to be noise-dominated and hence unusable.
| Quadrant | # 1 sec bins | Bins with >0 counts | Bins with >2000 counts | High rate bins dominated by noise | Noise dominated (total time) | Noise dominated (detector-on time) | Marked lightcurve |
|---|---|---|---|---|---|---|---|
| A | 7195 | 5882 | 10 | 10 | 0.14% | 0.17% | 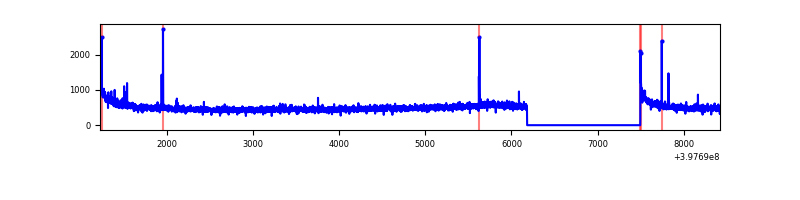 |
| B | 7195 | 5882 | 154 | 154 | 2.14% | 2.62% | 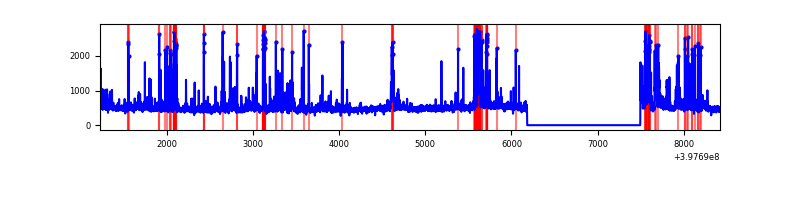 |
| C | 7195 | 5882 | 17 | 17 | 0.24% | 0.29% | 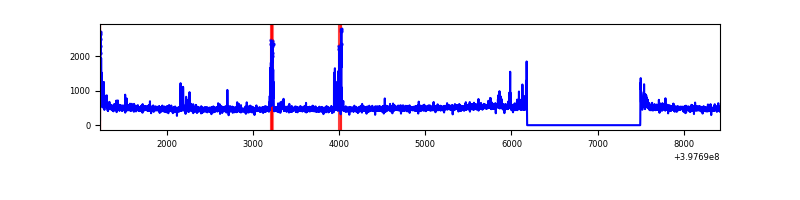 |
| D | 7195 | 5882 | 114 | 114 | 1.58% | 1.94% | 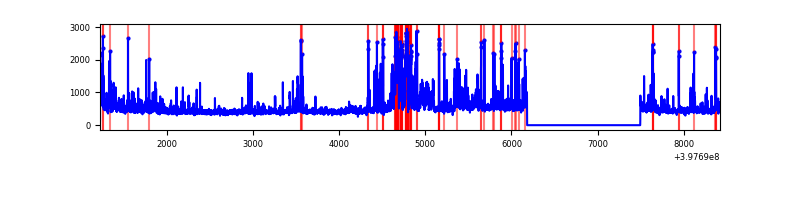 |
Top three noisy pixels from each quadrant. If the there are fewer than three noisy pixels in the level2.evt file, extra rows are filled as -1
| Pixel properties | Quadrant properties | ||||||
|---|---|---|---|---|---|---|---|
| Quadrant | DetID | PixID | Counts | Sigma | Mean | Median | Sigma |
| A | 10 | 83 | 274416 | 1991.29 | 677 | 665 | 137.5 |
| A | 13 | 6 | 25545 | 180.98 | 677 | 665 | 137.5 |
| A | 15 | 237 | 17527 | 122.66 | 677 | 665 | 137.5 |
| B | 5 | 172 | 404037 | 3138.95 | 663 | 645 | 128.5 |
| B | 0 | 190 | 170366 | 1320.67 | 663 | 645 | 128.5 |
| B | 15 | 85 | 137271 | 1063.14 | 663 | 645 | 128.5 |
| C | 15 | 214 | 252144 | 1621.73 | 657 | 661 | 155.1 |
| C | 14 | 254 | 93746 | 600.27 | 657 | 661 | 155.1 |
| C | 0 | 10 | 48381 | 307.73 | 657 | 661 | 155.1 |
| D | 12 | 17 | 401493 | 2511.82 | 653 | 635 | 159.6 |
| D | 13 | 171 | 163891 | 1022.98 | 653 | 635 | 159.6 |
| D | 13 | 249 | 91631 | 570.19 | 653 | 635 | 159.6 |
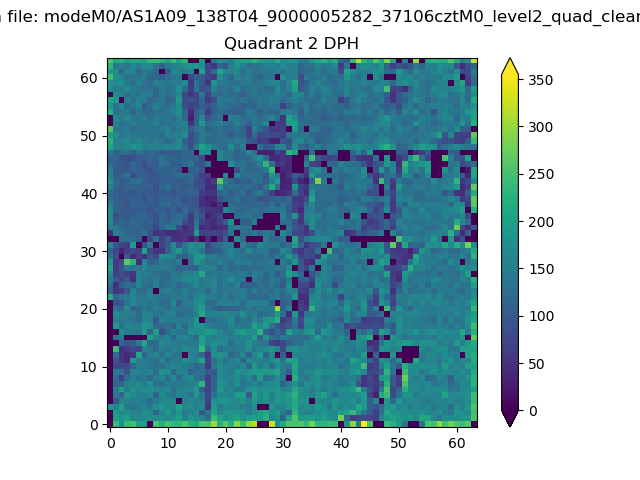
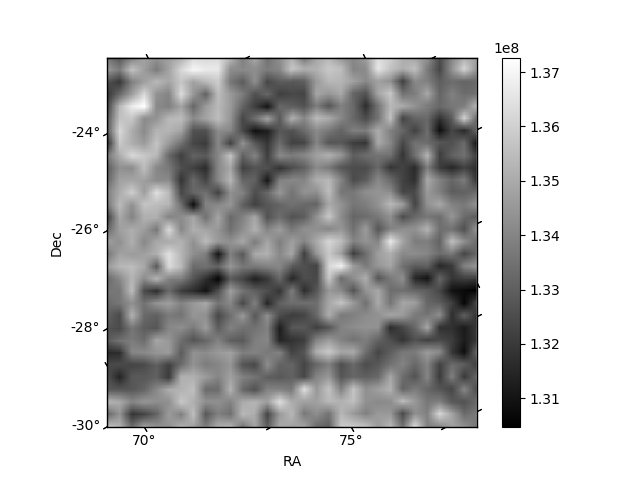
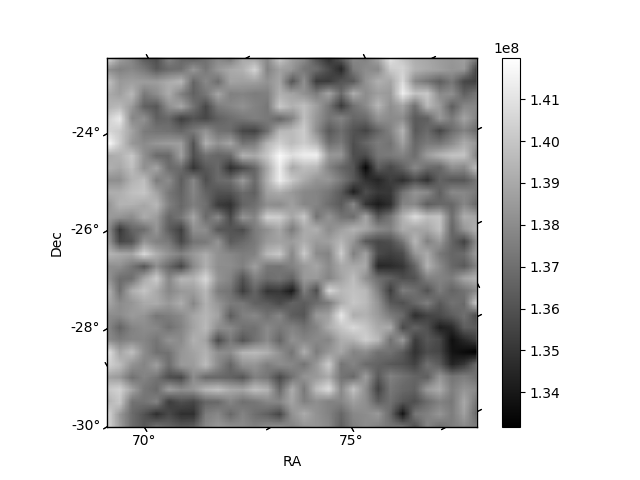
Histogram calculated using DETX and DETY for each event in the final _common_clean file
| Quadrant A | 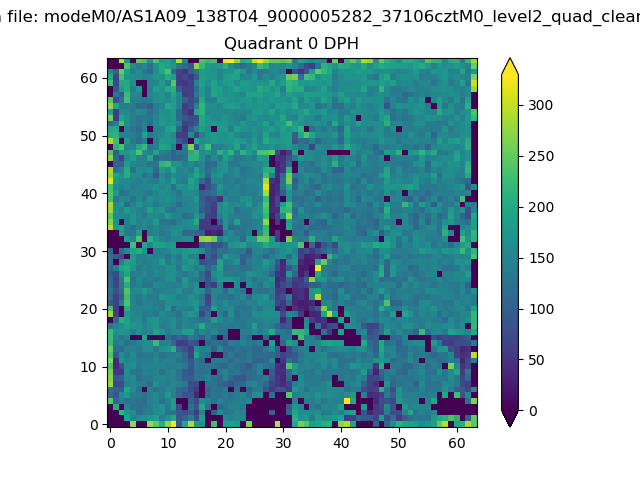 |
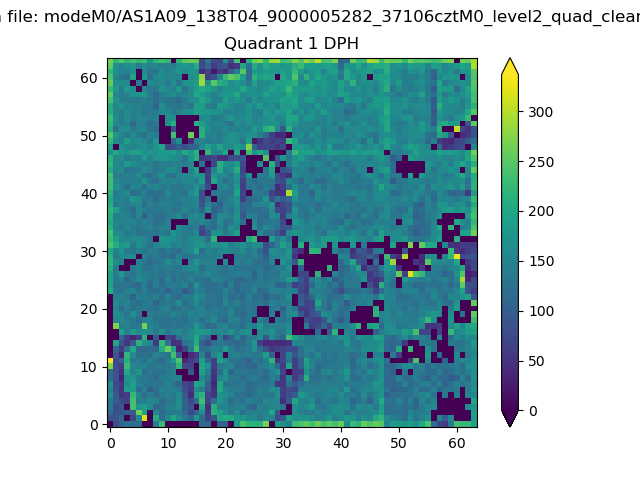 |
Quadrant B |
|---|---|---|---|
| Quadrant D | 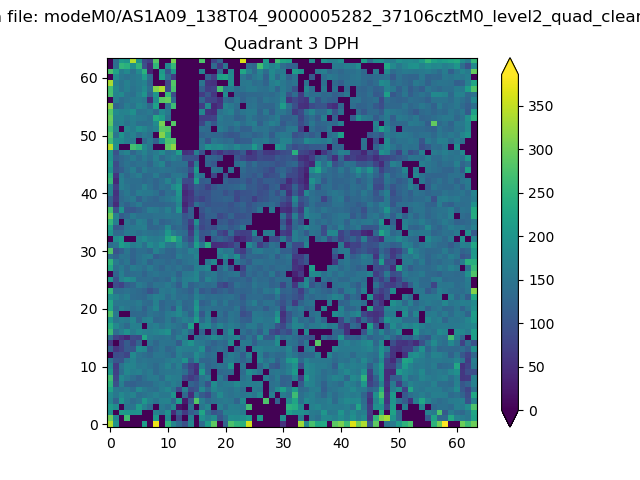 |
 |
Quadrant C |
| Plot type | Count rate plots | Images |
|---|---|---|
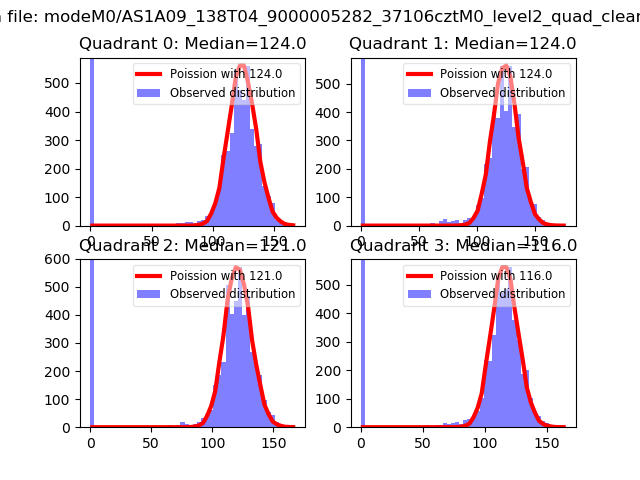
| Comparison with Poisson distribution Blue bars denote a histogram of data divided into 1 sec bins. Red curve is a Poisson curve with rate = median count rate of data. |
 |
 |
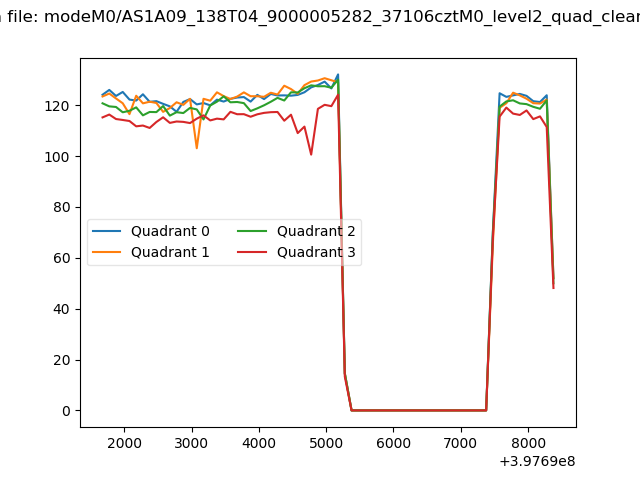
| Quadrant-wise count rates Data is divided into 100 sec bins |
 |
|
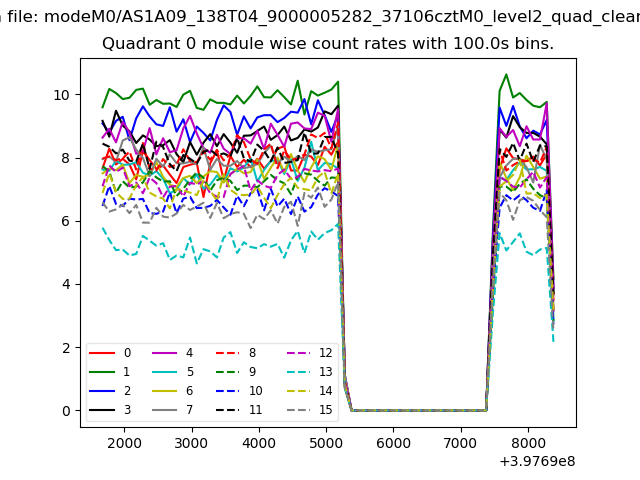
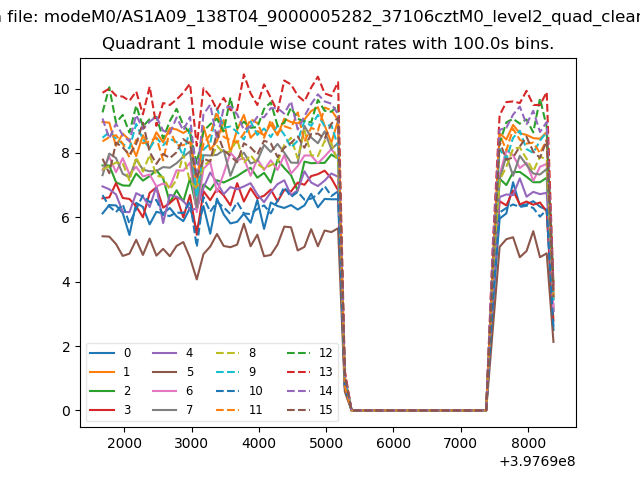
| Module-wise count rates for Quadrant A Data is divided into 100 sec bins |
 |
 |
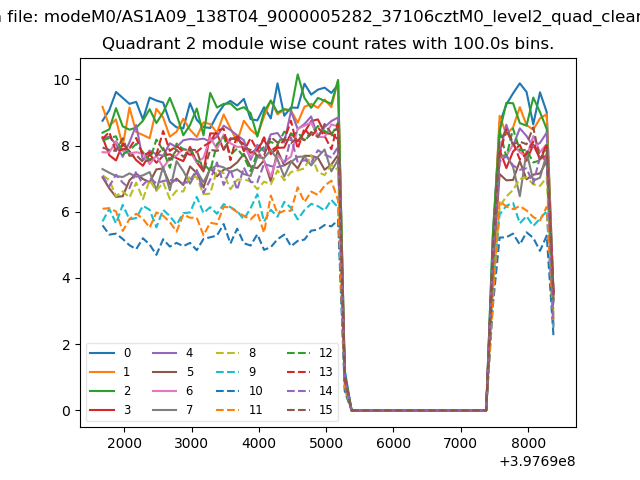
| Module-wise count rates for Quadrant B Data is divided into 100 sec bins |
 |
 |
| Module-wise count rates for Quadrant C Data is divided into 100 sec bins |
 |
 |
| Module-wise count rates for Quadrant D Data is divided into 100 sec bins |
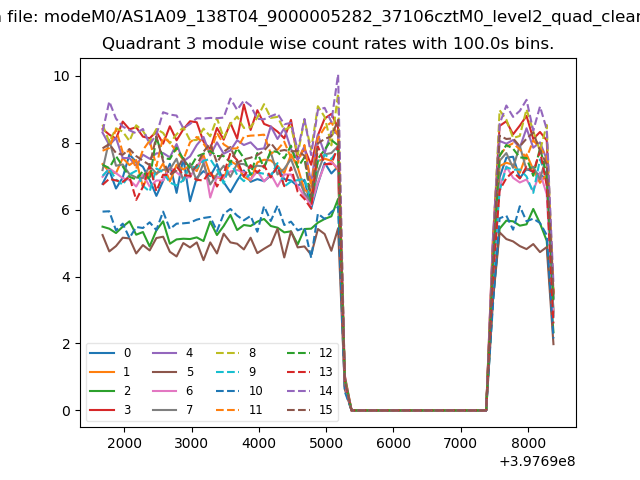 |
 |
| Parameter | Plot |
|---|---|
| CZT HV Monitor |  |
| D_VDD | 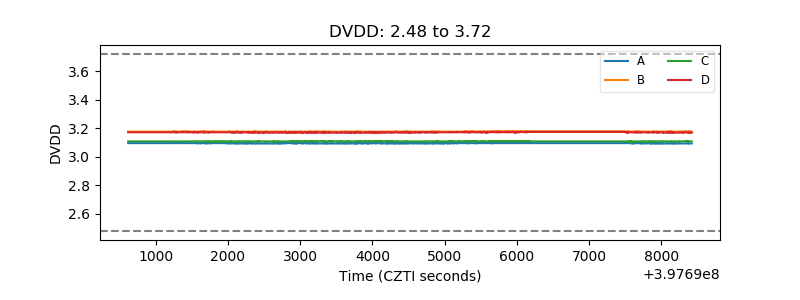 |
| Temperature 1 | 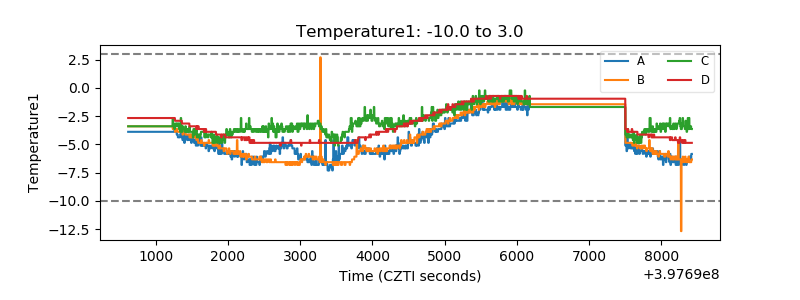 |
| Veto HV Monitor | 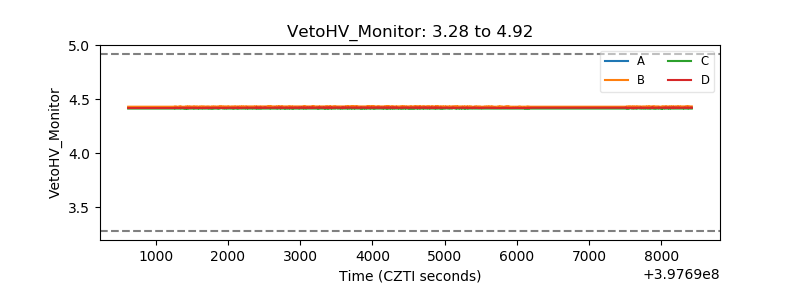 |
| Veto LLD | 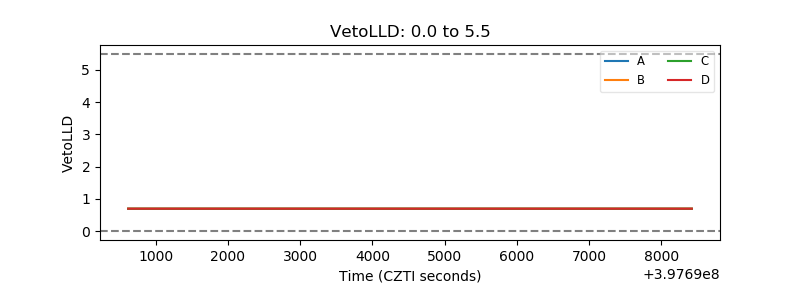 |
| Alpha Counter | 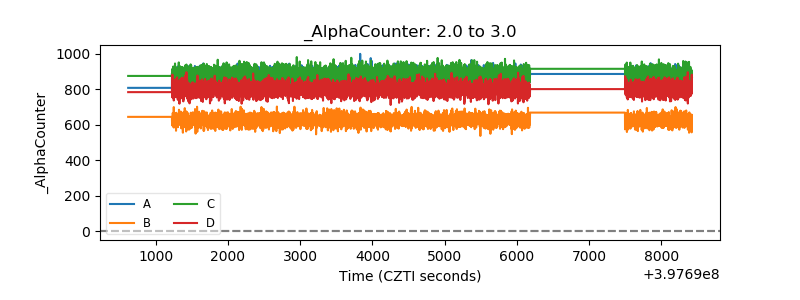 |
| _CPM_Rate | 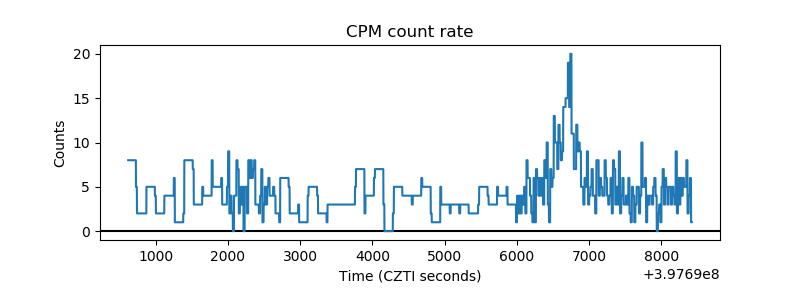 |
| CZT Counter | 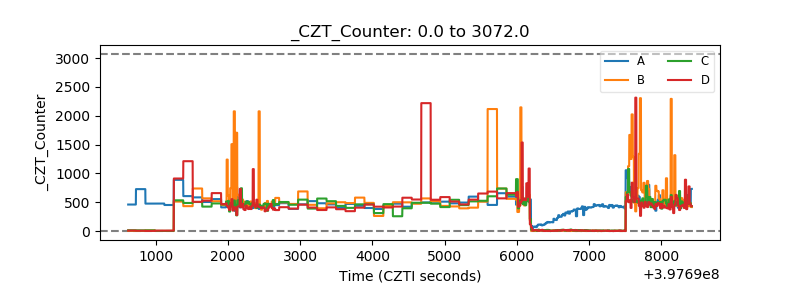 |
| +2.5 Volts monitor | 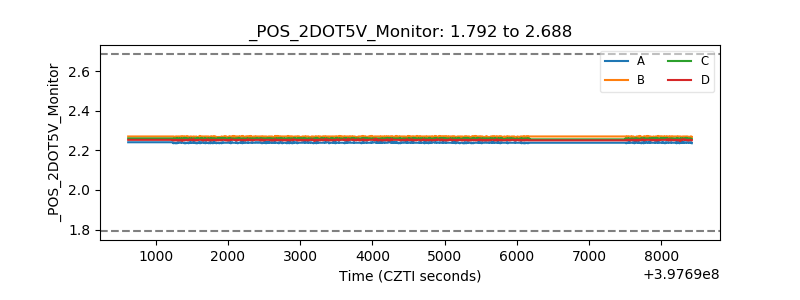 |
| +5 Volts monitor | 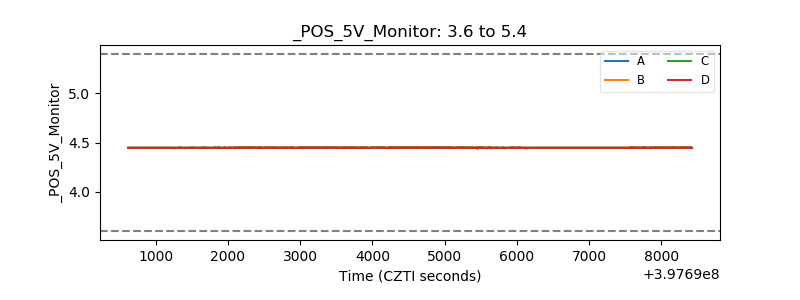 |
| _ROLL_ROT | 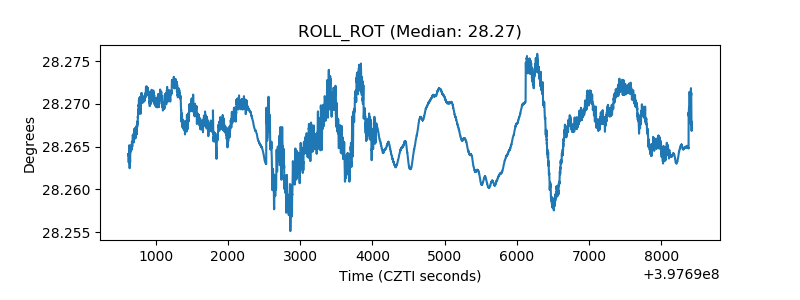 |
| _Roll_DEC | 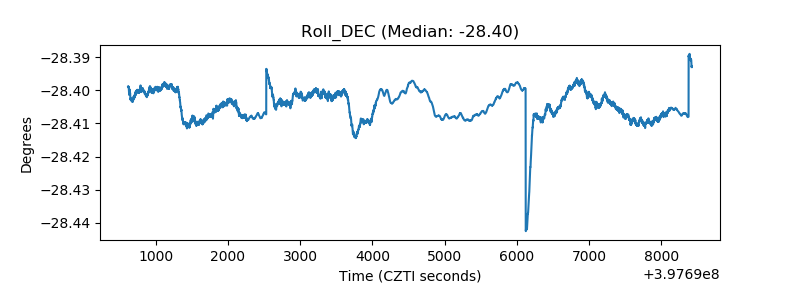 |
| _Roll_RA | 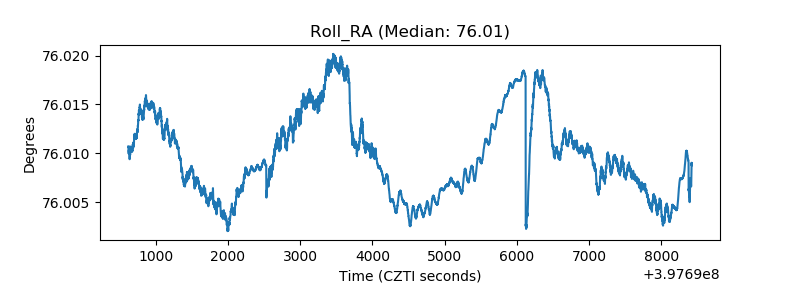 |
| Veto Counter | 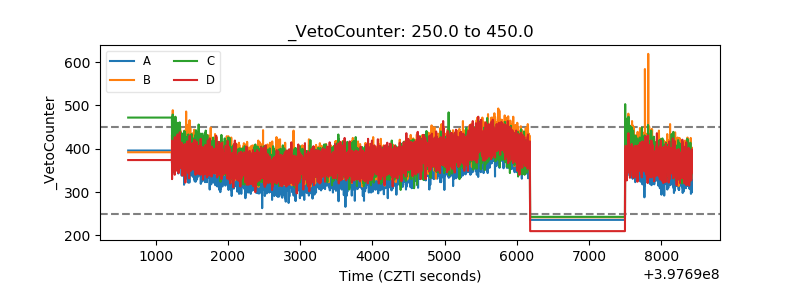 |