| Param | Original file | Final file |
|---|---|---|
| Filename | modeM0/AS1A09_138T04_9000005282_37109cztM0_level2.evt | modeM0/AS1A09_138T04_9000005282_37109cztM0_level2_quad_clean.evt |
| Size (bytes) | 1,359,109,440 | 200,926,080 |
| Size | 1.3 GB | 191.6 MB |
| Events in quadrant A | 8,199,956 | 1,270,495 |
| Events in quadrant B | 9,709,944 | 1,271,272 |
| Events in quadrant C | 7,773,685 | 1,263,398 |
| Events in quadrant D | 14,411,622 | 1,191,329 |
| Mode SS | |||
|---|---|---|---|
| Quadrant | BADHDUFLAG | Total packets | Discarded packets |
| A | 0 | 324 | 0 |
| B | 0 | 324 | 0 |
| C | 0 | 324 | 0 |
| D | 0 | 324 | 0 |
| Mode M0 | |||
|---|---|---|---|
| Quadrant | BADHDUFLAG | Total packets | Discarded packets |
| A | 0 | 34372 | 5 |
| B | 0 | 39317 | 4 |
| C | 0 | 32590 | 4 |
| D | 0 | 53959 | 4 |
| Mode M9 | |||
|---|---|---|---|
| Quadrant | BADHDUFLAG | Total packets | Discarded packets |
| A | 0 | 55 | 0 |
| B | 0 | 55 | 0 |
| C | 0 | 55 | 0 |
| D | 0 | 55 | 0 |
| Quadrant | Total seconds | Saturated seconds | Saturation percentage |
|---|---|---|---|
| A | 15782 | 132 | 0.836396% |
| B | 15782 | 585 | 3.706755% |
| C | 15782 | 37 | 0.234444% |
| D | 15782 | 2797 | 17.722722% |
Noise dominated data is calculated using 1-second bins in cleaned event files. If a bin has >2000 counts, and if more than 50% of those come from <1% of pixels, then it is considered to be noise-dominated and hence unusable.
| Quadrant | # 1 sec bins | Bins with >0 counts | Bins with >2000 counts | High rate bins dominated by noise | Noise dominated (total time) | Noise dominated (detector-on time) | Marked lightcurve |
|---|---|---|---|---|---|---|---|
| A | 21275 | 15786 | 69 | 69 | 0.32% | 0.44% | 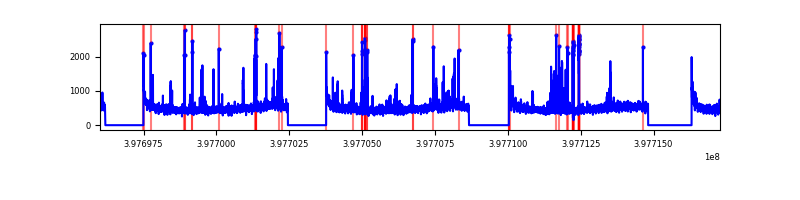 |
| B | 21275 | 15786 | 432 | 432 | 2.03% | 2.74% | 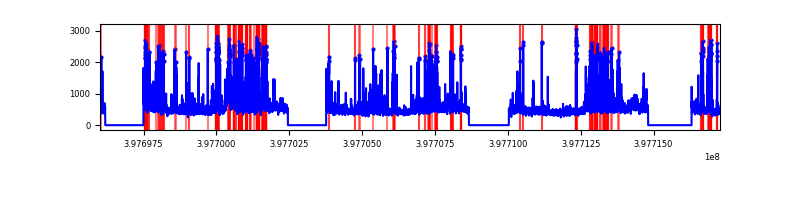 |
| C | 21275 | 15786 | 21 | 21 | 0.10% | 0.13% | 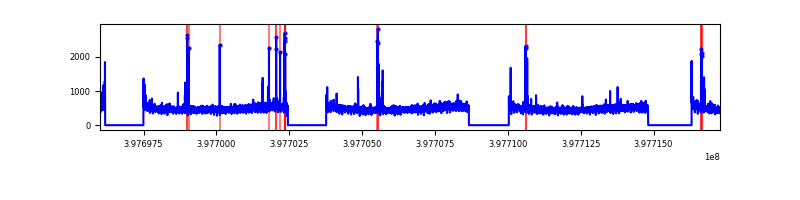 |
| D | 21275 | 15784 | 2703 | 2703 | 12.71% | 17.12% | 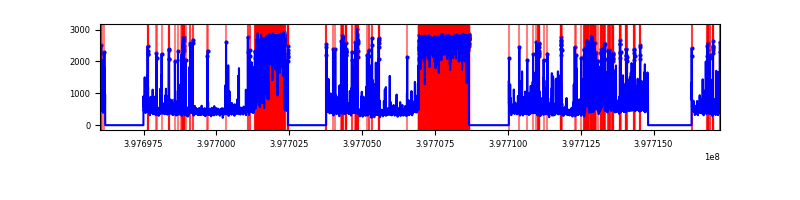 |
Top three noisy pixels from each quadrant. If the there are fewer than three noisy pixels in the level2.evt file, extra rows are filled as -1
| Pixel properties | Quadrant properties | ||||||
|---|---|---|---|---|---|---|---|
| Quadrant | DetID | PixID | Counts | Sigma | Mean | Median | Sigma |
| A | 10 | 83 | 654741 | 1810.87 | 1806 | 1768 | 360.6 |
| A | 9 | 143 | 375900 | 1037.57 | 1806 | 1768 | 360.6 |
| A | 15 | 237 | 70971 | 191.92 | 1806 | 1768 | 360.6 |
| B | 5 | 184 | 1091023 | 3224.14 | 1775 | 1726 | 337.9 |
| B | 5 | 172 | 755738 | 2231.75 | 1775 | 1726 | 337.9 |
| B | 5 | 200 | 345980 | 1018.94 | 1775 | 1726 | 337.9 |
| C | 15 | 214 | 665448 | 1629.94 | 1760 | 1775 | 407.2 |
| C | 14 | 254 | 152610 | 370.44 | 1760 | 1775 | 407.2 |
| C | 0 | 10 | 35237 | 82.18 | 1760 | 1775 | 407.2 |
| D | 12 | 233 | 6161704 | 16354.87 | 1544 | 1501 | 376.7 |
| D | 13 | 249 | 894549 | 2370.97 | 1544 | 1501 | 376.7 |
| D | 13 | 171 | 585545 | 1550.59 | 1544 | 1501 | 376.7 |
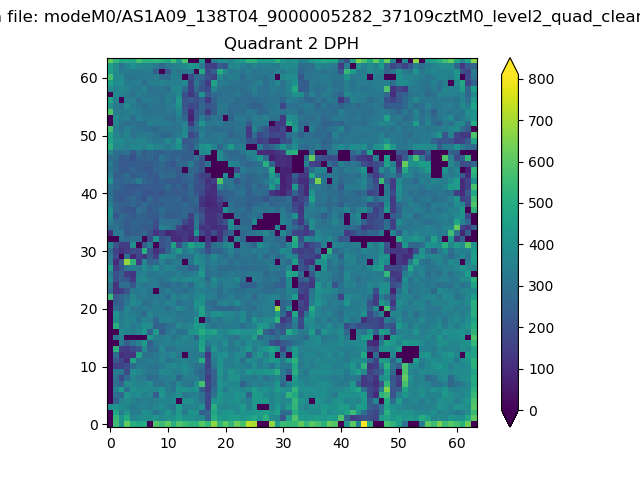
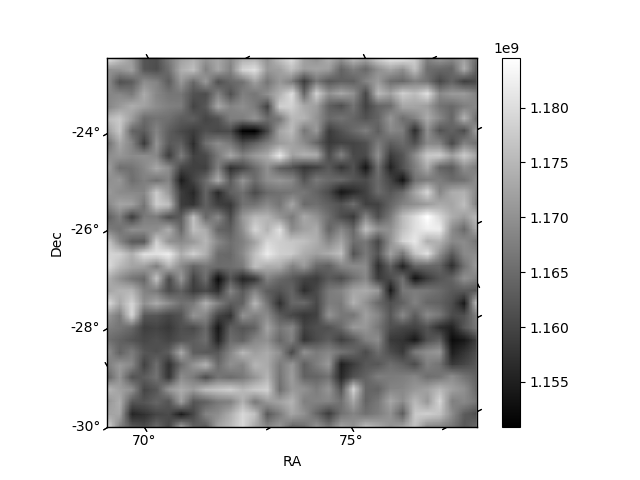
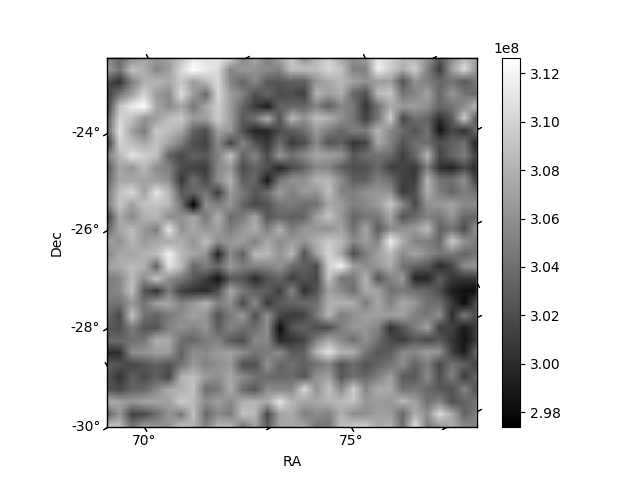
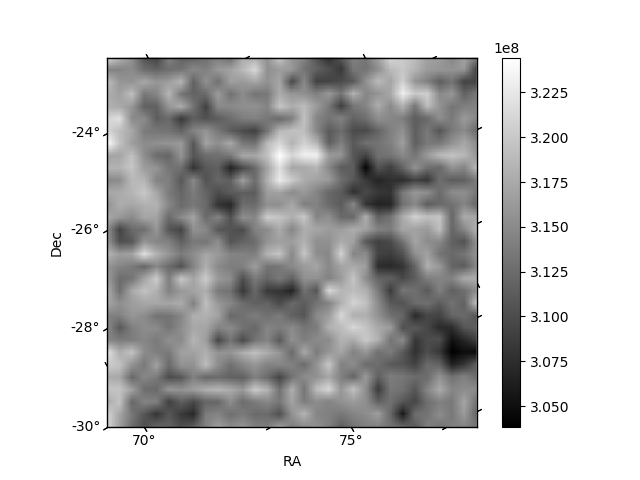
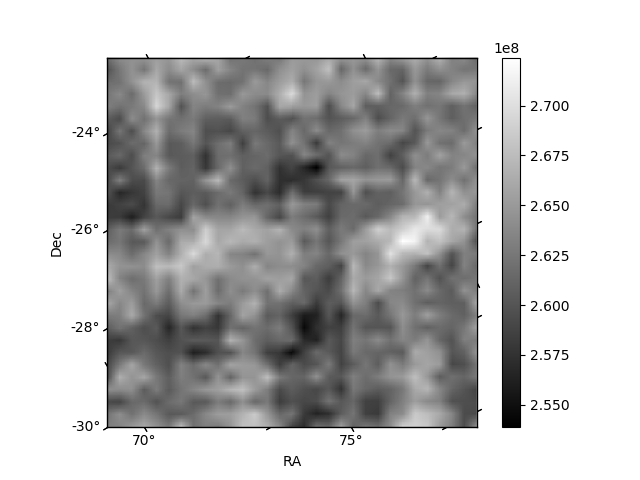
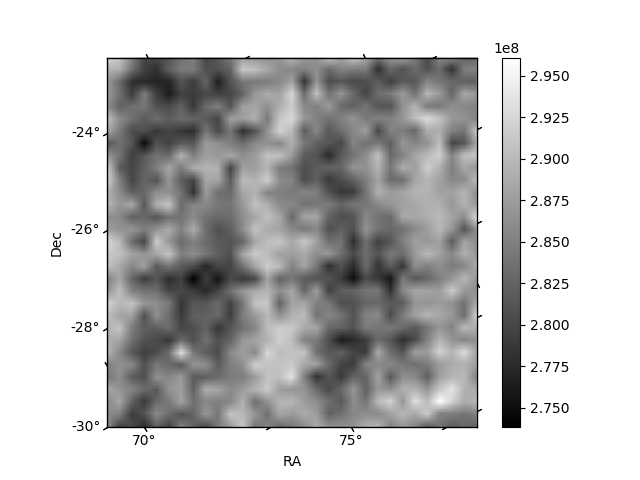
Histogram calculated using DETX and DETY for each event in the final _common_clean file
| Quadrant A | 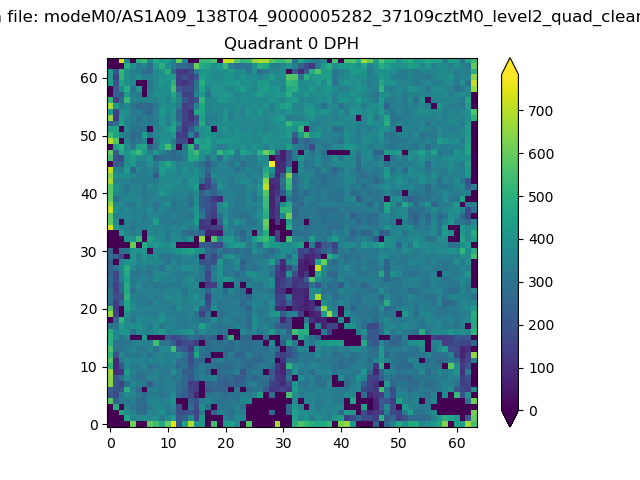 |
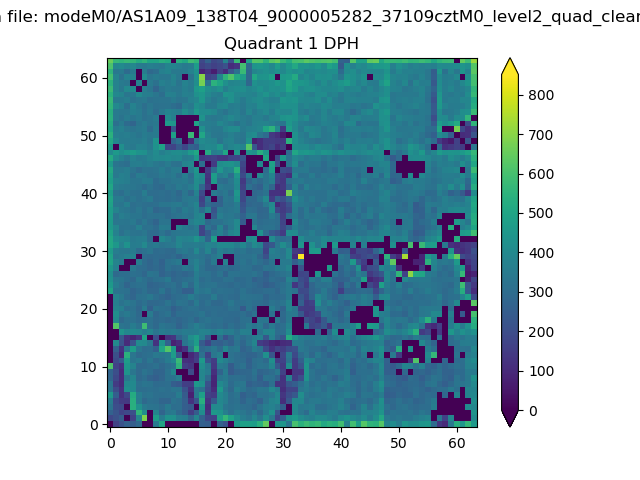 |
Quadrant B |
|---|---|---|---|
| Quadrant D | 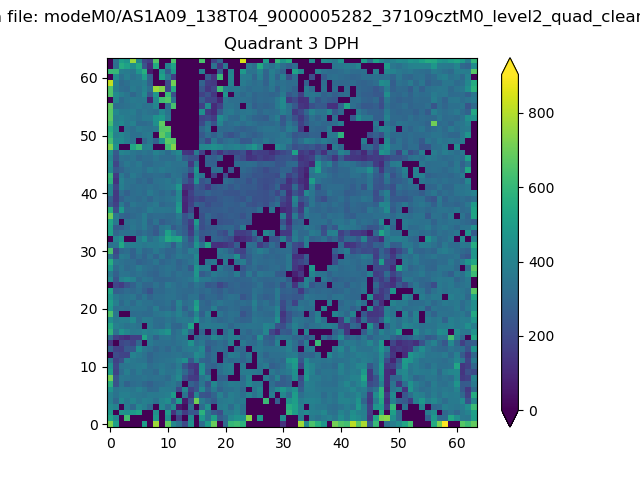 |
 |
Quadrant C |
| Plot type | Count rate plots | Images |
|---|---|---|
| Comparison with Poisson distribution Blue bars denote a histogram of data divided into 1 sec bins. Red curve is a Poisson curve with rate = median count rate of data. |
 |
 |
| Quadrant-wise count rates Data is divided into 100 sec bins |
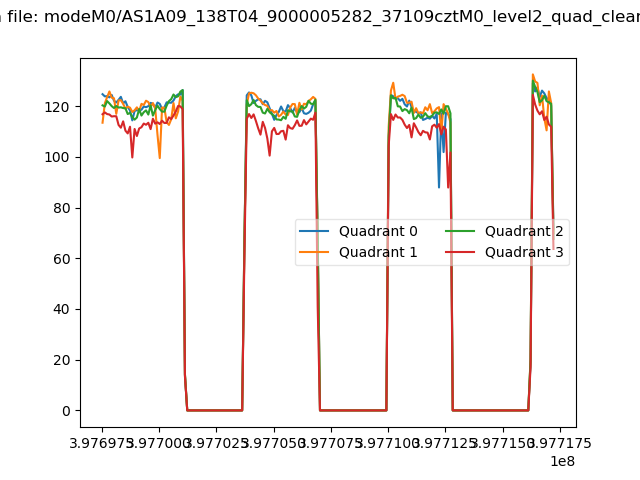 |
|
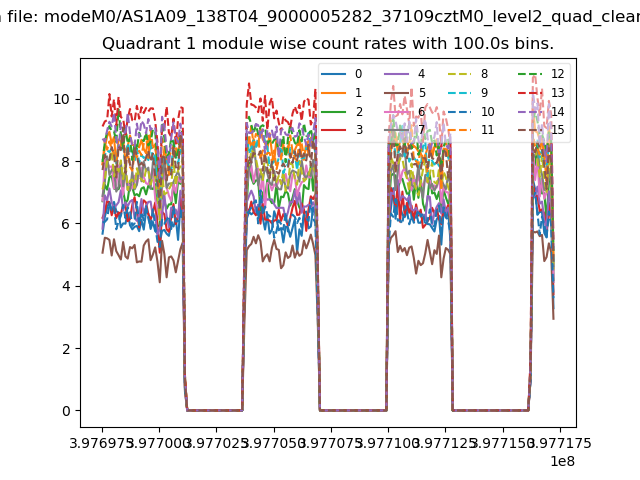
| Module-wise count rates for Quadrant A Data is divided into 100 sec bins |
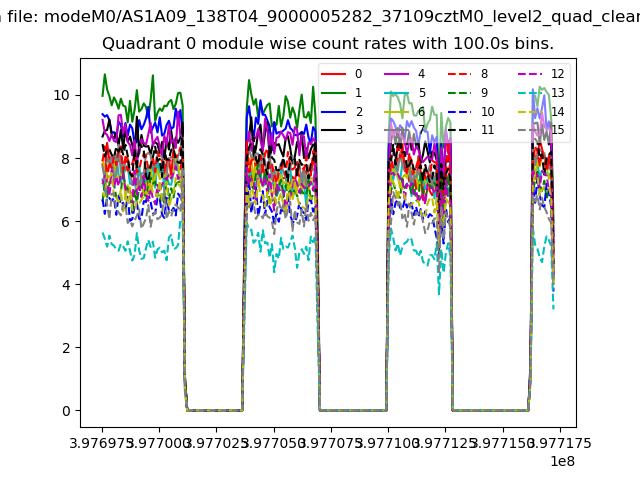 |
 |
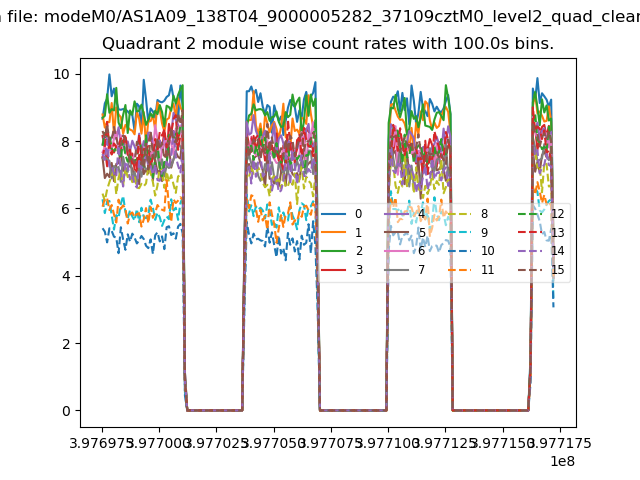
| Module-wise count rates for Quadrant B Data is divided into 100 sec bins |
 |
 |
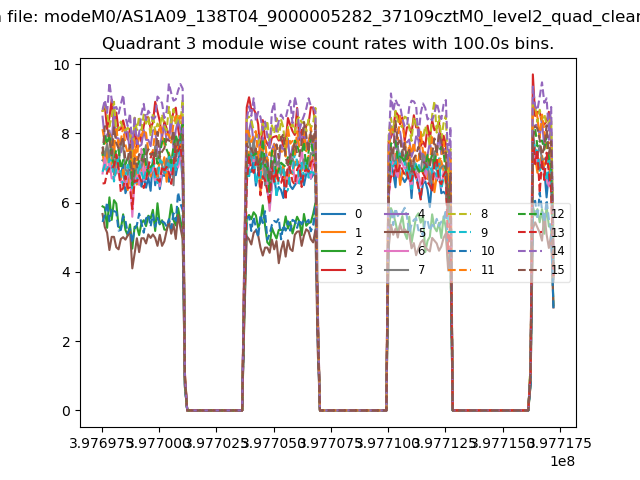
| Module-wise count rates for Quadrant C Data is divided into 100 sec bins |
 |
 |
| Module-wise count rates for Quadrant D Data is divided into 100 sec bins |
 |
 |
| Parameter | Plot |
|---|---|
| CZT HV Monitor | 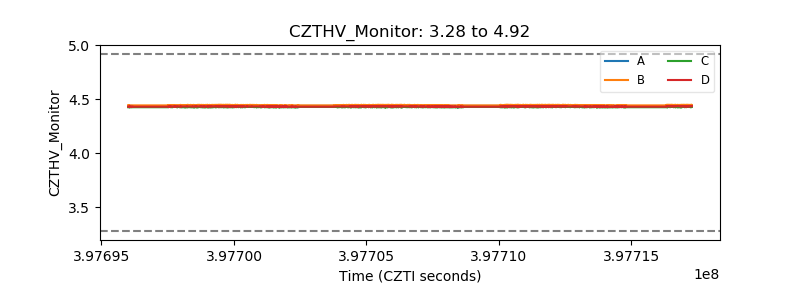 |
| D_VDD | 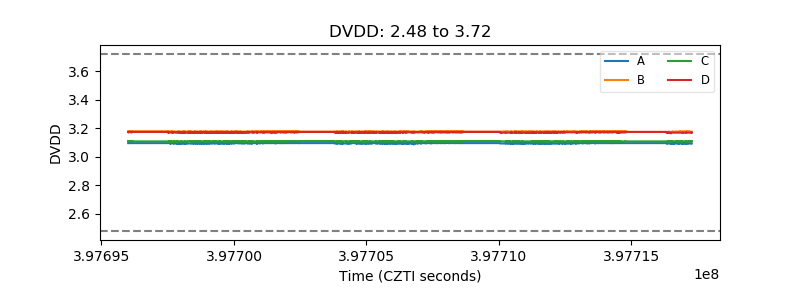 |
| Temperature 1 | 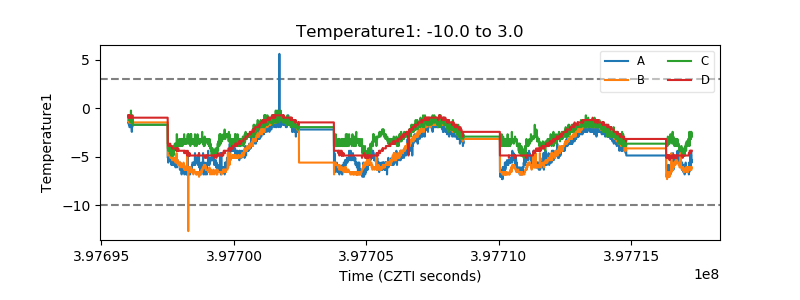 |
| Veto HV Monitor | 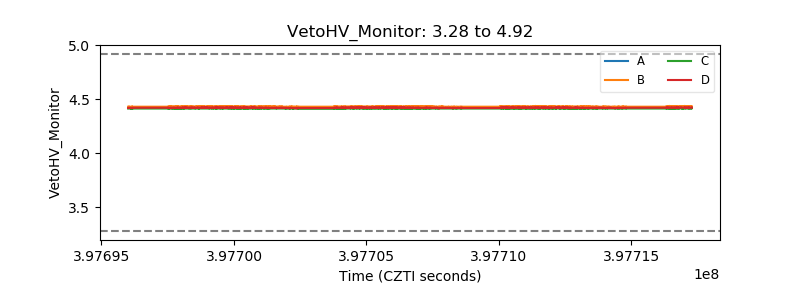 |
| Veto LLD | 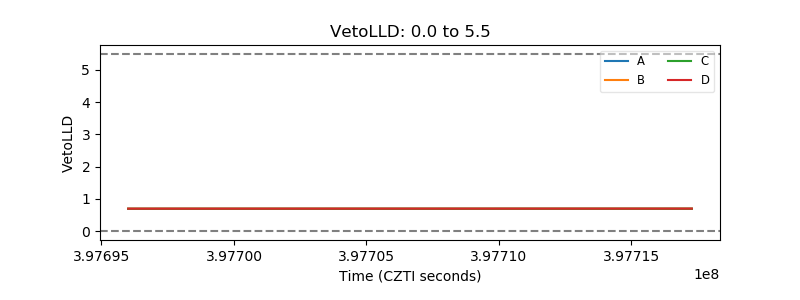 |
| Alpha Counter | 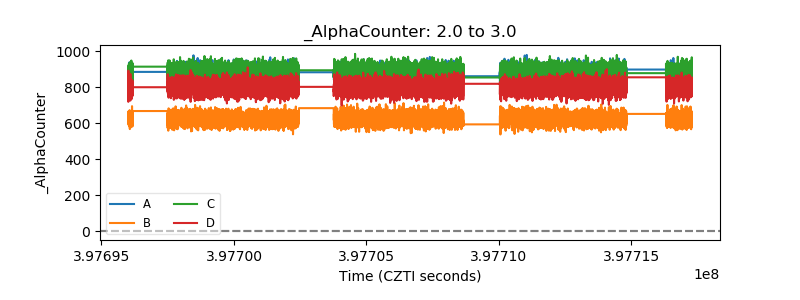 |
| _CPM_Rate | 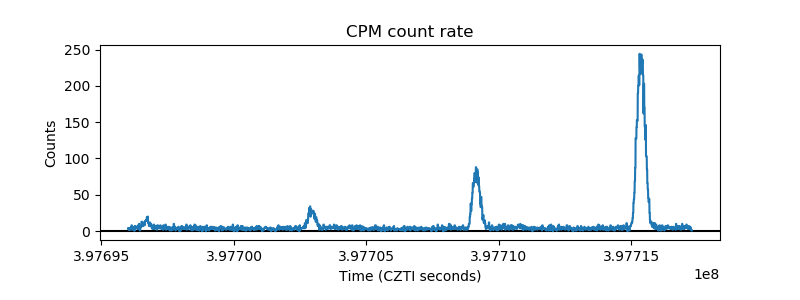 |
| CZT Counter | 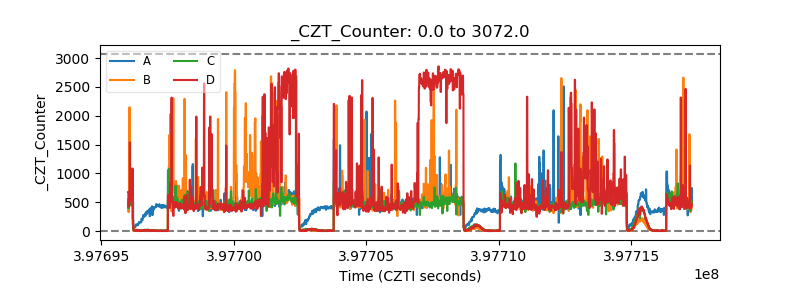 |
| +2.5 Volts monitor | 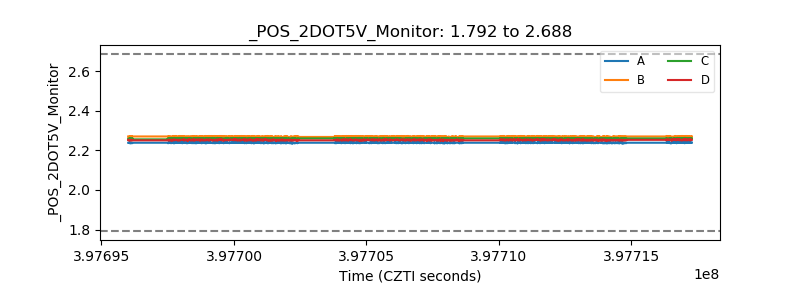 |
| +5 Volts monitor | 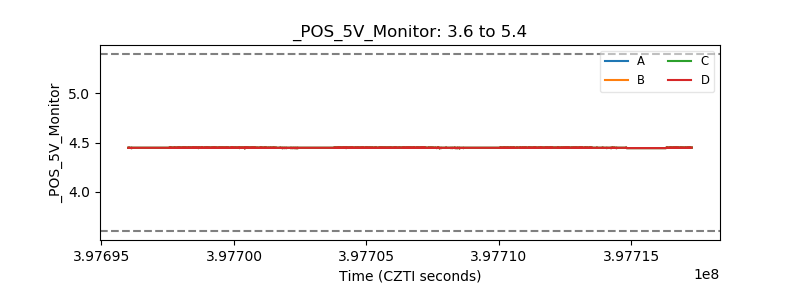 |
| _ROLL_ROT | 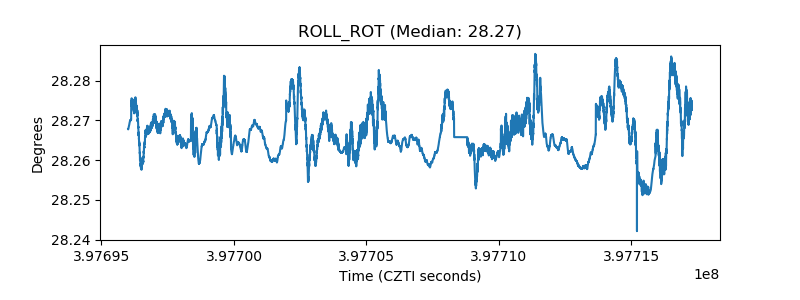 |
| _Roll_DEC | 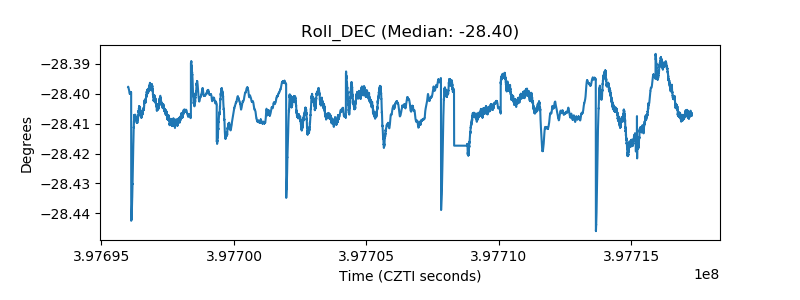 |
| _Roll_RA | 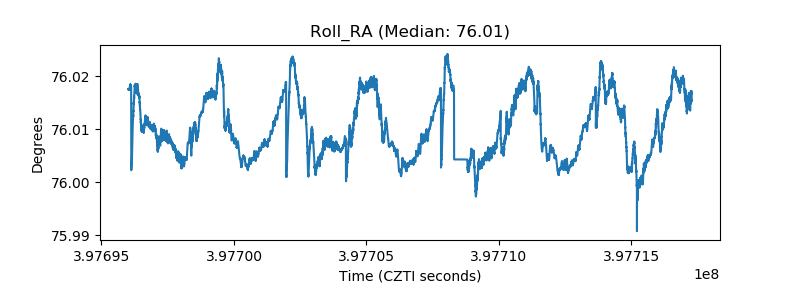 |
| Veto Counter | 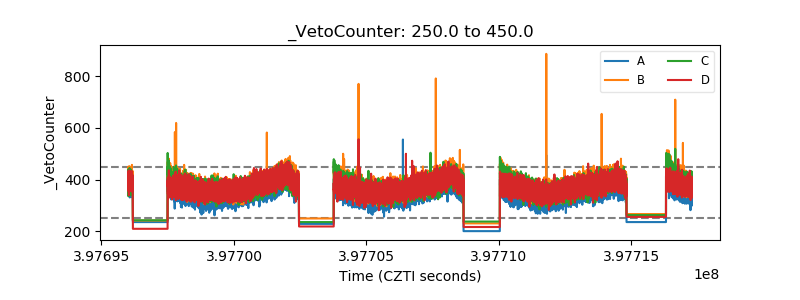 |