| Param | Original file | Final file |
|---|---|---|
| Filename | modeM0/AS1A09_138T04_9000005282_37110cztM0_level2.evt | modeM0/AS1A09_138T04_9000005282_37110cztM0_level2_quad_clean.evt |
| Size (bytes) | 430,441,920 | 65,957,760 |
| Size | 410.5 MB | 62.9 MB |
| Events in quadrant A | 2,789,269 | 409,207 |
| Events in quadrant B | 3,022,177 | 409,235 |
| Events in quadrant C | 2,794,846 | 407,285 |
| Events in quadrant D | 4,051,583 | 382,349 |
| Mode SS | |||
|---|---|---|---|
| Quadrant | BADHDUFLAG | Total packets | Discarded packets |
| A | 0 | 114 | 0 |
| B | 0 | 114 | 0 |
| C | 0 | 114 | 0 |
| D | 0 | 114 | 0 |
| Mode M0 | |||
|---|---|---|---|
| Quadrant | BADHDUFLAG | Total packets | Discarded packets |
| A | 0 | 11709 | 3 |
| B | 0 | 12586 | 2 |
| C | 0 | 11633 | 2 |
| D | 0 | 15881 | 2 |
| Mode M9 | |||
|---|---|---|---|
| Quadrant | BADHDUFLAG | Total packets | Discarded packets |
| A | 0 | 29 | 0 |
| B | 0 | 29 | 0 |
| C | 0 | 29 | 0 |
| D | 0 | 30 | 0 |
| Quadrant | Total seconds | Saturated seconds | Saturation percentage |
|---|---|---|---|
| A | 5557 | 17 | 0.305920% |
| B | 5557 | 140 | 2.519345% |
| C | 5557 | 15 | 0.269930% |
| D | 5557 | 348 | 6.262372% |
Noise dominated data is calculated using 1-second bins in cleaned event files. If a bin has >2000 counts, and if more than 50% of those come from <1% of pixels, then it is considered to be noise-dominated and hence unusable.
| Quadrant | # 1 sec bins | Bins with >0 counts | Bins with >2000 counts | High rate bins dominated by noise | Noise dominated (total time) | Noise dominated (detector-on time) | Marked lightcurve |
|---|---|---|---|---|---|---|---|
| A | 7169 | 5557 | 2 | 2 | 0.03% | 0.04% | 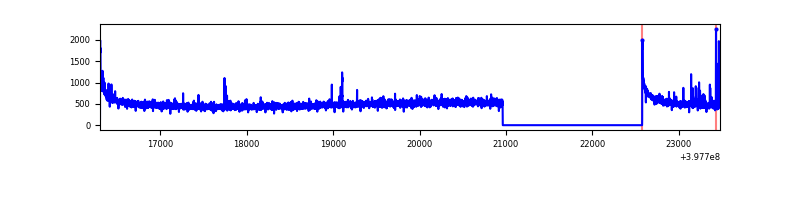 |
| B | 7170 | 5557 | 110 | 110 | 1.53% | 1.98% | 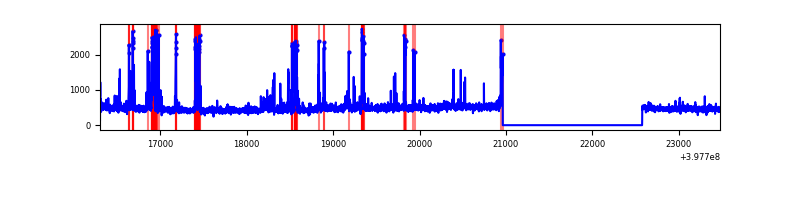 |
| C | 7170 | 5558 | 7 | 7 | 0.10% | 0.13% | 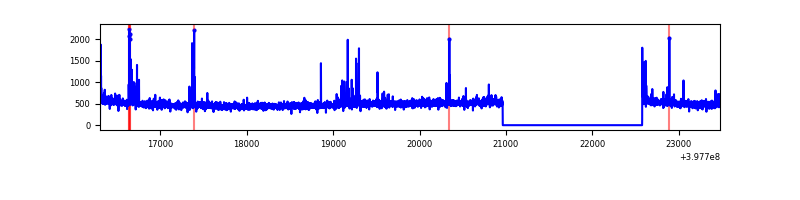 |
| D | 7170 | 5558 | 328 | 328 | 4.57% | 5.90% | 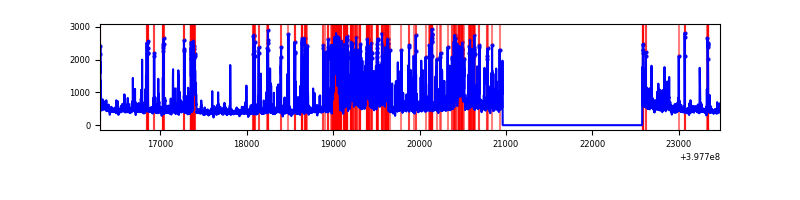 |
Top three noisy pixels from each quadrant. If the there are fewer than three noisy pixels in the level2.evt file, extra rows are filled as -1
| Pixel properties | Quadrant properties | ||||||
|---|---|---|---|---|---|---|---|
| Quadrant | DetID | PixID | Counts | Sigma | Mean | Median | Sigma |
| A | 10 | 83 | 271744 | 2098.02 | 638 | 625 | 129.2 |
| A | 9 | 143 | 26123 | 197.31 | 638 | 625 | 129.2 |
| A | 7 | 3 | 9993 | 72.49 | 638 | 625 | 129.2 |
| B | 5 | 172 | 339856 | 2795.6 | 627 | 609 | 121.4 |
| B | 5 | 184 | 98755 | 808.78 | 627 | 609 | 121.4 |
| B | 15 | 85 | 39826 | 323.17 | 627 | 609 | 121.4 |
| C | 15 | 214 | 238814 | 1630.68 | 622 | 626 | 146.1 |
| C | 14 | 254 | 43187 | 291.38 | 622 | 626 | 146.1 |
| C | 0 | 207 | 39434 | 265.69 | 622 | 626 | 146.1 |
| D | 1 | 52 | 649297 | 4343.54 | 609 | 592 | 149.3 |
| D | 13 | 249 | 515377 | 3446.85 | 609 | 592 | 149.3 |
| D | 1 | 47 | 161528 | 1077.58 | 609 | 592 | 149.3 |
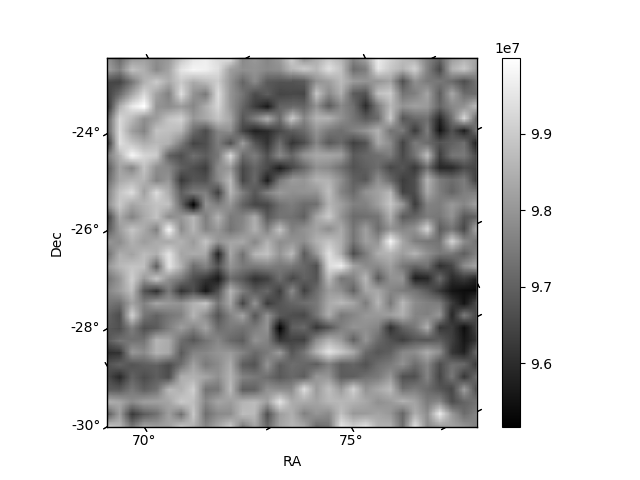
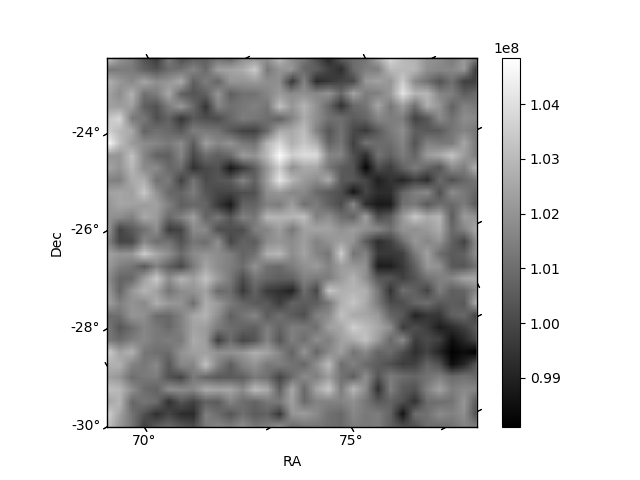
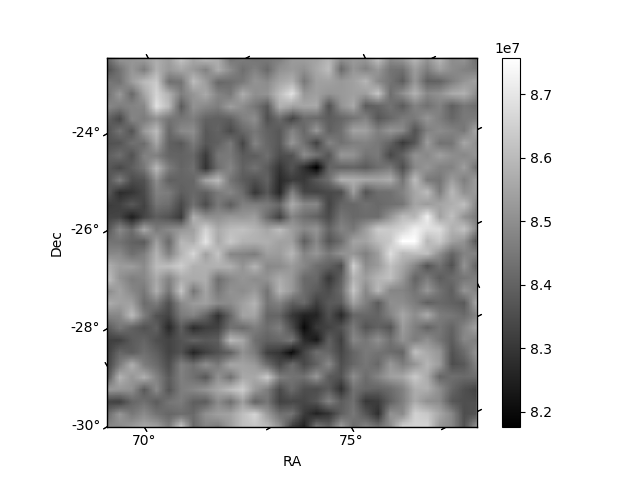
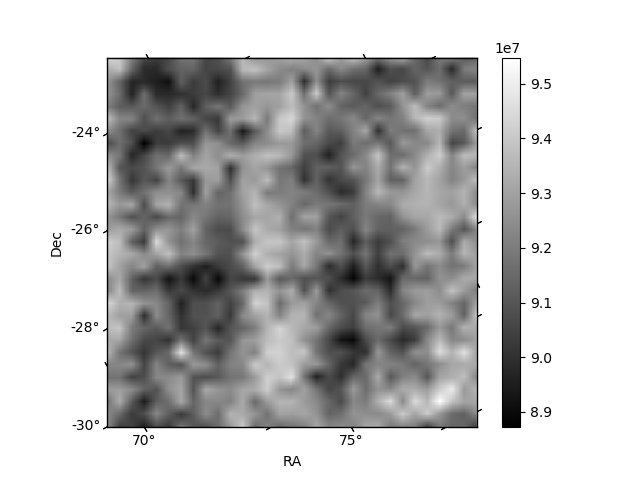
Histogram calculated using DETX and DETY for each event in the final _common_clean file
| Quadrant A | 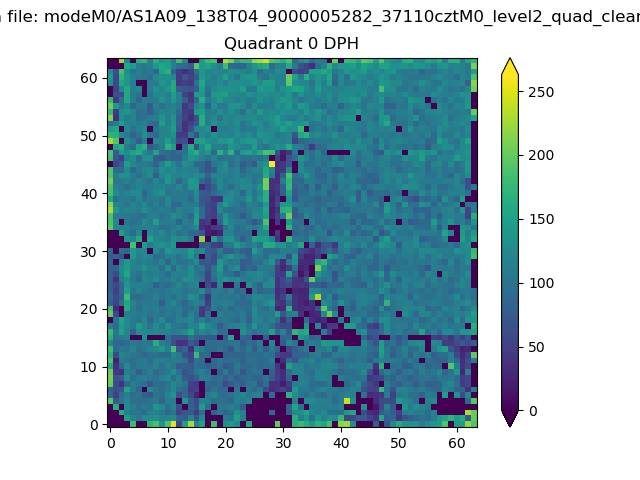 |
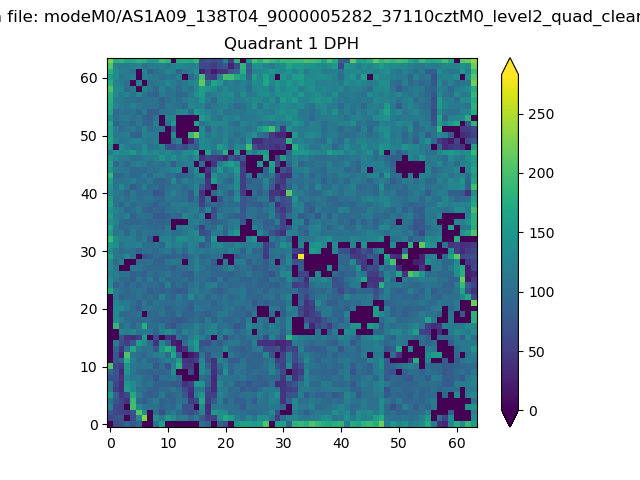 |
Quadrant B |
|---|---|---|---|
| Quadrant D |  |
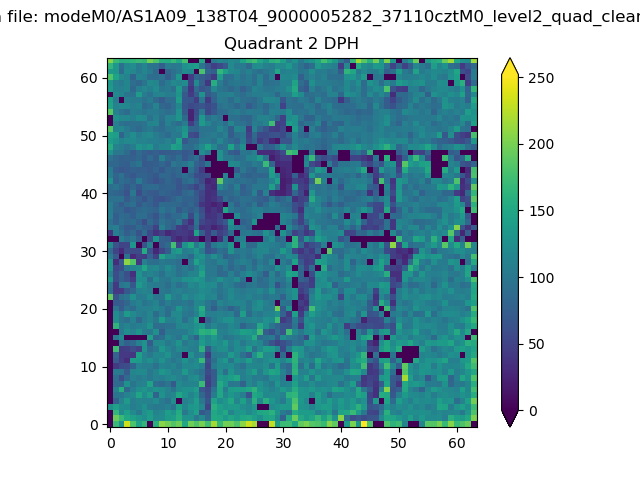 |
Quadrant C |
| Plot type | Count rate plots | Images |
|---|---|---|
| Comparison with Poisson distribution Blue bars denote a histogram of data divided into 1 sec bins. Red curve is a Poisson curve with rate = median count rate of data. |
 |
 |
| Quadrant-wise count rates Data is divided into 100 sec bins |
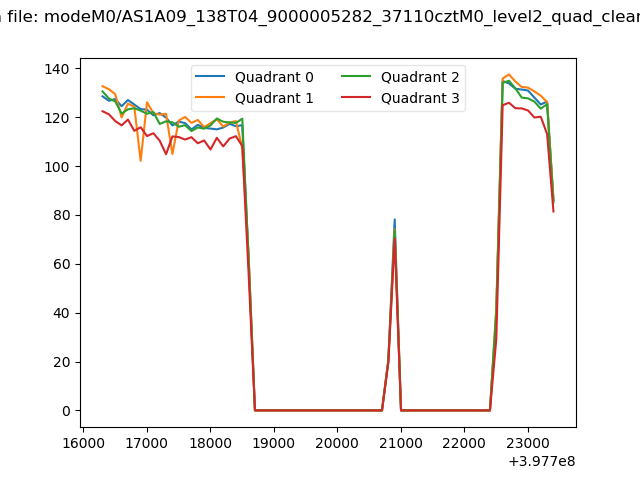 |
|
| Module-wise count rates for Quadrant A Data is divided into 100 sec bins |
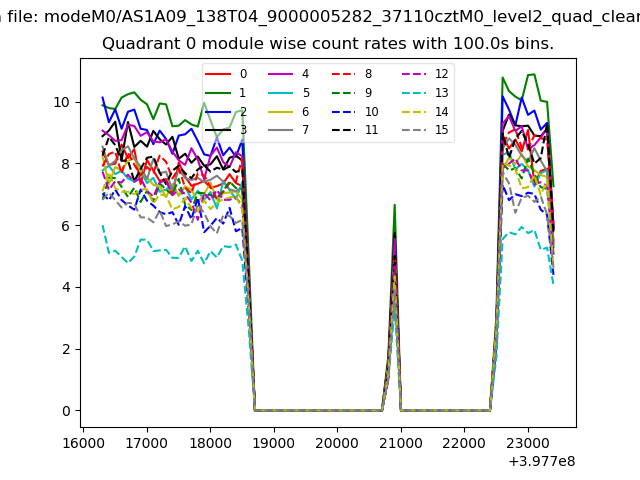 |
 |
| Module-wise count rates for Quadrant B Data is divided into 100 sec bins |
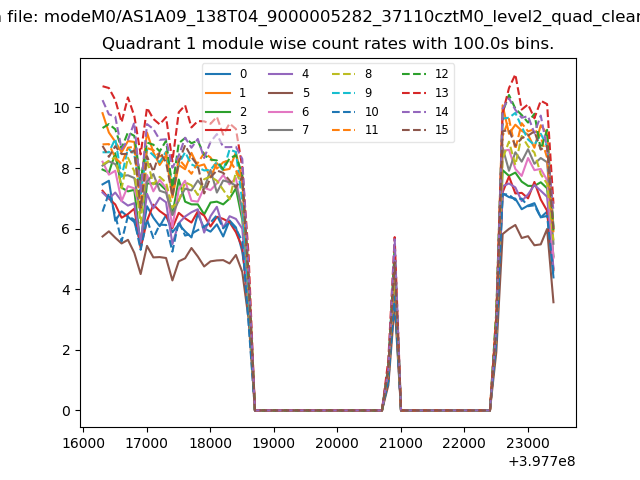 |
 |
| Module-wise count rates for Quadrant C Data is divided into 100 sec bins |
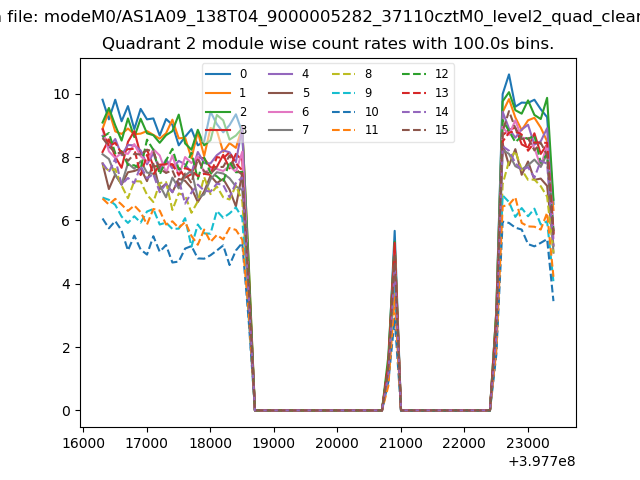 |
 |
| Module-wise count rates for Quadrant D Data is divided into 100 sec bins |
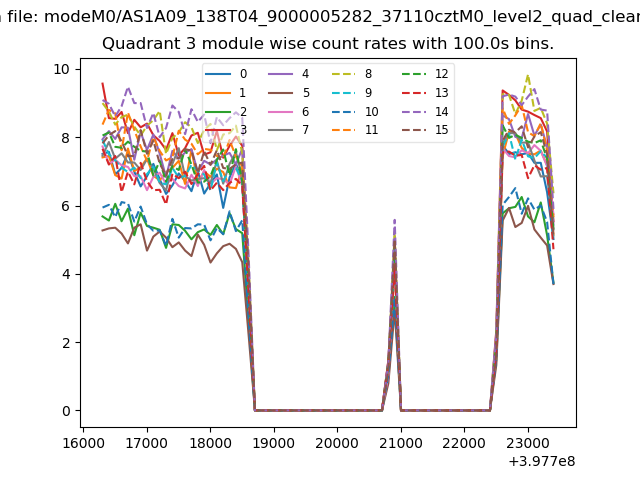 |
 |
| Parameter | Plot |
|---|---|
| CZT HV Monitor | 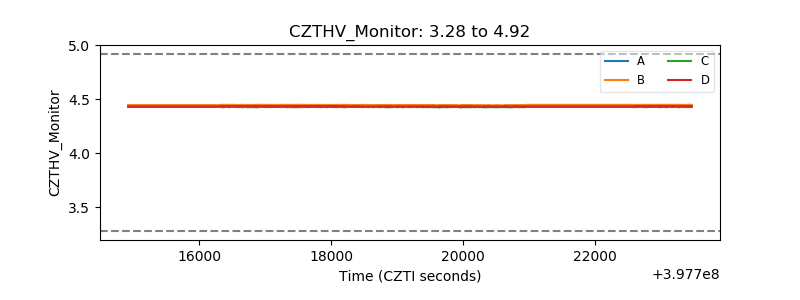 |
| D_VDD | 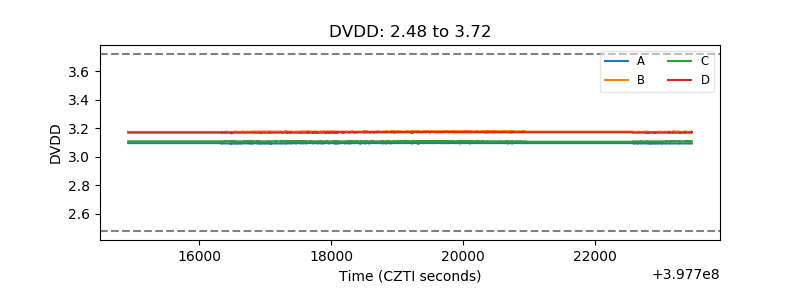 |
| Temperature 1 | 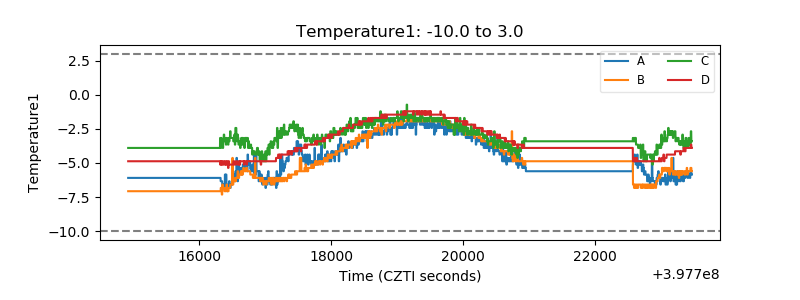 |
| Veto HV Monitor | 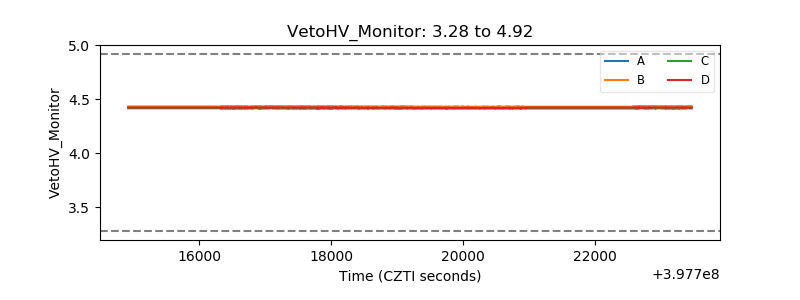 |
| Veto LLD | 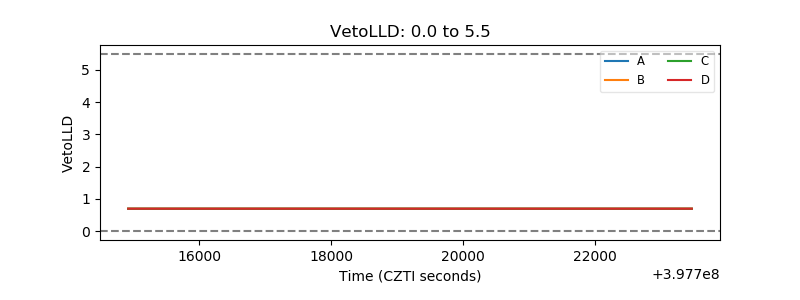 |
| Alpha Counter | 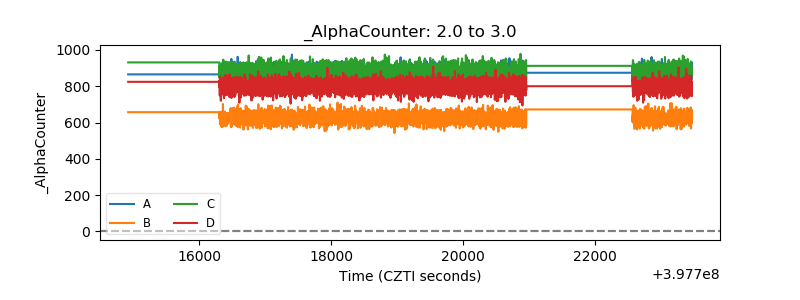 |
| _CPM_Rate | 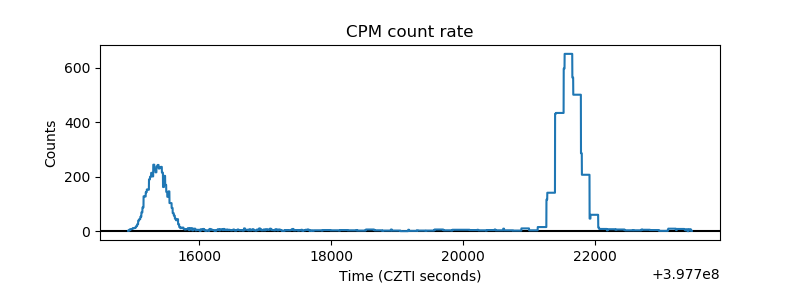 |
| CZT Counter | 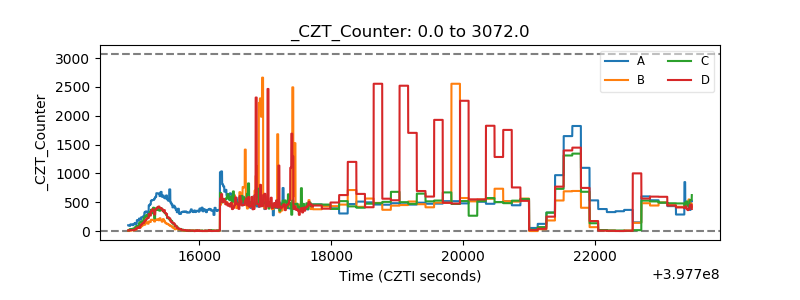 |
| +2.5 Volts monitor | 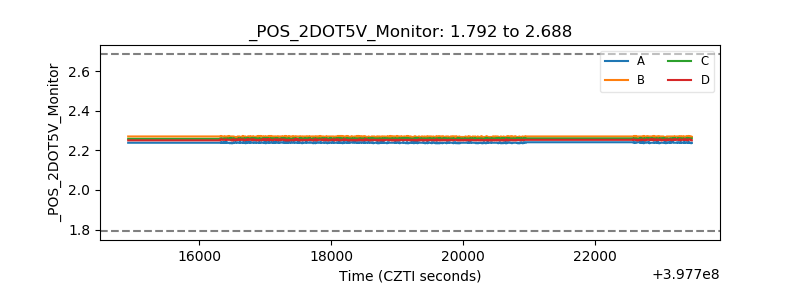 |
| +5 Volts monitor | 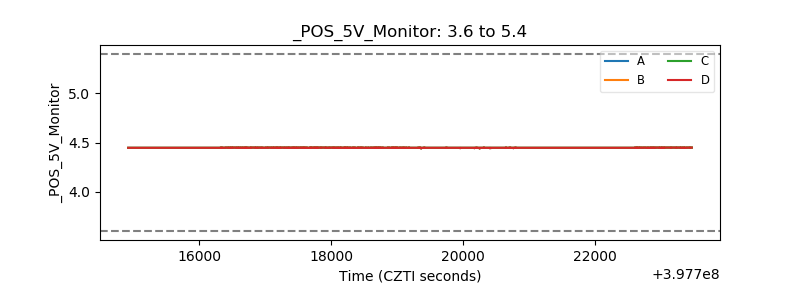 |
| _ROLL_ROT | 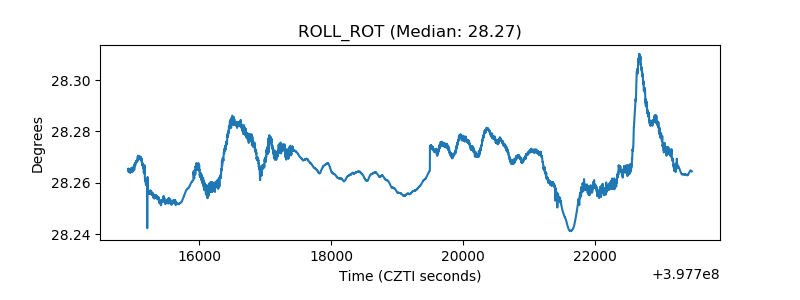 |
| _Roll_DEC | 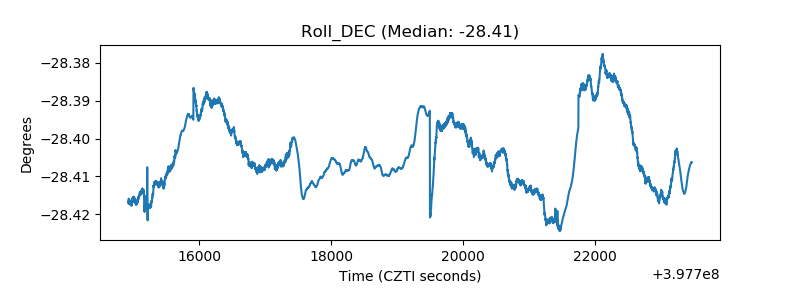 |
| _Roll_RA | 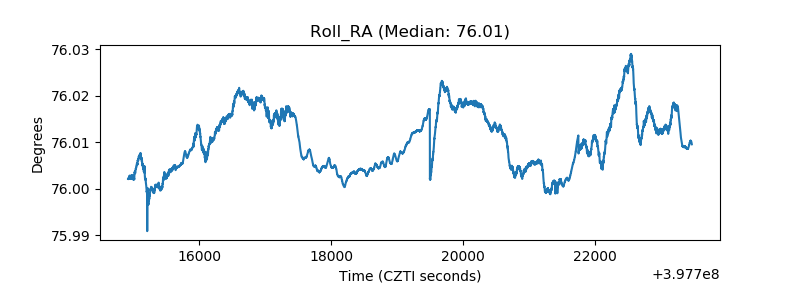 |
| Veto Counter | 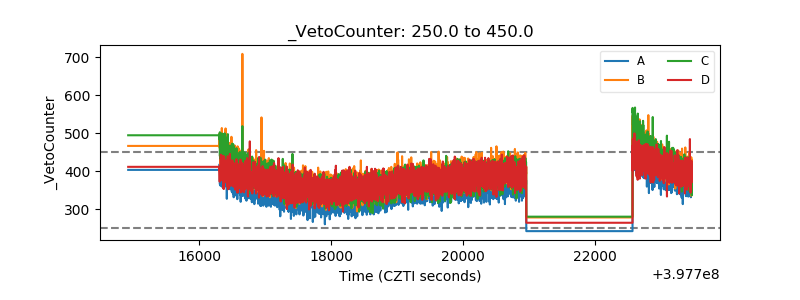 |