| Param | Original file | Final file |
|---|---|---|
| Filename | modeM0/AS1A09_138T04_9000005282_37112cztM0_level2.evt | modeM0/AS1A09_138T04_9000005282_37112cztM0_level2_quad_clean.evt |
| Size (bytes) | 454,757,760 | 71,919,360 |
| Size | 433.7 MB | 68.6 MB |
| Events in quadrant A | 3,050,836 | 452,566 |
| Events in quadrant B | 3,523,615 | 456,314 |
| Events in quadrant C | 2,869,471 | 448,334 |
| Events in quadrant D | 3,940,290 | 420,975 |
| Mode SS | |||
|---|---|---|---|
| Quadrant | BADHDUFLAG | Total packets | Discarded packets |
| A | 0 | 116 | 0 |
| B | 0 | 116 | 0 |
| C | 0 | 116 | 0 |
| D | 0 | 116 | 0 |
| Mode M0 | |||
|---|---|---|---|
| Quadrant | BADHDUFLAG | Total packets | Discarded packets |
| A | 0 | 12541 | 3 |
| B | 0 | 14123 | 2 |
| C | 0 | 11920 | 2 |
| D | 0 | 15563 | 2 |
| Mode M9 | |||
|---|---|---|---|
| Quadrant | BADHDUFLAG | Total packets | Discarded packets |
| A | 0 | 27 | 0 |
| B | 0 | 27 | 0 |
| C | 0 | 27 | 0 |
| D | 0 | 28 | 0 |
| Quadrant | Total seconds | Saturated seconds | Saturation percentage |
|---|---|---|---|
| A | 5714 | 31 | 0.542527% |
| B | 5714 | 309 | 5.407770% |
| C | 5714 | 14 | 0.245012% |
| D | 5714 | 231 | 4.042702% |
Noise dominated data is calculated using 1-second bins in cleaned event files. If a bin has >2000 counts, and if more than 50% of those come from <1% of pixels, then it is considered to be noise-dominated and hence unusable.
| Quadrant | # 1 sec bins | Bins with >0 counts | Bins with >2000 counts | High rate bins dominated by noise | Noise dominated (total time) | Noise dominated (detector-on time) | Marked lightcurve |
|---|---|---|---|---|---|---|---|
| A | 7476 | 5714 | 18 | 18 | 0.24% | 0.32% | 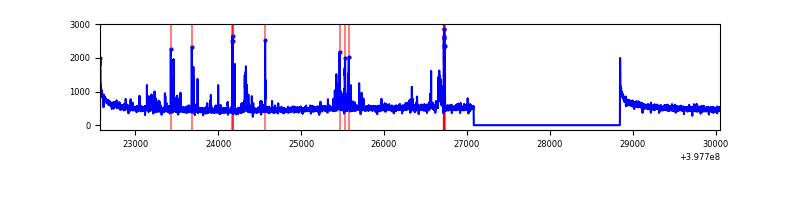 |
| B | 7476 | 5714 | 245 | 245 | 3.28% | 4.29% | 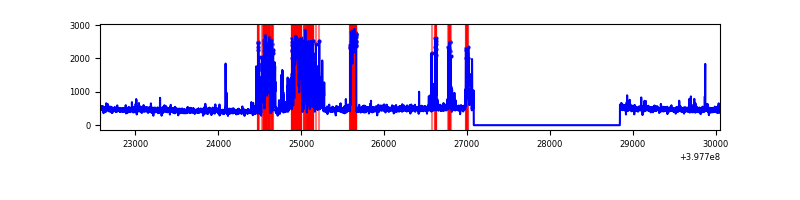 |
| C | 7476 | 5714 | 9 | 9 | 0.12% | 0.16% | 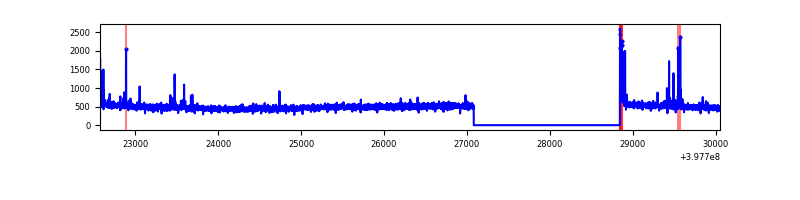 |
| D | 7476 | 5714 | 186 | 186 | 2.49% | 3.26% | 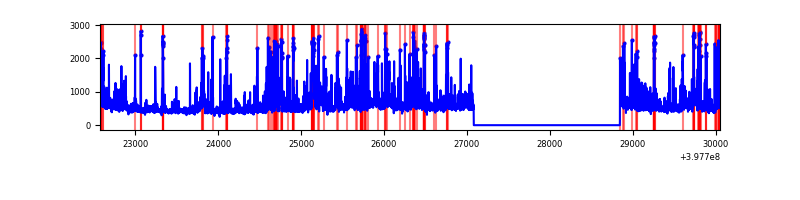 |
Top three noisy pixels from each quadrant. If the there are fewer than three noisy pixels in the level2.evt file, extra rows are filled as -1
| Pixel properties | Quadrant properties | ||||||
|---|---|---|---|---|---|---|---|
| Quadrant | DetID | PixID | Counts | Sigma | Mean | Median | Sigma |
| A | 10 | 83 | 269038 | 1990.63 | 667 | 655 | 134.8 |
| A | 15 | 237 | 108738 | 801.67 | 667 | 655 | 134.8 |
| A | 9 | 143 | 78266 | 575.65 | 667 | 655 | 134.8 |
| B | 5 | 172 | 581210 | 4742.62 | 640 | 623 | 122.4 |
| B | 5 | 184 | 338251 | 2757.97 | 640 | 623 | 122.4 |
| B | 5 | 200 | 31803 | 254.7 | 640 | 623 | 122.4 |
| C | 15 | 214 | 245623 | 1642.6 | 643 | 647 | 149.1 |
| C | 0 | 10 | 56673 | 375.66 | 643 | 647 | 149.1 |
| C | 0 | 207 | 27366 | 179.15 | 643 | 647 | 149.1 |
| D | 1 | 52 | 619493 | 3937.09 | 643 | 627 | 157.2 |
| D | 13 | 249 | 240174 | 1523.95 | 643 | 627 | 157.2 |
| D | 1 | 47 | 164661 | 1043.55 | 643 | 627 | 157.2 |
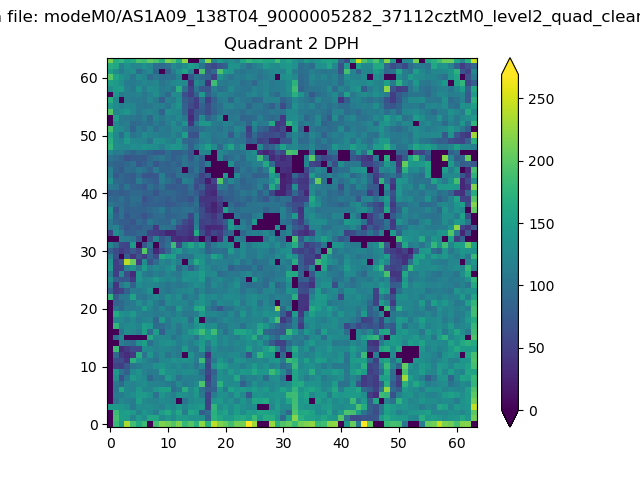
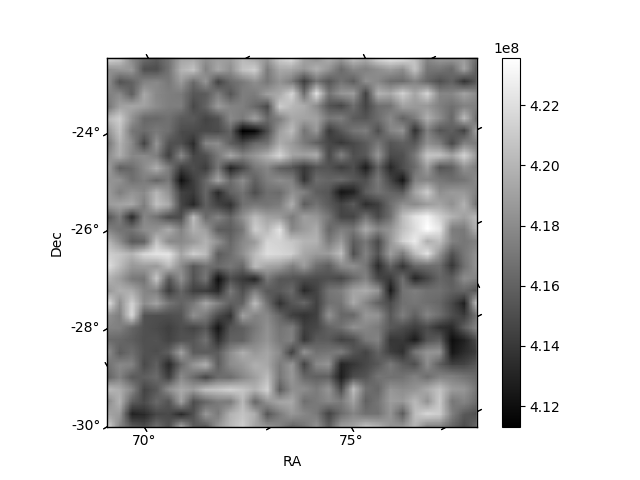
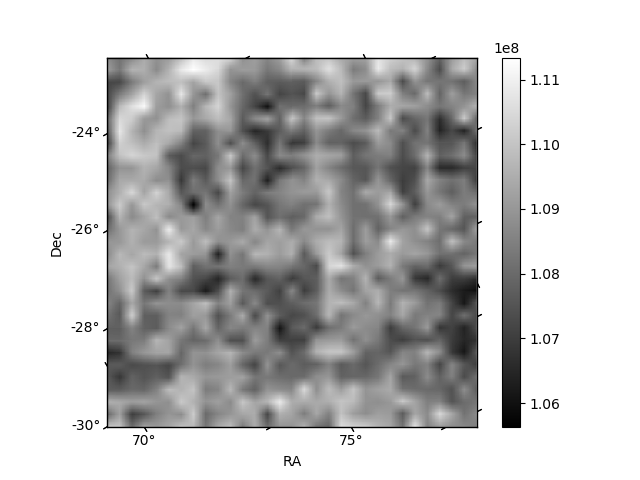
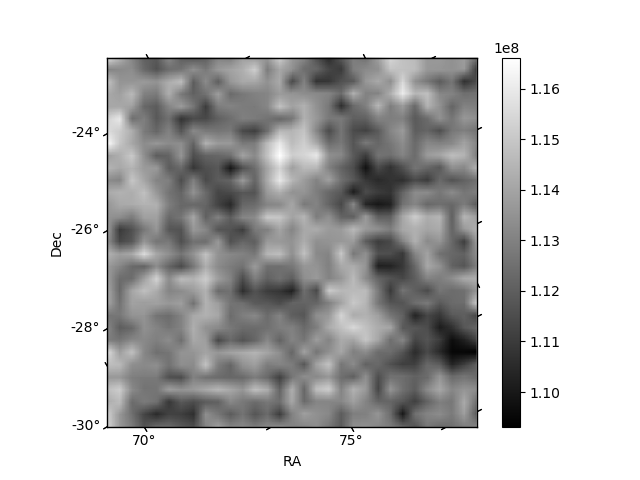
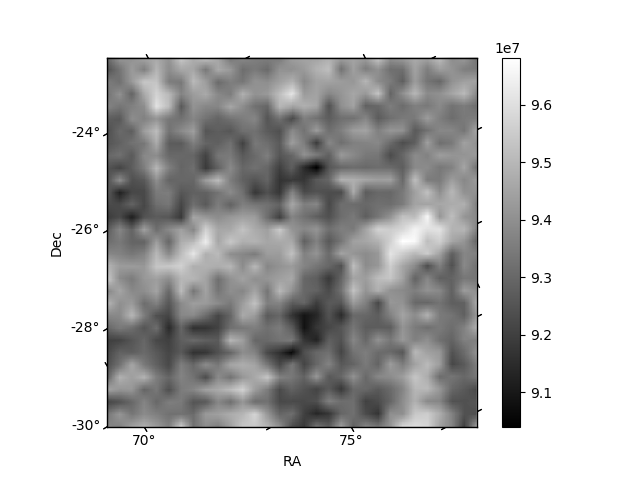
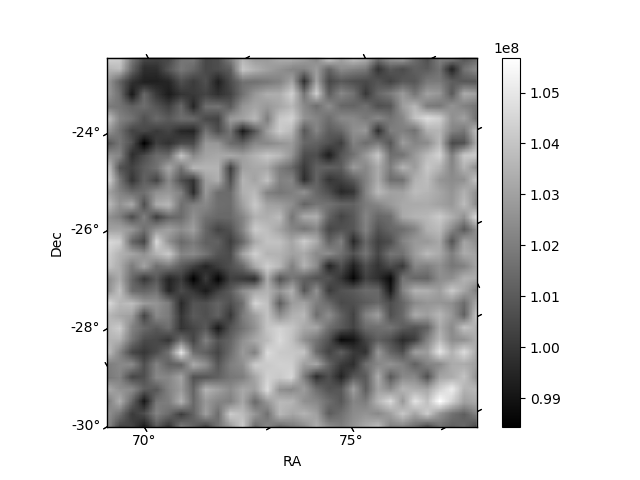
Histogram calculated using DETX and DETY for each event in the final _common_clean file
| Quadrant A | 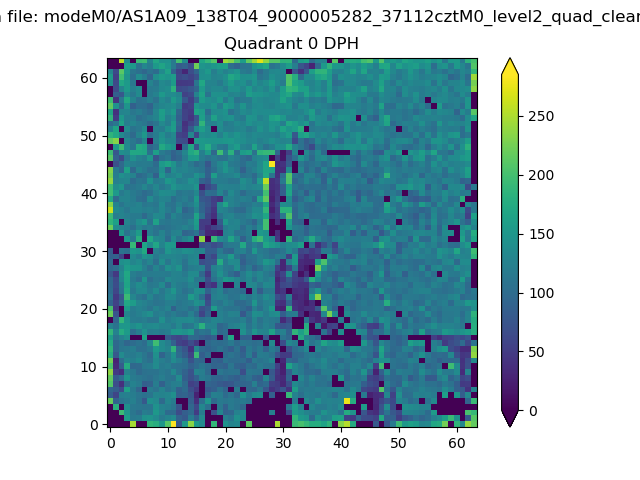 |
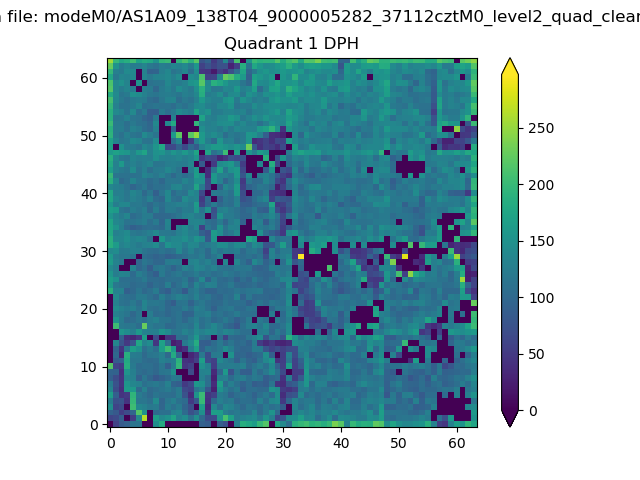 |
Quadrant B |
|---|---|---|---|
| Quadrant D | 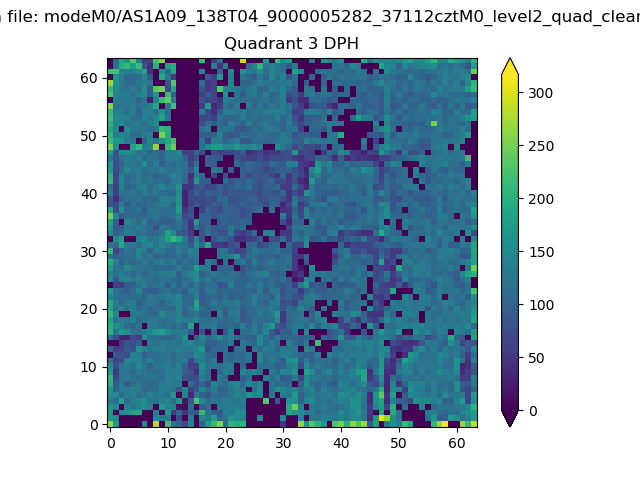 |
 |
Quadrant C |
| Plot type | Count rate plots | Images |
|---|---|---|
| Comparison with Poisson distribution Blue bars denote a histogram of data divided into 1 sec bins. Red curve is a Poisson curve with rate = median count rate of data. |
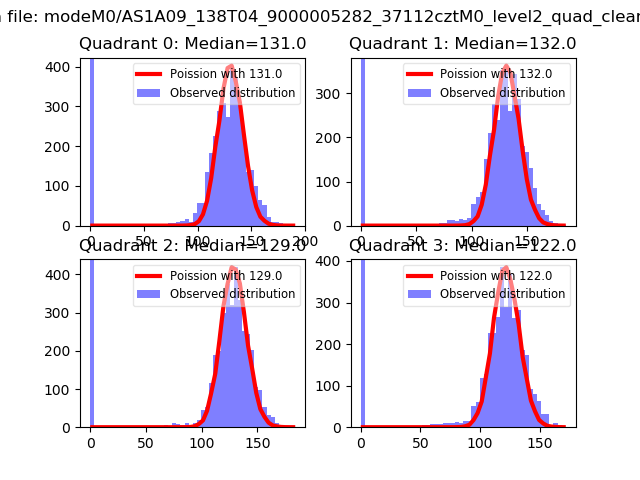 |
 |
| Quadrant-wise count rates Data is divided into 100 sec bins |
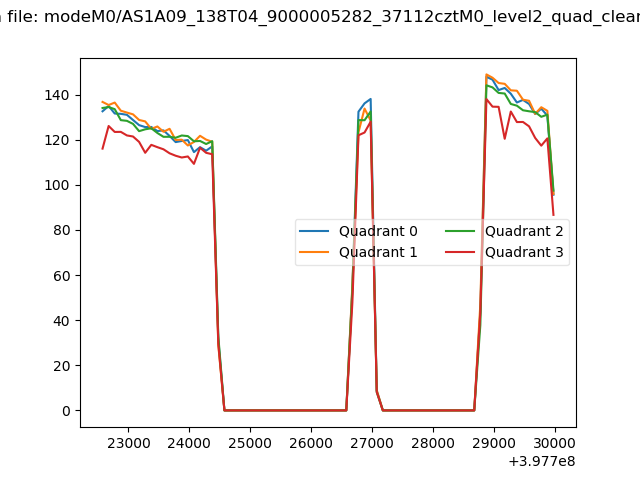 |
|
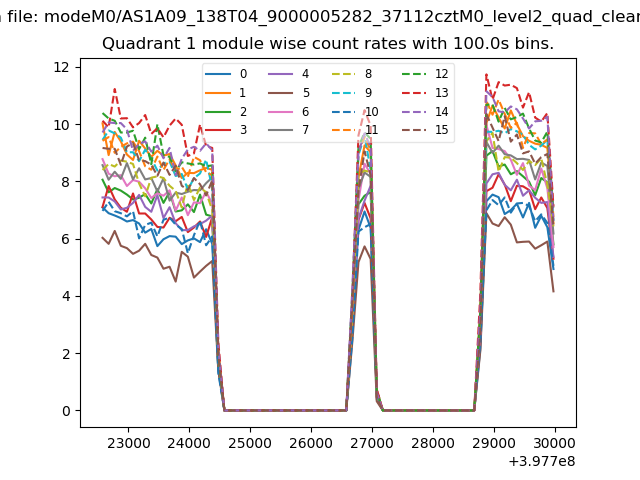
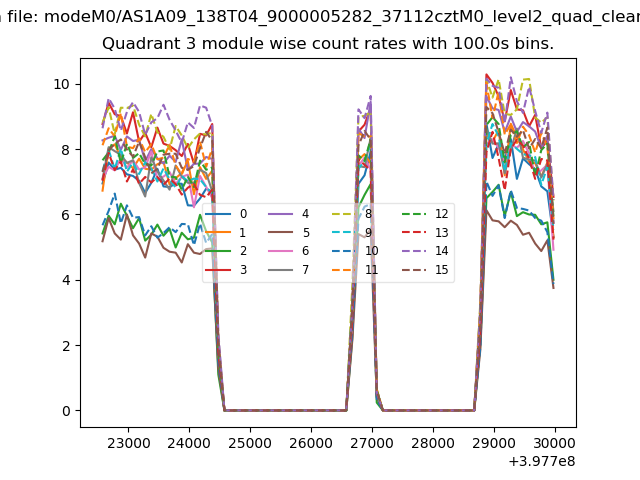
| Module-wise count rates for Quadrant A Data is divided into 100 sec bins |
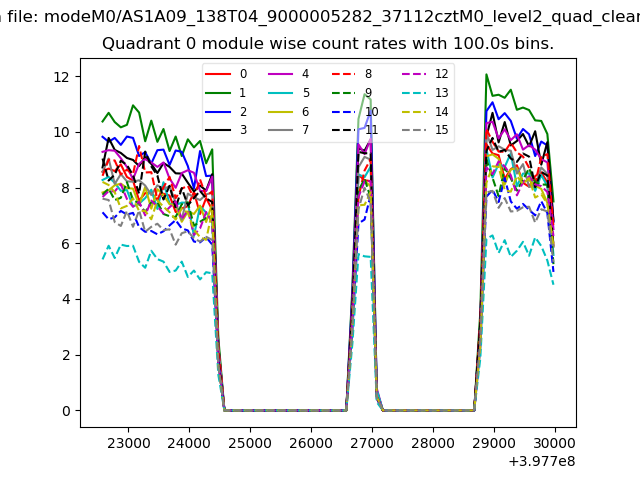 |
 |
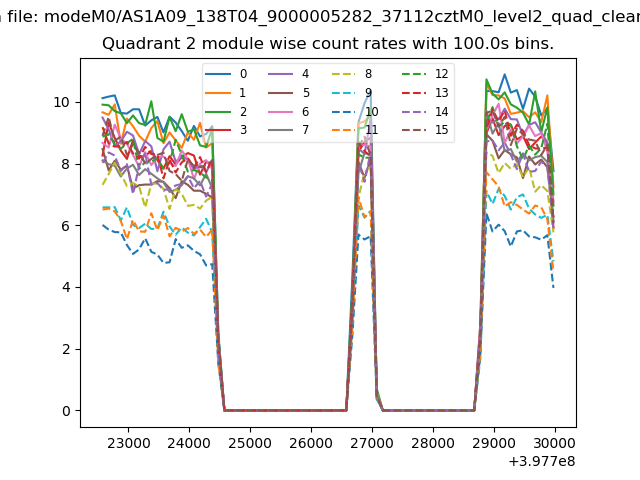
| Module-wise count rates for Quadrant B Data is divided into 100 sec bins |
 |
 |
| Module-wise count rates for Quadrant C Data is divided into 100 sec bins |
 |
 |
| Module-wise count rates for Quadrant D Data is divided into 100 sec bins |
 |
 |
| Parameter | Plot |
|---|---|
| CZT HV Monitor |  |
| D_VDD |  |
| Temperature 1 | 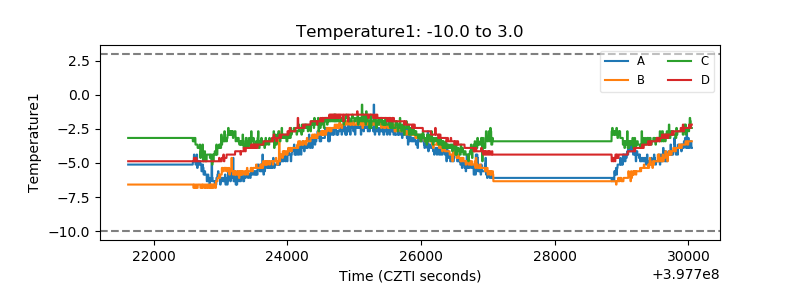 |
| Veto HV Monitor | 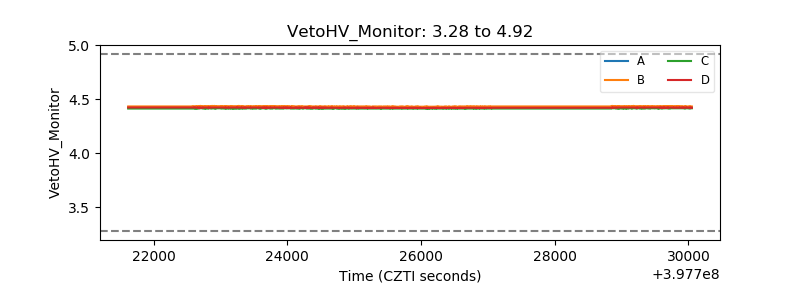 |
| Veto LLD | 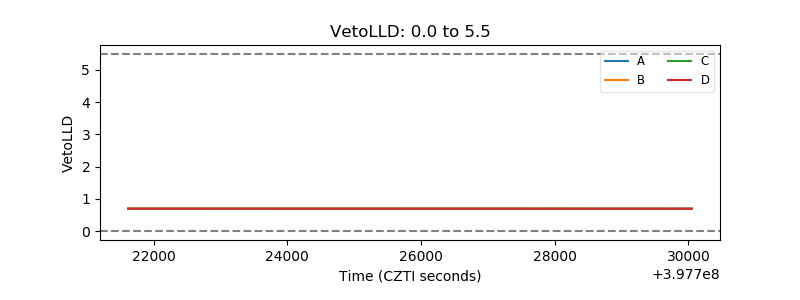 |
| Alpha Counter | 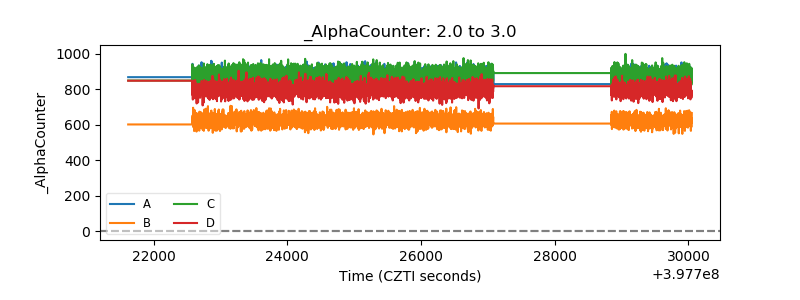 |
| _CPM_Rate | 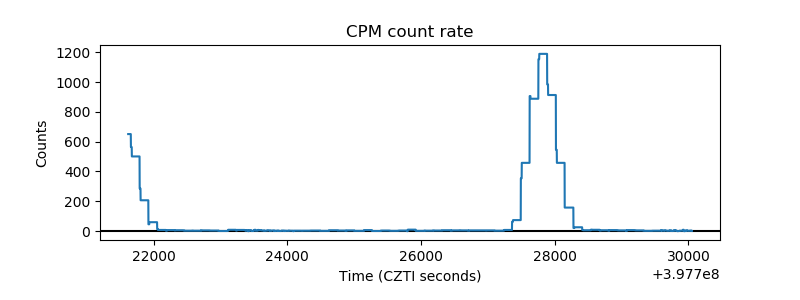 |
| CZT Counter | 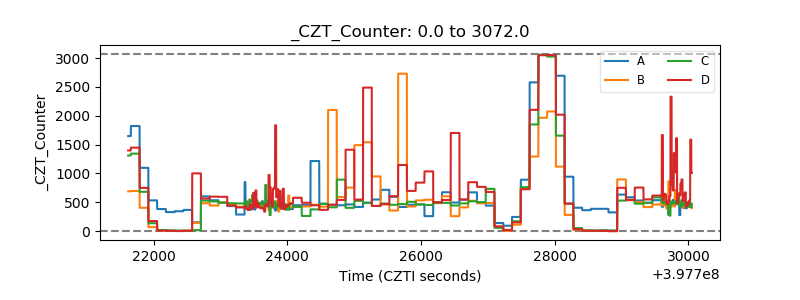 |
| +2.5 Volts monitor | 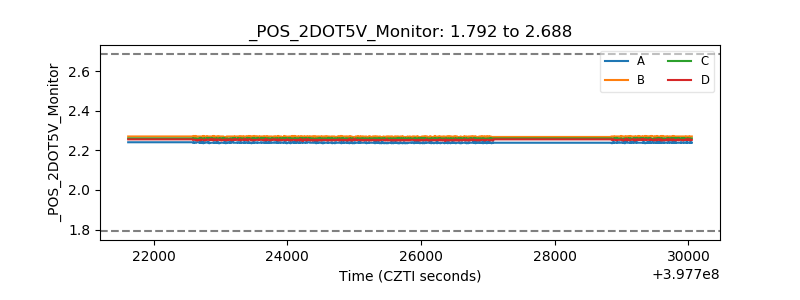 |
| +5 Volts monitor | 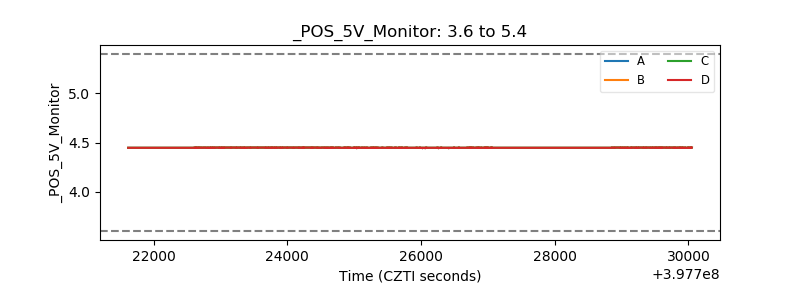 |
| _ROLL_ROT | 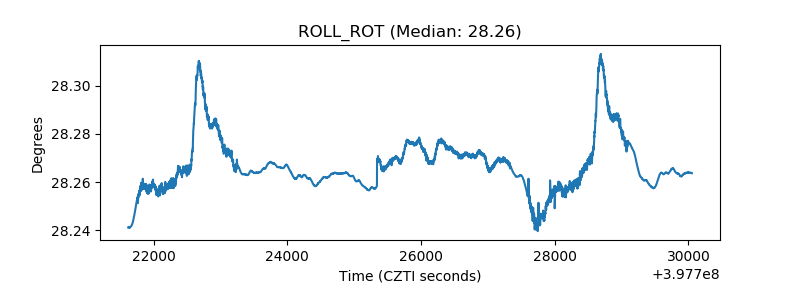 |
| _Roll_DEC | 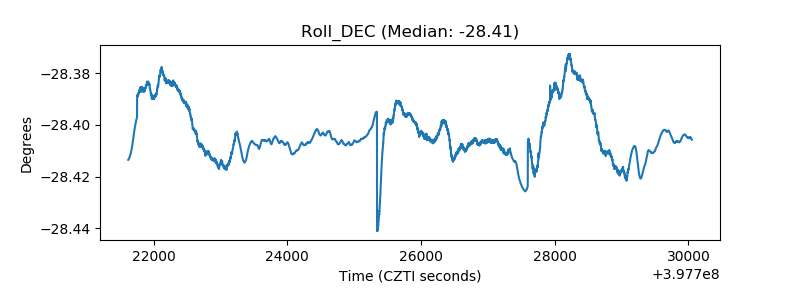 |
| _Roll_RA | 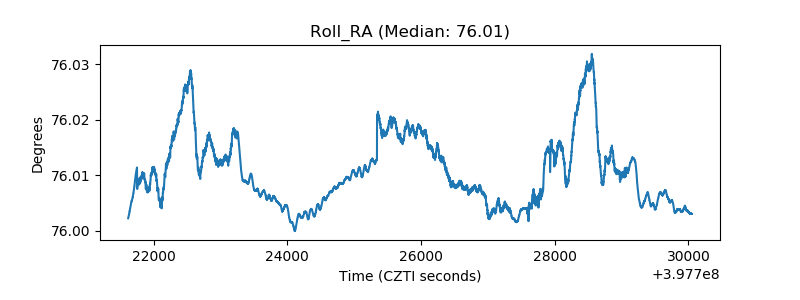 |
| Veto Counter | 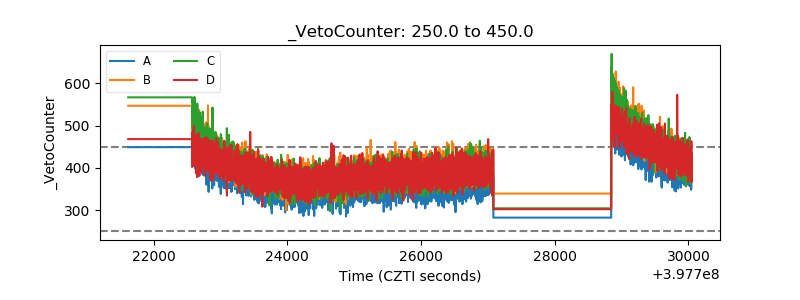 |