| Param | Original file | Final file |
|---|---|---|
| Filename | modeM0/AS1A09_138T04_9000005282_37113cztM0_level2.evt | modeM0/AS1A09_138T04_9000005282_37113cztM0_level2_quad_clean.evt |
| Size (bytes) | 424,883,520 | 63,115,200 |
| Size | 405.2 MB | 60.2 MB |
| Events in quadrant A | 2,763,840 | 397,971 |
| Events in quadrant B | 2,617,583 | 402,134 |
| Events in quadrant C | 3,012,094 | 392,371 |
| Events in quadrant D | 4,127,453 | 360,780 |
| Mode SS | |||
|---|---|---|---|
| Quadrant | BADHDUFLAG | Total packets | Discarded packets |
| A | 0 | 106 | 0 |
| B | 0 | 106 | 0 |
| C | 0 | 106 | 0 |
| D | 0 | 106 | 0 |
| Mode M0 | |||
|---|---|---|---|
| Quadrant | BADHDUFLAG | Total packets | Discarded packets |
| A | 0 | 11109 | 2 |
| B | 0 | 10879 | 1 |
| C | 0 | 11875 | 1 |
| D | 0 | 15634 | 1 |
| Mode M9 | |||
|---|---|---|---|
| Quadrant | BADHDUFLAG | Total packets | Discarded packets |
| A | 0 | 18 | 0 |
| B | 0 | 18 | 0 |
| C | 0 | 18 | 0 |
| D | 0 | 18 | 0 |
| Quadrant | Total seconds | Saturated seconds | Saturation percentage |
|---|---|---|---|
| A | 5096 | 92 | 1.805338% |
| B | 5096 | 60 | 1.177394% |
| C | 5096 | 70 | 1.373626% |
| D | 5096 | 349 | 6.848509% |
Noise dominated data is calculated using 1-second bins in cleaned event files. If a bin has >2000 counts, and if more than 50% of those come from <1% of pixels, then it is considered to be noise-dominated and hence unusable.
| Quadrant | # 1 sec bins | Bins with >0 counts | Bins with >2000 counts | High rate bins dominated by noise | Noise dominated (total time) | Noise dominated (detector-on time) | Marked lightcurve |
|---|---|---|---|---|---|---|---|
| A | 6978 | 5096 | 30 | 30 | 0.43% | 0.59% | 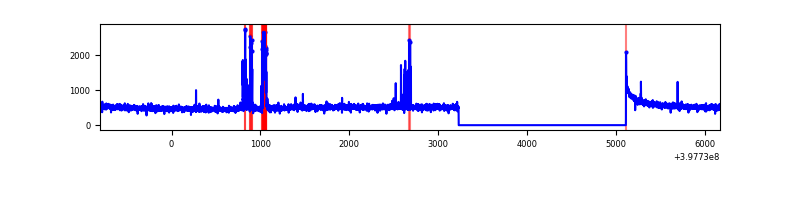 |
| B | 6978 | 5095 | 25 | 25 | 0.36% | 0.49% | 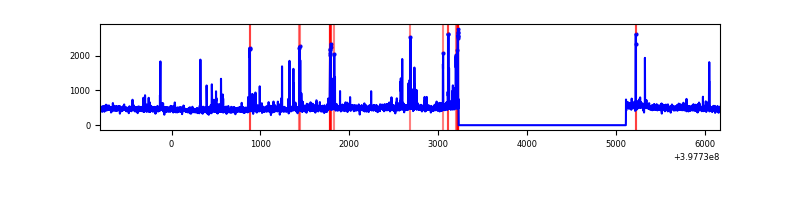 |
| C | 6978 | 5095 | 92 | 92 | 1.32% | 1.81% | 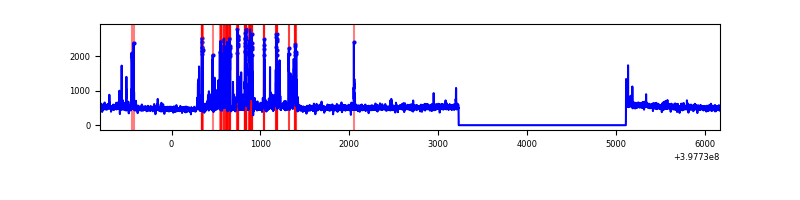 |
| D | 6978 | 5095 | 346 | 346 | 4.96% | 6.79% | 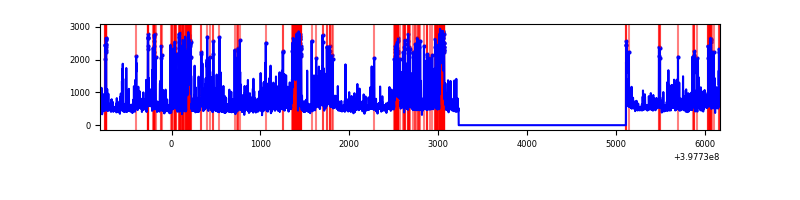 |
Top three noisy pixels from each quadrant. If the there are fewer than three noisy pixels in the level2.evt file, extra rows are filled as -1
| Pixel properties | Quadrant properties | ||||||
|---|---|---|---|---|---|---|---|
| Quadrant | DetID | PixID | Counts | Sigma | Mean | Median | Sigma |
| A | 10 | 83 | 208843 | 1673.66 | 612 | 601 | 124.4 |
| A | 15 | 237 | 176106 | 1410.55 | 612 | 601 | 124.4 |
| A | 12 | 189 | 9359 | 70.39 | 612 | 601 | 124.4 |
| B | 5 | 172 | 174154 | 1499.94 | 602 | 587 | 115.7 |
| B | 5 | 255 | 20129 | 168.88 | 602 | 587 | 115.7 |
| B | 5 | 200 | 18314 | 153.19 | 602 | 587 | 115.7 |
| C | 0 | 207 | 465158 | 3377.03 | 587 | 593 | 137.6 |
| C | 15 | 214 | 215685 | 1563.56 | 587 | 593 | 137.6 |
| C | 15 | 159 | 28409 | 202.2 | 587 | 593 | 137.6 |
| D | 1 | 52 | 592051 | 4197.41 | 583 | 567 | 140.9 |
| D | 13 | 249 | 512510 | 3632.96 | 583 | 567 | 140.9 |
| D | 13 | 171 | 338361 | 2397.12 | 583 | 567 | 140.9 |
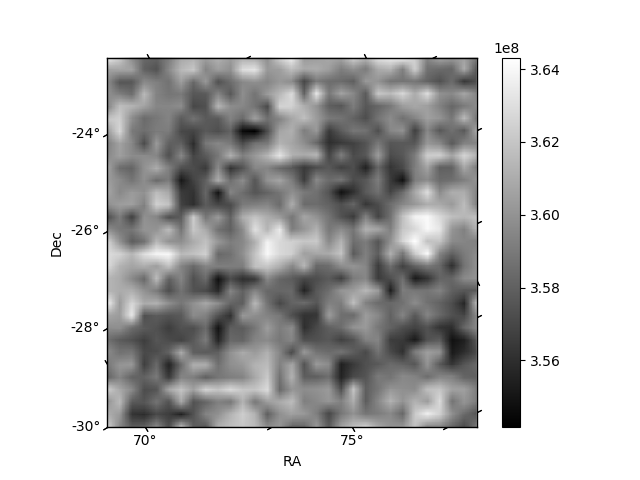
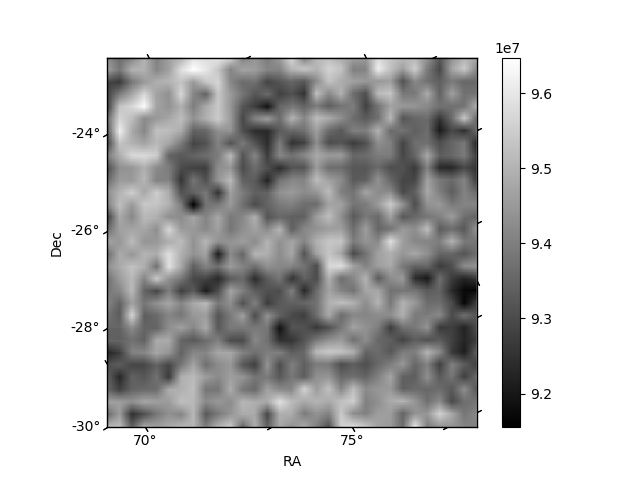
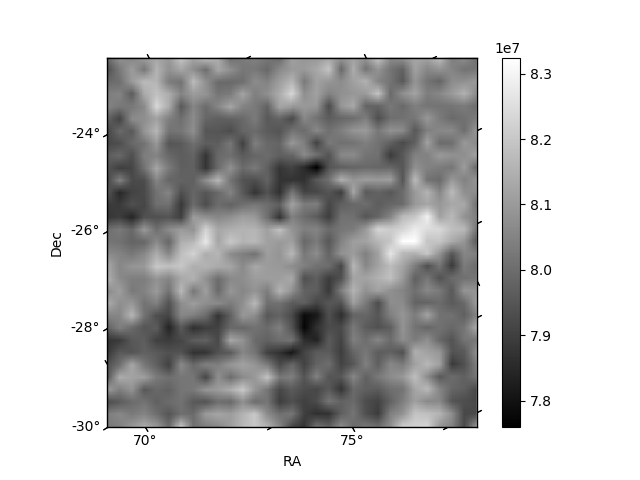
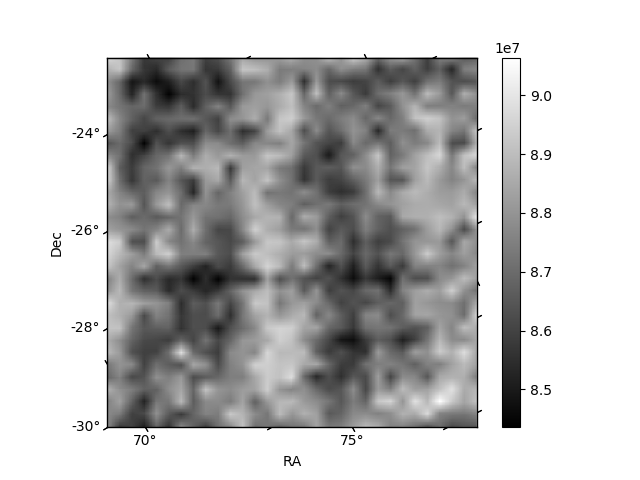
Histogram calculated using DETX and DETY for each event in the final _common_clean file
| Quadrant A | 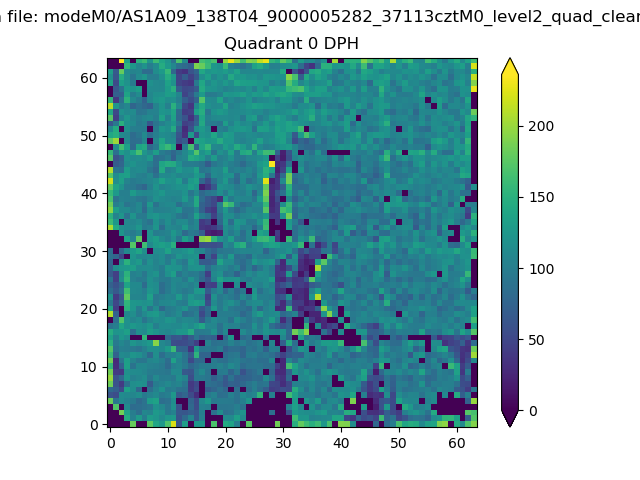 |
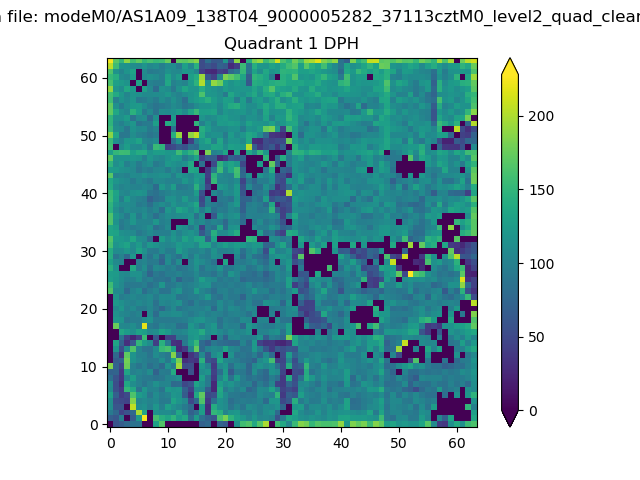 |
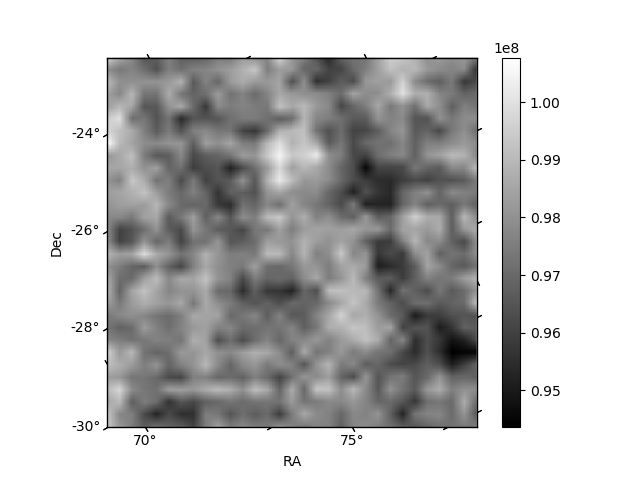
Quadrant B |
|---|---|---|---|
| Quadrant D | 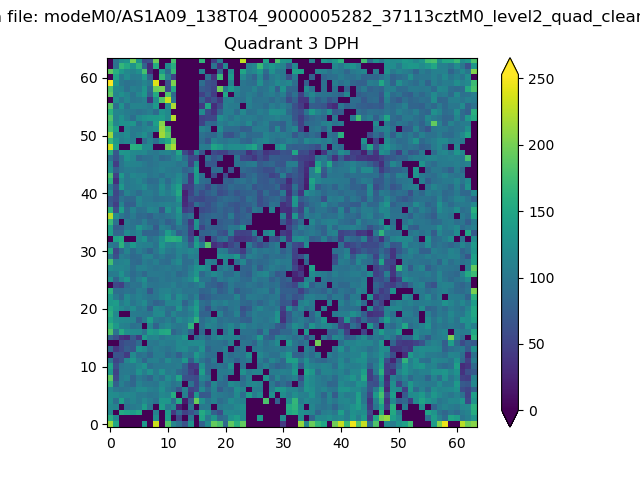 |
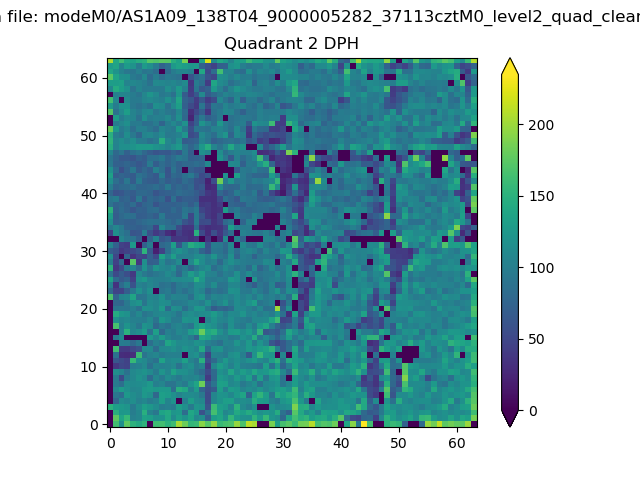 |
Quadrant C |
| Plot type | Count rate plots | Images |
|---|---|---|
| Comparison with Poisson distribution Blue bars denote a histogram of data divided into 1 sec bins. Red curve is a Poisson curve with rate = median count rate of data. |
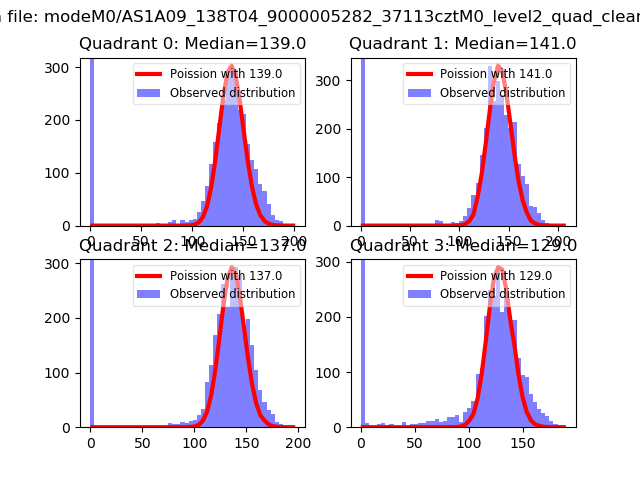 |
 |
| Quadrant-wise count rates Data is divided into 100 sec bins |
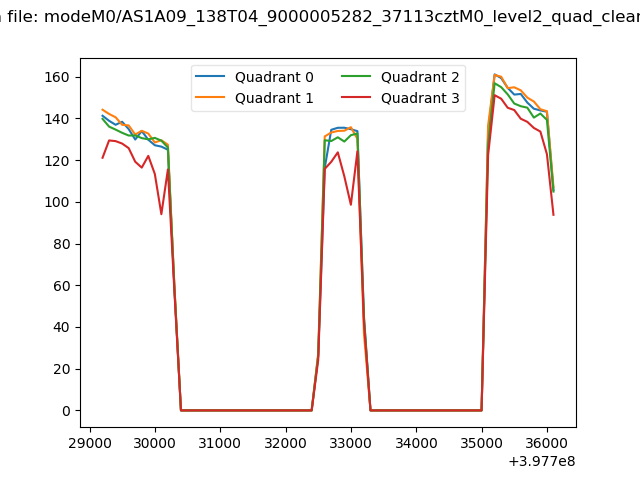 |
|
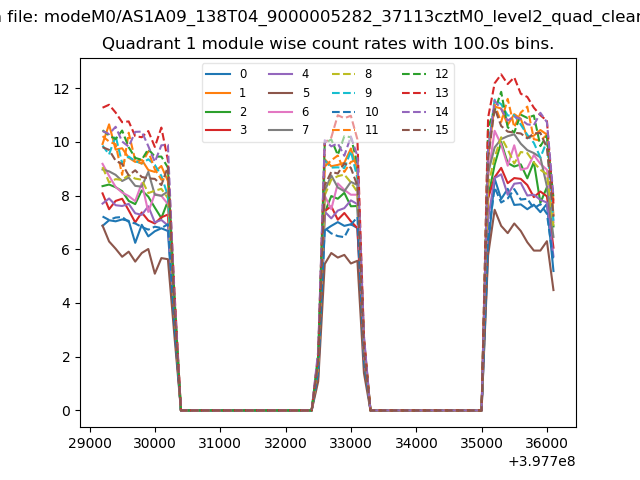
| Module-wise count rates for Quadrant A Data is divided into 100 sec bins |
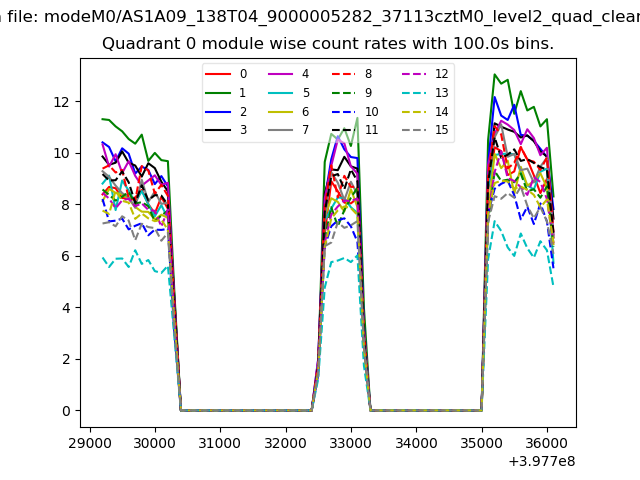 |
 |
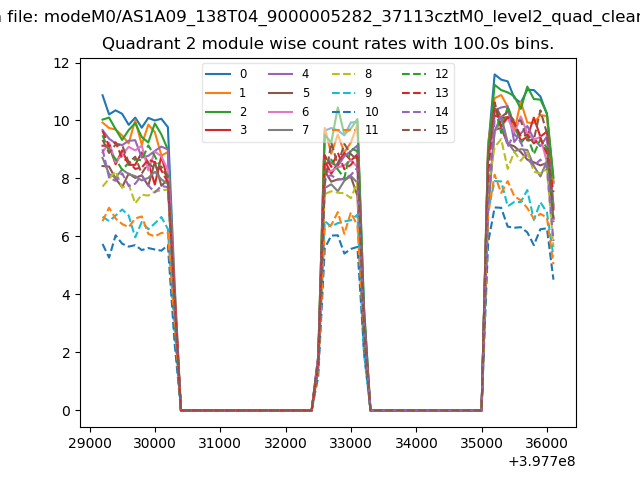
| Module-wise count rates for Quadrant B Data is divided into 100 sec bins |
 |
 |
| Module-wise count rates for Quadrant C Data is divided into 100 sec bins |
 |
 |
| Module-wise count rates for Quadrant D Data is divided into 100 sec bins |
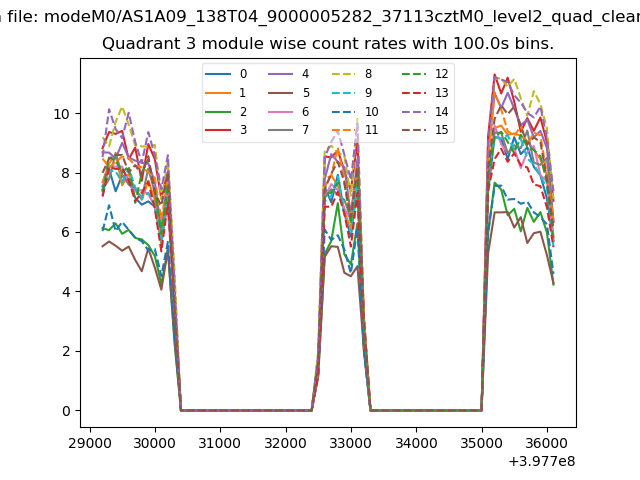 |
 |
| Parameter | Plot |
|---|---|
| CZT HV Monitor | 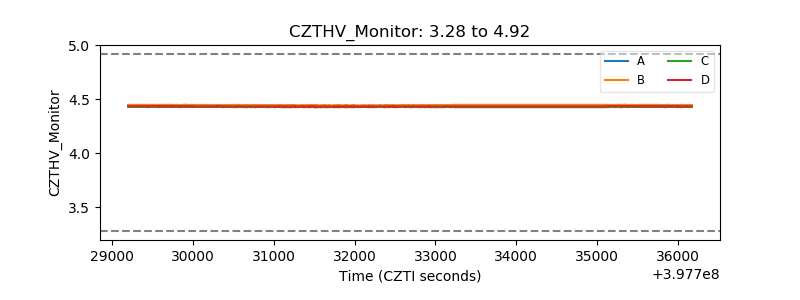 |
| D_VDD | 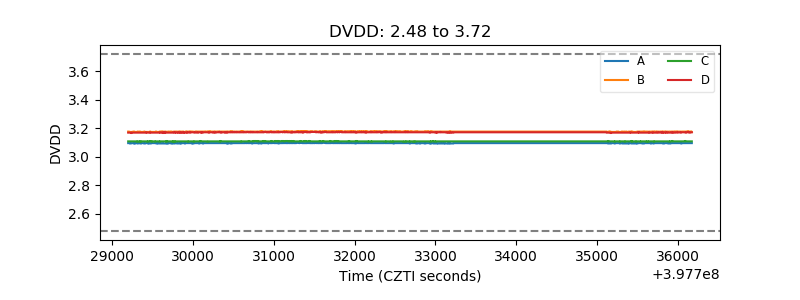 |
| Temperature 1 | 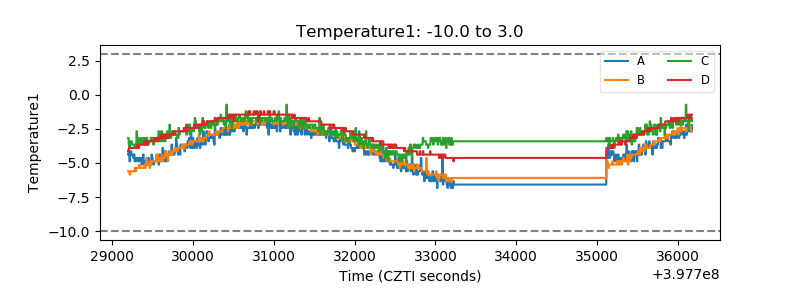 |
| Veto HV Monitor | 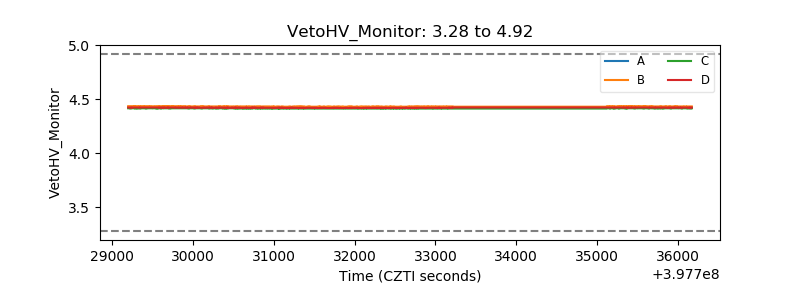 |
| Veto LLD | 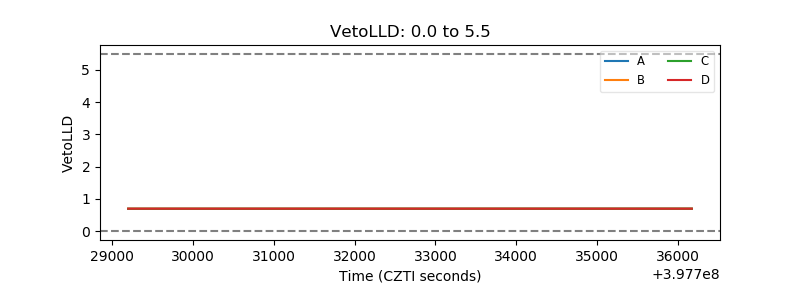 |
| Alpha Counter | 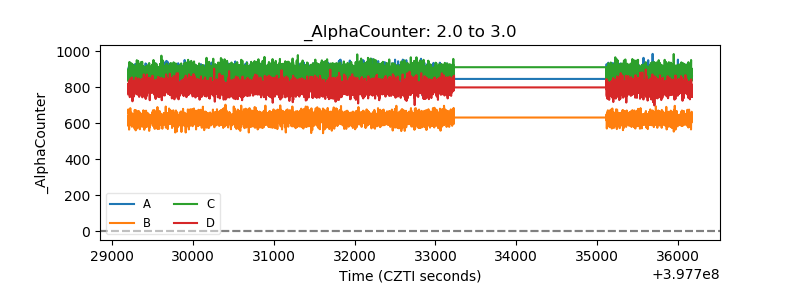 |
| _CPM_Rate | 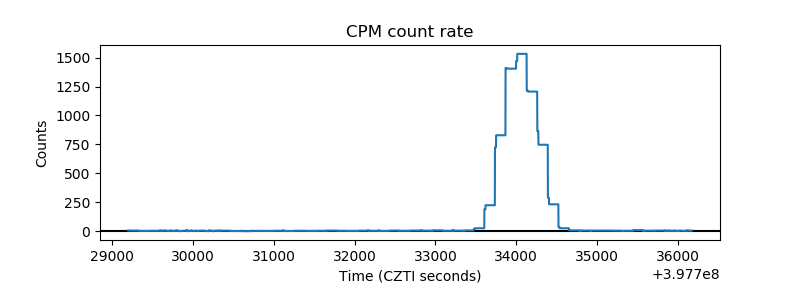 |
| CZT Counter | 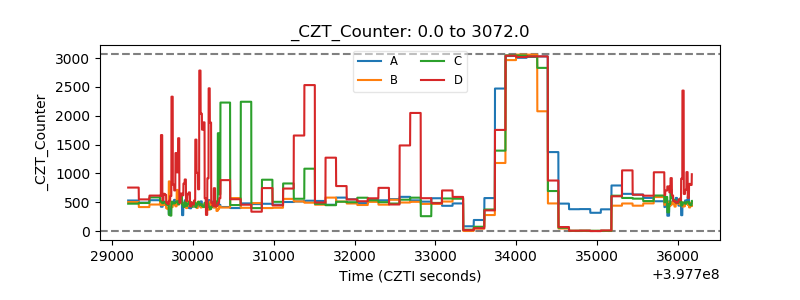 |
| +2.5 Volts monitor | 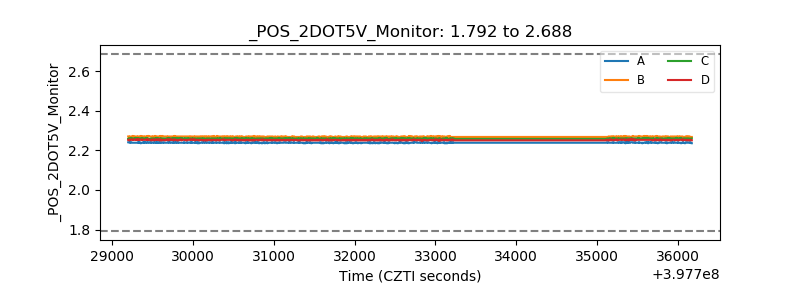 |
| +5 Volts monitor | 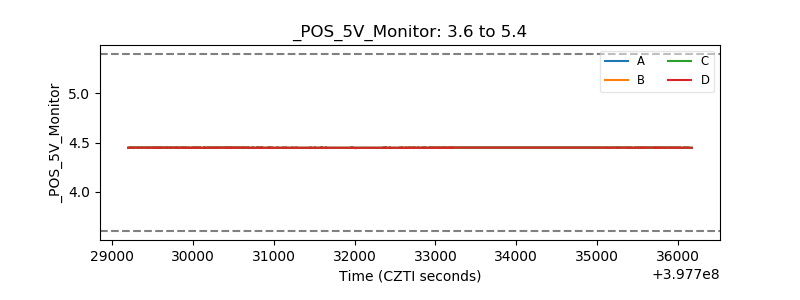 |
| _ROLL_ROT | 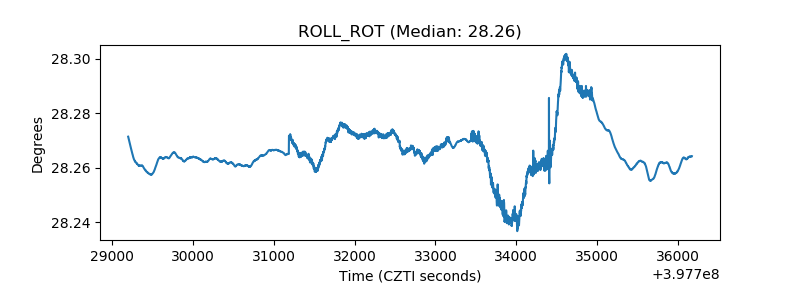 |
| _Roll_DEC | 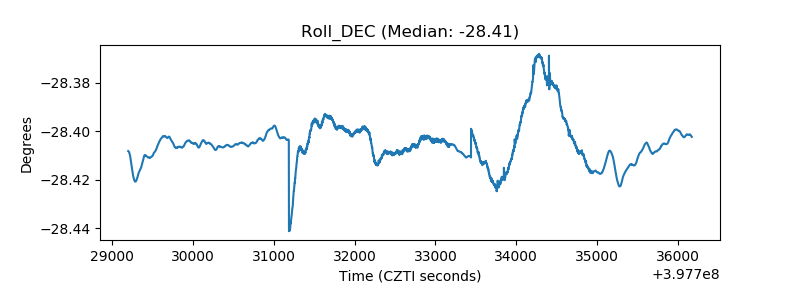 |
| _Roll_RA | 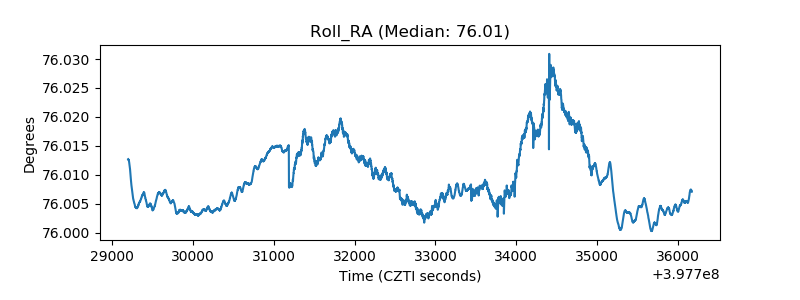 |
| Veto Counter | 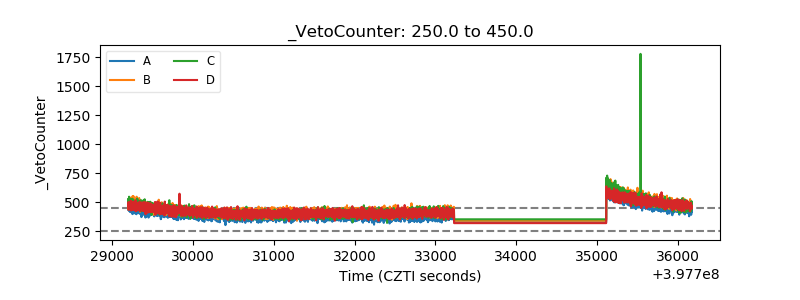 |