| Param | Original file | Final file |
|---|---|---|
| Filename | modeM0/AS1A09_138T04_9000005282_37114cztM0_level2.evt | modeM0/AS1A09_138T04_9000005282_37114cztM0_level2_quad_clean.evt |
| Size (bytes) | 431,199,360 | 63,411,840 |
| Size | 411.2 MB | 60.5 MB |
| Events in quadrant A | 2,921,185 | 402,226 |
| Events in quadrant B | 2,706,027 | 405,381 |
| Events in quadrant C | 2,761,751 | 388,346 |
| Events in quadrant D | 4,312,652 | 355,529 |
| Mode SS | |||
|---|---|---|---|
| Quadrant | BADHDUFLAG | Total packets | Discarded packets |
| A | 0 | 108 | 0 |
| B | 0 | 108 | 0 |
| C | 0 | 108 | 0 |
| D | 0 | 108 | 0 |
| Mode M0 | |||
|---|---|---|---|
| Quadrant | BADHDUFLAG | Total packets | Discarded packets |
| A | 0 | 11656 | 3 |
| B | 0 | 11044 | 2 |
| C | 0 | 11099 | 2 |
| D | 0 | 16270 | 2 |
| Mode M9 | |||
|---|---|---|---|
| Quadrant | BADHDUFLAG | Total packets | Discarded packets |
| A | 0 | 23 | 0 |
| B | 0 | 23 | 0 |
| C | 0 | 23 | 0 |
| D | 0 | 24 | 0 |
| Quadrant | Total seconds | Saturated seconds | Saturation percentage |
|---|---|---|---|
| A | 5258 | 24 | 0.456447% |
| B | 5258 | 17 | 0.323317% |
| C | 5258 | 8 | 0.152149% |
| D | 5258 | 341 | 6.485356% |
Noise dominated data is calculated using 1-second bins in cleaned event files. If a bin has >2000 counts, and if more than 50% of those come from <1% of pixels, then it is considered to be noise-dominated and hence unusable.
| Quadrant | # 1 sec bins | Bins with >0 counts | Bins with >2000 counts | High rate bins dominated by noise | Noise dominated (total time) | Noise dominated (detector-on time) | Marked lightcurve |
|---|---|---|---|---|---|---|---|
| A | 7261 | 5259 | 16 | 16 | 0.22% | 0.30% | 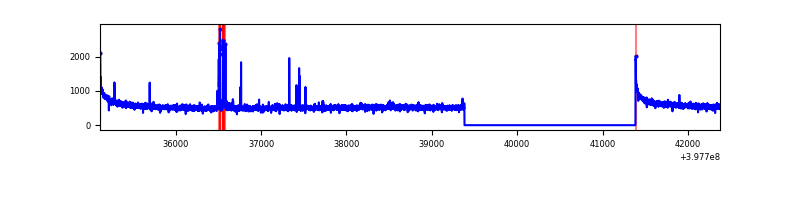 |
| B | 7260 | 5257 | 4 | 4 | 0.06% | 0.08% | 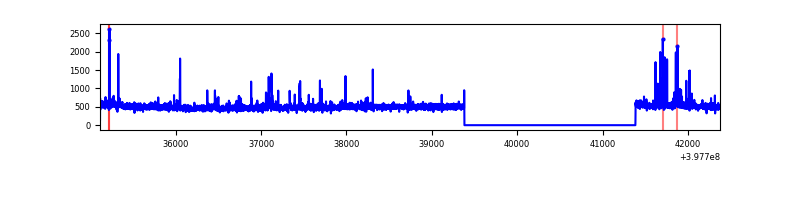 |
| C | 7260 | 5258 | 5 | 5 | 0.07% | 0.10% | 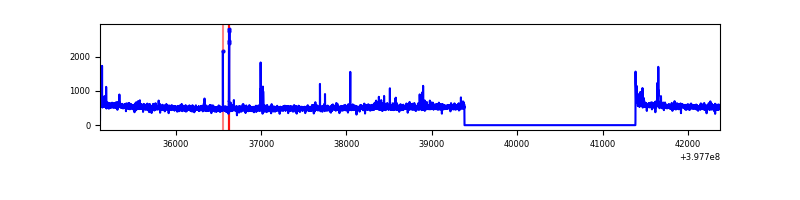 |
| D | 7260 | 5257 | 299 | 299 | 4.12% | 5.69% | 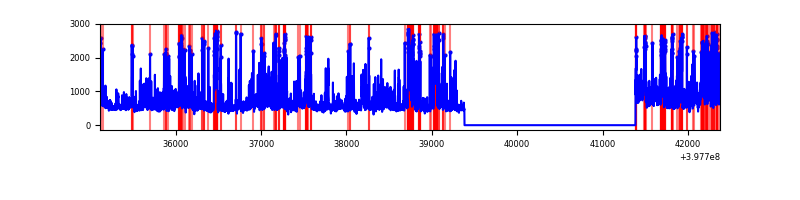 |
Top three noisy pixels from each quadrant. If the there are fewer than three noisy pixels in the level2.evt file, extra rows are filled as -1
| Pixel properties | Quadrant properties | ||||||
|---|---|---|---|---|---|---|---|
| Quadrant | DetID | PixID | Counts | Sigma | Mean | Median | Sigma |
| A | 10 | 83 | 270372 | 2000.24 | 666 | 653 | 134.8 |
| A | 15 | 237 | 64261 | 471.72 | 666 | 653 | 134.8 |
| A | 9 | 143 | 11369 | 79.47 | 666 | 653 | 134.8 |
| B | 5 | 172 | 67449 | 541.51 | 652 | 637 | 123.4 |
| B | 5 | 200 | 16874 | 131.6 | 652 | 637 | 123.4 |
| B | 0 | 190 | 16715 | 130.31 | 652 | 637 | 123.4 |
| C | 15 | 214 | 228364 | 1565.87 | 629 | 636 | 145.4 |
| C | 0 | 10 | 35376 | 238.87 | 629 | 636 | 145.4 |
| C | 15 | 208 | 33858 | 228.44 | 629 | 636 | 145.4 |
| D | 13 | 249 | 622043 | 4109.34 | 624 | 608 | 151.2 |
| D | 1 | 52 | 356218 | 2351.53 | 624 | 608 | 151.2 |
| D | 13 | 171 | 346192 | 2285.23 | 624 | 608 | 151.2 |
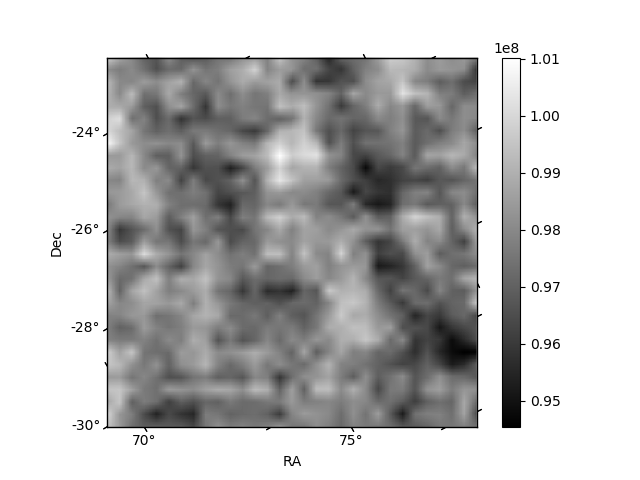
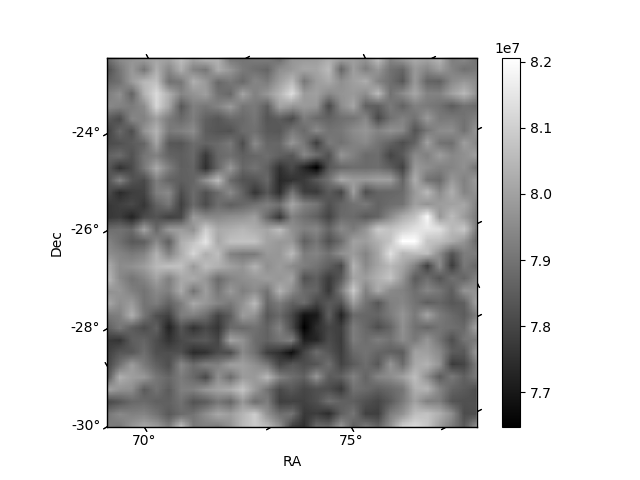
Histogram calculated using DETX and DETY for each event in the final _common_clean file
| Quadrant A | 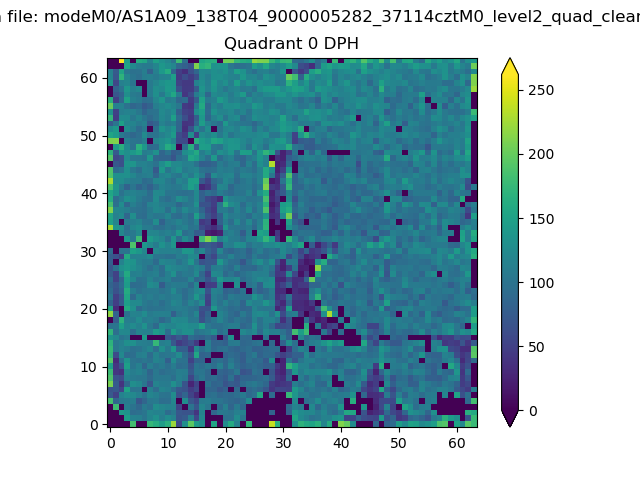 |
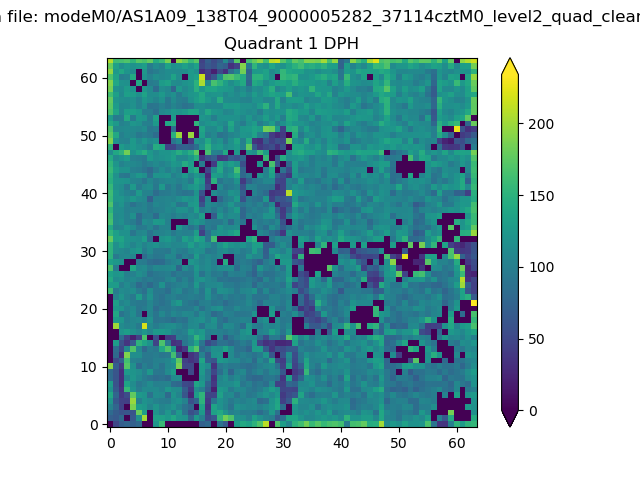 |
Quadrant B |
|---|---|---|---|
| Quadrant D |  |
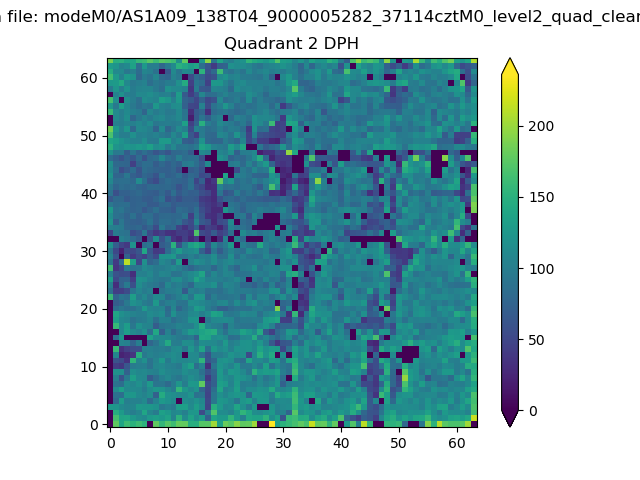 |
Quadrant C |
| Plot type | Count rate plots | Images |
|---|---|---|
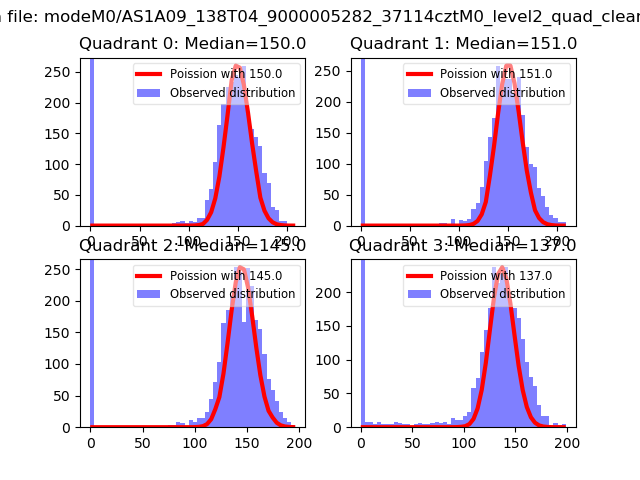
| Comparison with Poisson distribution Blue bars denote a histogram of data divided into 1 sec bins. Red curve is a Poisson curve with rate = median count rate of data. |
 |
 |
| Quadrant-wise count rates Data is divided into 100 sec bins |
 |
|
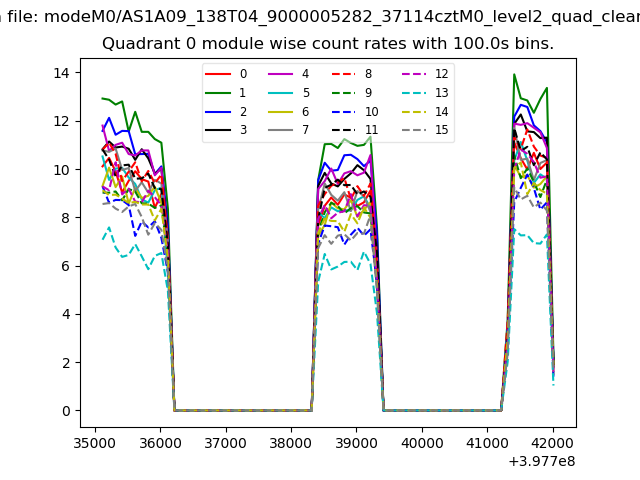
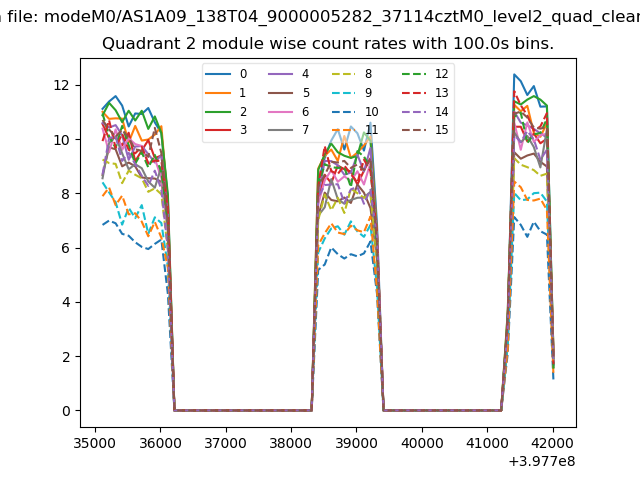
| Module-wise count rates for Quadrant A Data is divided into 100 sec bins |
 |
 |
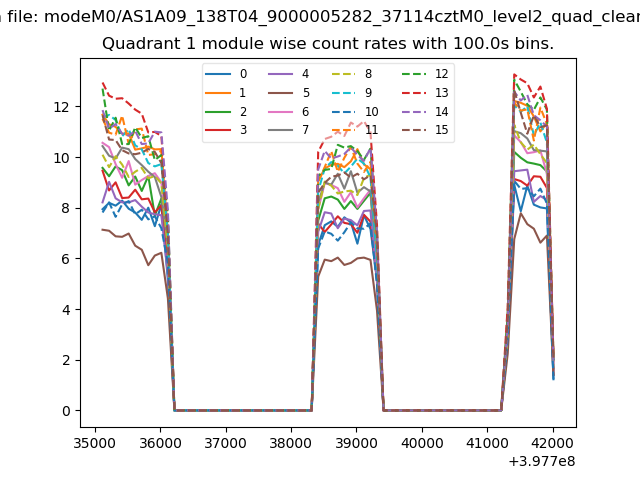
| Module-wise count rates for Quadrant B Data is divided into 100 sec bins |
 |
 |
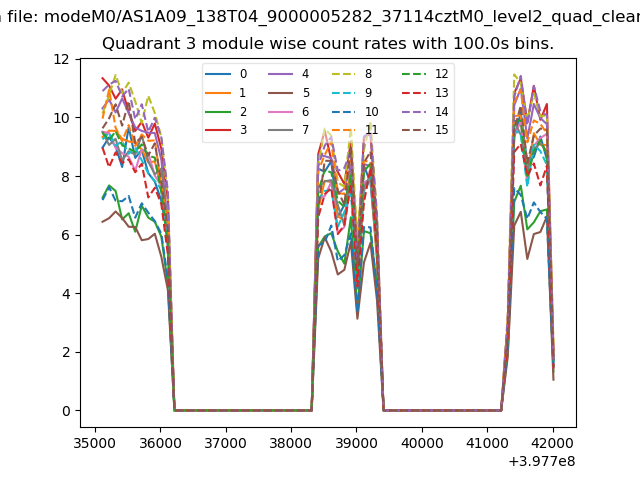
| Module-wise count rates for Quadrant C Data is divided into 100 sec bins |
 |
 |
| Module-wise count rates for Quadrant D Data is divided into 100 sec bins |
 |
 |
| Parameter | Plot |
|---|---|
| CZT HV Monitor | 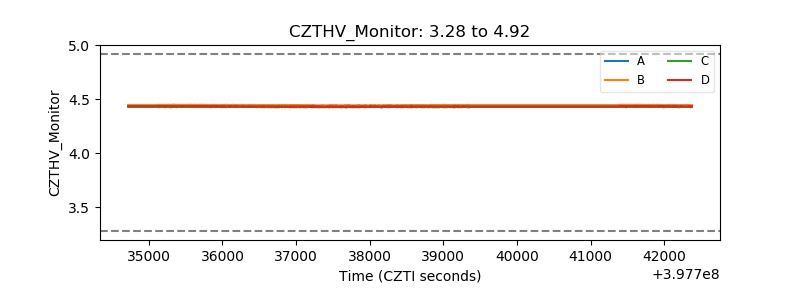 |
| D_VDD | 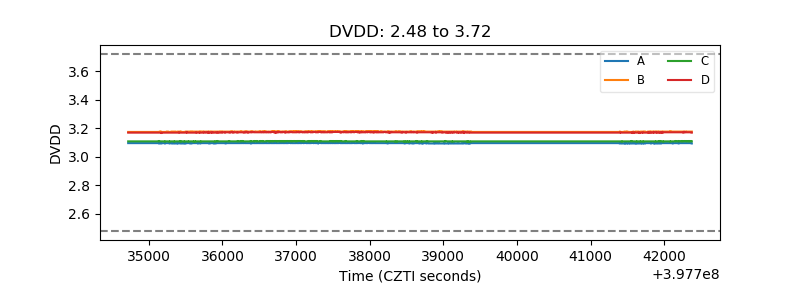 |
| Temperature 1 | 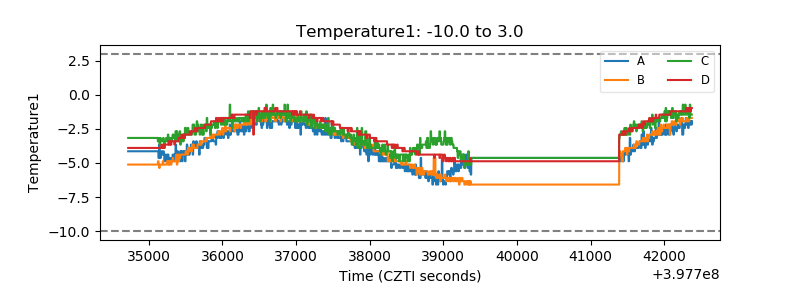 |
| Veto HV Monitor |  |
| Veto LLD | 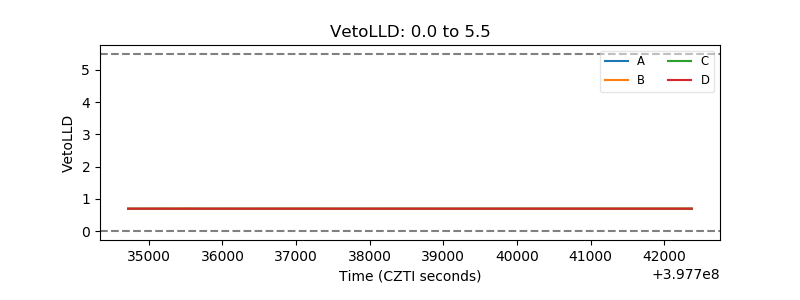 |
| Alpha Counter | 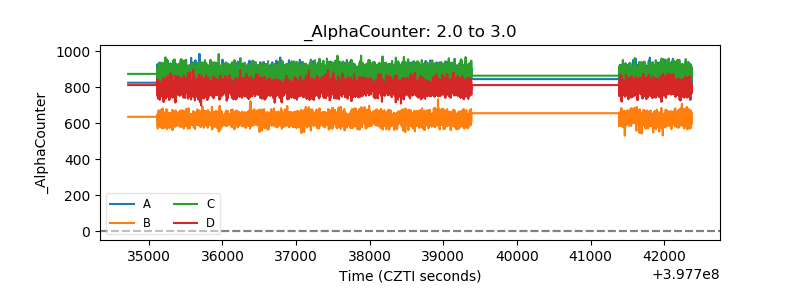 |
| _CPM_Rate | 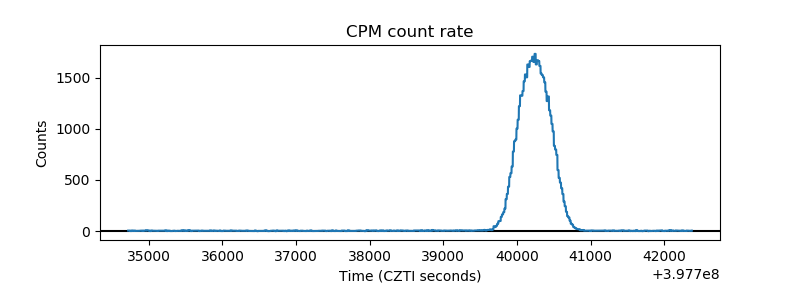 |
| CZT Counter | 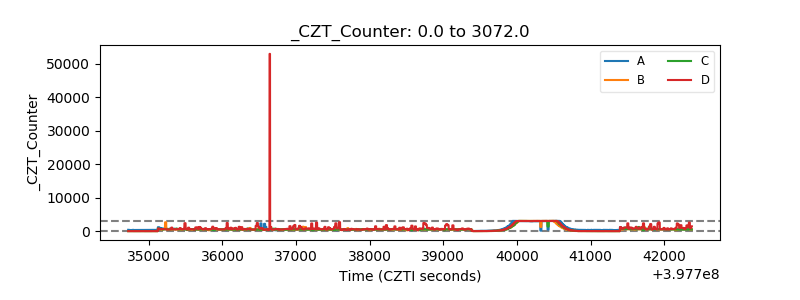 |
| +2.5 Volts monitor | 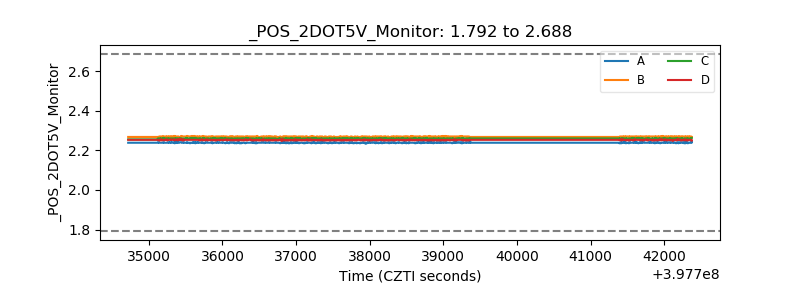 |
| +5 Volts monitor | 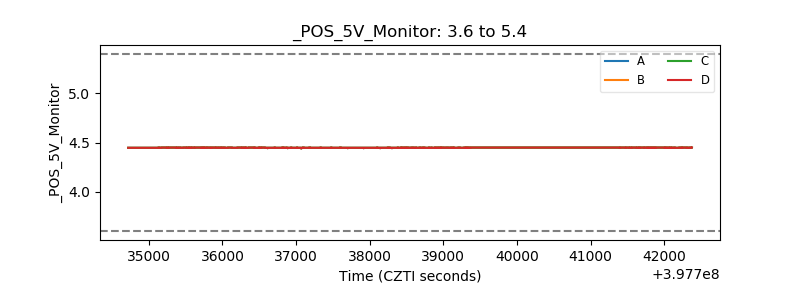 |
| _ROLL_ROT | 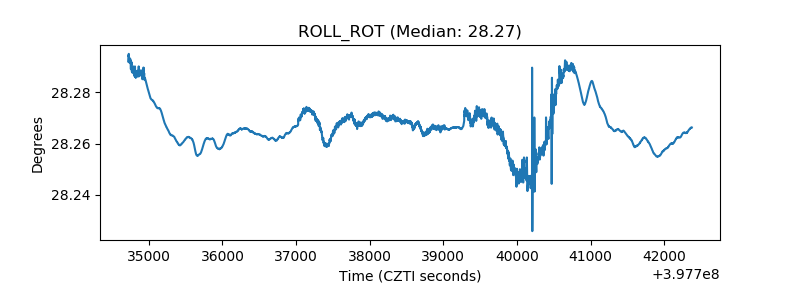 |
| _Roll_DEC | 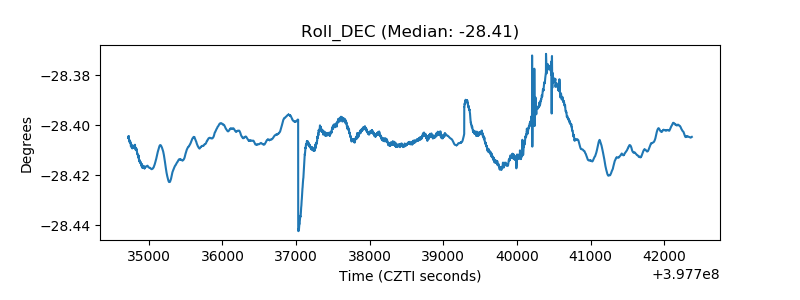 |
| _Roll_RA | 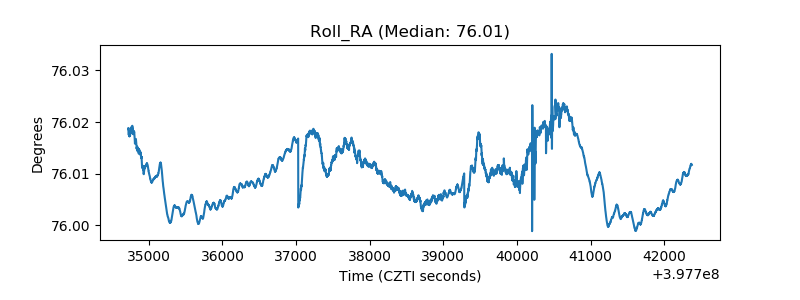 |
| Veto Counter | 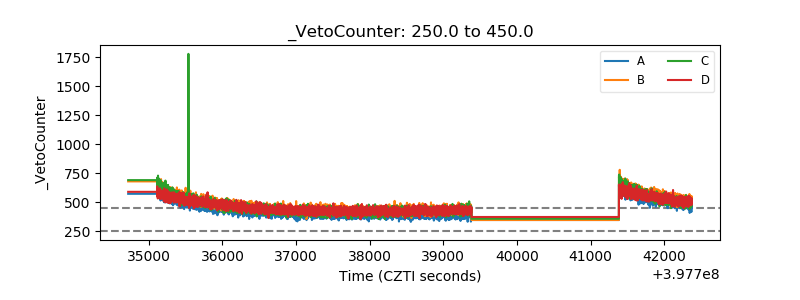 |