| Param | Original file | Final file |
|---|---|---|
| Filename | modeM0/AS1A09_138T04_9000005282_37115cztM0_level2.evt | modeM0/AS1A09_138T04_9000005282_37115cztM0_level2_quad_clean.evt |
| Size (bytes) | 446,621,760 | 53,619,840 |
| Size | 425.9 MB | 51.1 MB |
| Events in quadrant A | 2,983,515 | 324,790 |
| Events in quadrant B | 3,000,855 | 327,933 |
| Events in quadrant C | 2,762,192 | 313,130 |
| Events in quadrant D | 4,427,399 | 293,877 |
| Mode SS | |||
|---|---|---|---|
| Quadrant | BADHDUFLAG | Total packets | Discarded packets |
| A | 0 | 106 | 0 |
| B | 0 | 106 | 0 |
| C | 0 | 106 | 0 |
| D | 0 | 106 | 0 |
| Mode M0 | |||
|---|---|---|---|
| Quadrant | BADHDUFLAG | Total packets | Discarded packets |
| A | 0 | 11808 | 3 |
| B | 0 | 11927 | 2 |
| C | 0 | 10986 | 2 |
| D | 0 | 16735 | 2 |
| Mode M9 | |||
|---|---|---|---|
| Quadrant | BADHDUFLAG | Total packets | Discarded packets |
| A | 0 | 23 | 0 |
| B | 0 | 23 | 0 |
| C | 0 | 23 | 0 |
| D | 0 | 24 | 0 |
| Quadrant | Total seconds | Saturated seconds | Saturation percentage |
|---|---|---|---|
| A | 5187 | 49 | 0.944669% |
| B | 5187 | 92 | 1.773665% |
| C | 5187 | 4 | 0.077116% |
| D | 5187 | 247 | 4.761905% |
Noise dominated data is calculated using 1-second bins in cleaned event files. If a bin has >2000 counts, and if more than 50% of those come from <1% of pixels, then it is considered to be noise-dominated and hence unusable.
| Quadrant | # 1 sec bins | Bins with >0 counts | Bins with >2000 counts | High rate bins dominated by noise | Noise dominated (total time) | Noise dominated (detector-on time) | Marked lightcurve |
|---|---|---|---|---|---|---|---|
| A | 7281 | 5188 | 41 | 41 | 0.56% | 0.79% | 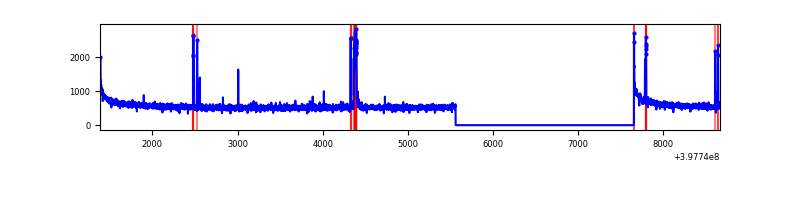 |
| B | 7280 | 5186 | 50 | 50 | 0.69% | 0.96% | 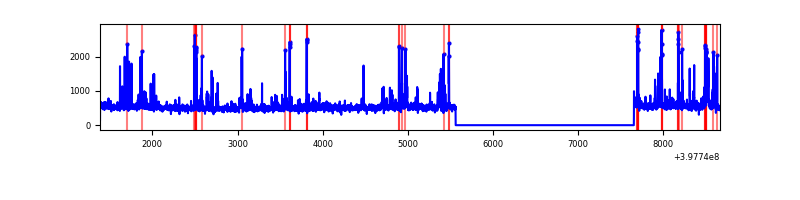 |
| C | 7281 | 5187 | 4 | 4 | 0.05% | 0.08% | 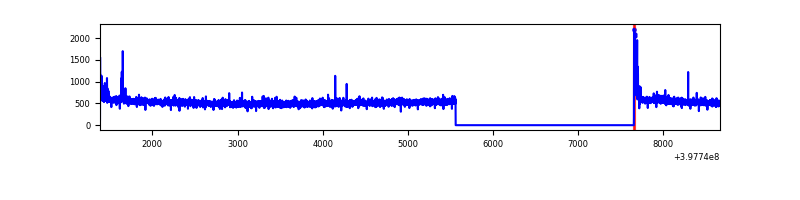 |
| D | 7280 | 5187 | 245 | 245 | 3.37% | 4.72% | 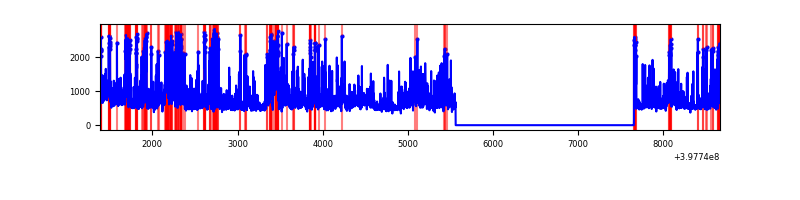 |
Top three noisy pixels from each quadrant. If the there are fewer than three noisy pixels in the level2.evt file, extra rows are filled as -1
| Pixel properties | Quadrant properties | ||||||
|---|---|---|---|---|---|---|---|
| Quadrant | DetID | PixID | Counts | Sigma | Mean | Median | Sigma |
| A | 10 | 83 | 263096 | 1977.64 | 666 | 654 | 132.7 |
| A | 15 | 237 | 105856 | 792.75 | 666 | 654 | 132.7 |
| A | 9 | 143 | 22740 | 166.43 | 666 | 654 | 132.7 |
| B | 5 | 172 | 215002 | 1743.91 | 651 | 636 | 122.9 |
| B | 5 | 200 | 83519 | 674.27 | 651 | 636 | 122.9 |
| B | 15 | 85 | 47529 | 381.48 | 651 | 636 | 122.9 |
| C | 15 | 214 | 225104 | 1547.25 | 631 | 636 | 145.1 |
| C | 0 | 10 | 56296 | 383.66 | 631 | 636 | 145.1 |
| C | 15 | 208 | 14481 | 95.43 | 631 | 636 | 145.1 |
| D | 1 | 52 | 744893 | 4850.83 | 633 | 617 | 153.4 |
| D | 12 | 233 | 347956 | 2263.79 | 633 | 617 | 153.4 |
| D | 13 | 249 | 276585 | 1798.62 | 633 | 617 | 153.4 |
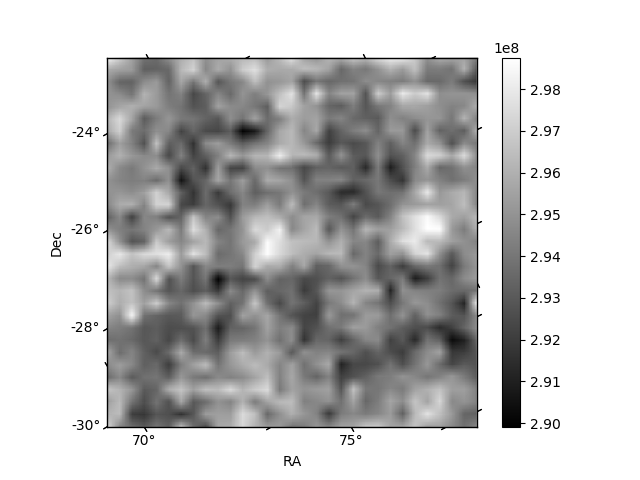
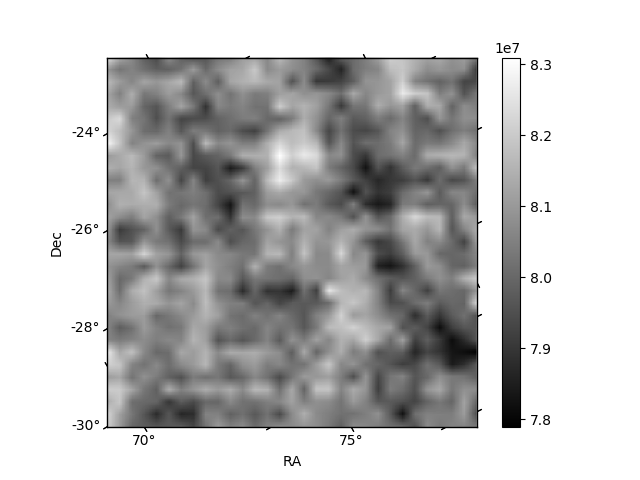
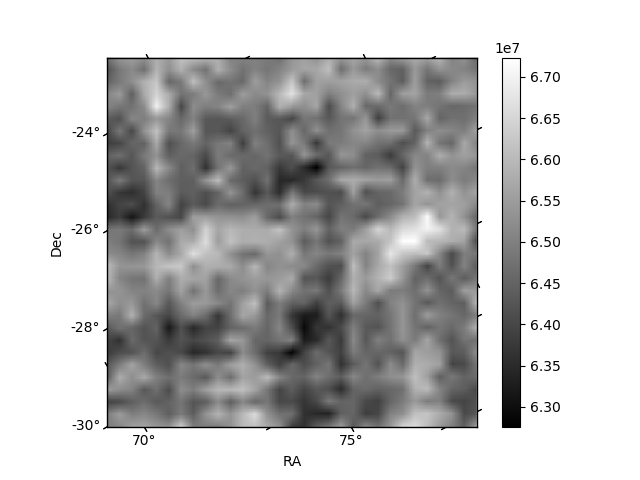
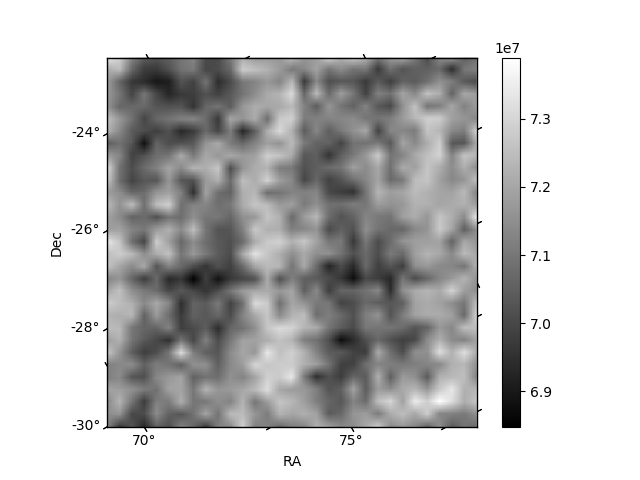
Histogram calculated using DETX and DETY for each event in the final _common_clean file
| Quadrant A | 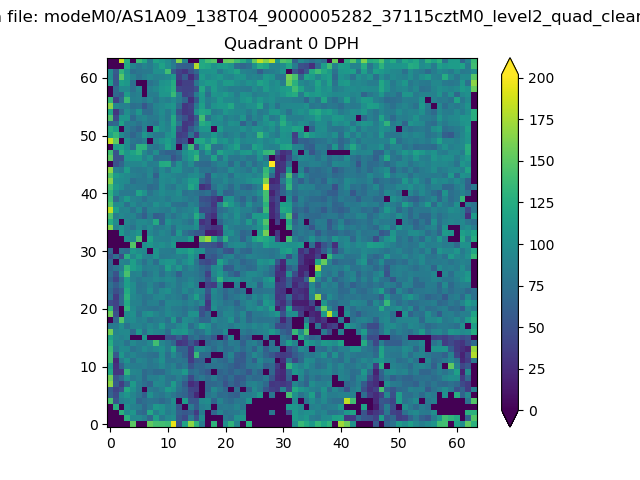 |
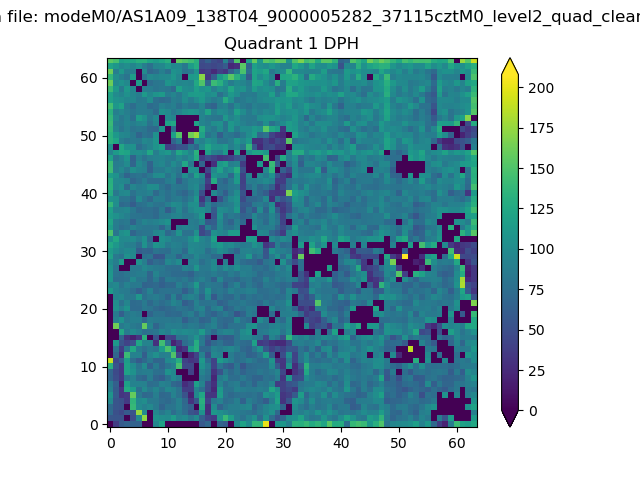 |
Quadrant B |
|---|---|---|---|
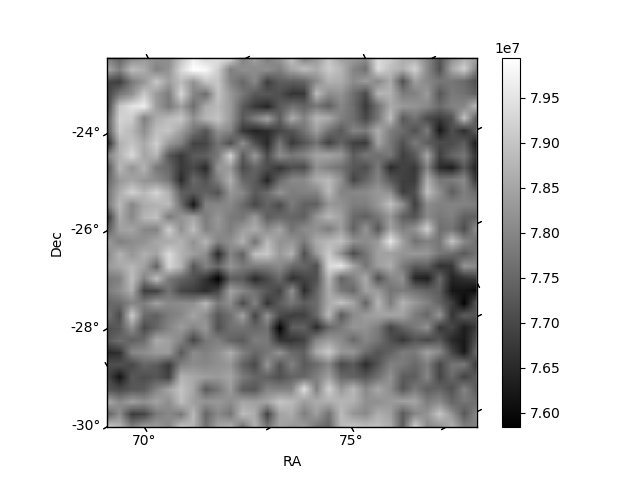
| Quadrant D |  |
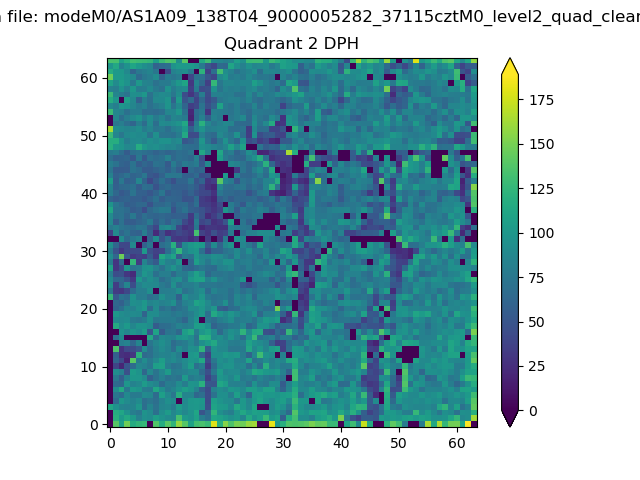 |
Quadrant C |
| Plot type | Count rate plots | Images |
|---|---|---|
| Comparison with Poisson distribution Blue bars denote a histogram of data divided into 1 sec bins. Red curve is a Poisson curve with rate = median count rate of data. |
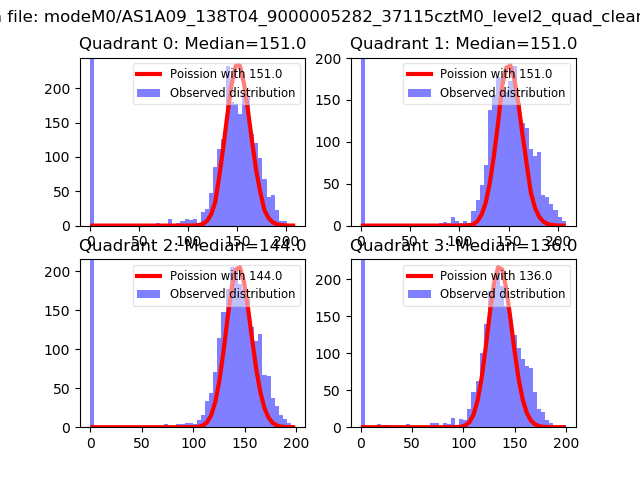 |
 |
| Quadrant-wise count rates Data is divided into 100 sec bins |
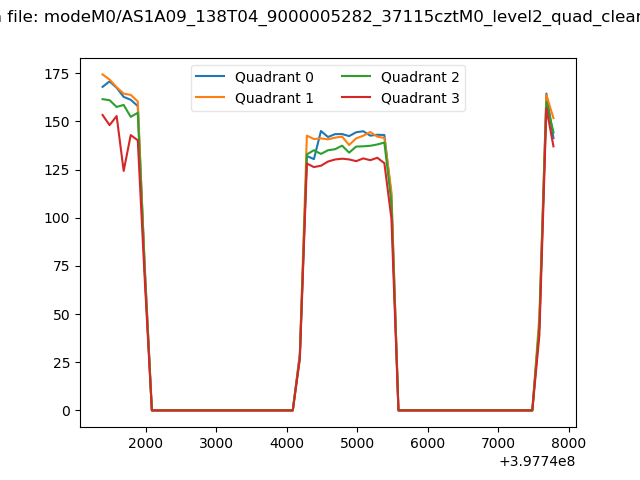 |
|
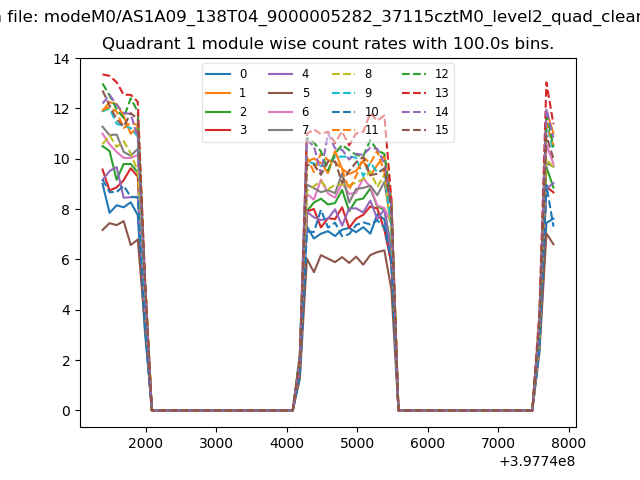
| Module-wise count rates for Quadrant A Data is divided into 100 sec bins |
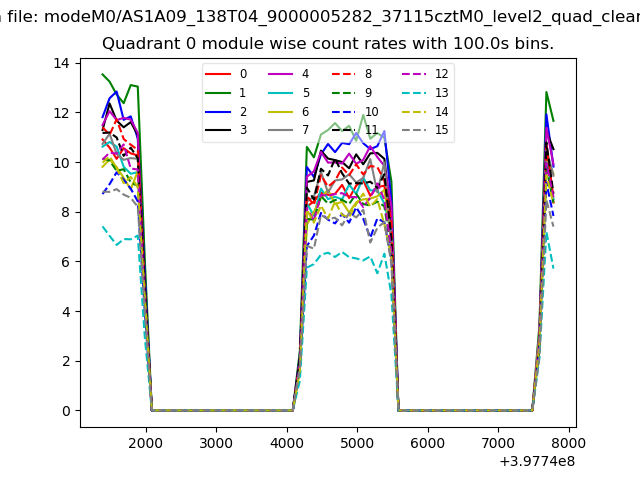 |
 |
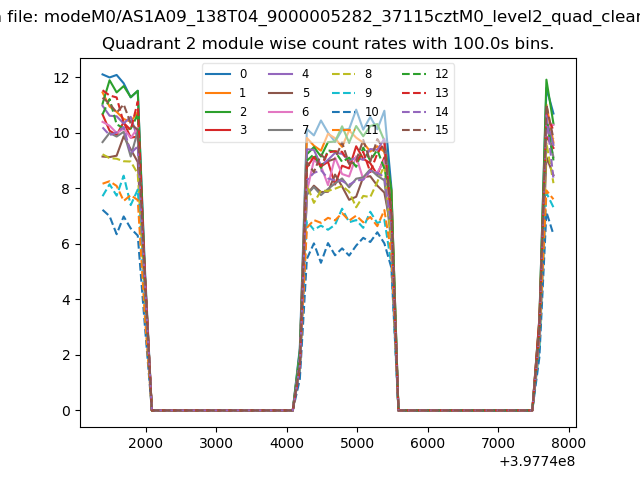
| Module-wise count rates for Quadrant B Data is divided into 100 sec bins |
 |
 |
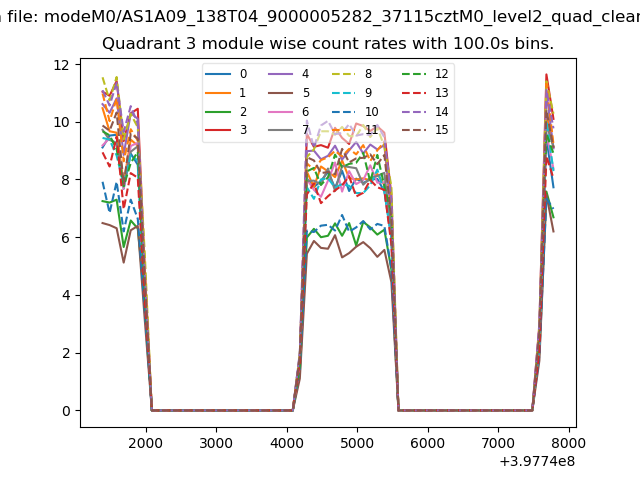
| Module-wise count rates for Quadrant C Data is divided into 100 sec bins |
 |
 |
| Module-wise count rates for Quadrant D Data is divided into 100 sec bins |
 |
 |
| Parameter | Plot |
|---|---|
| CZT HV Monitor | 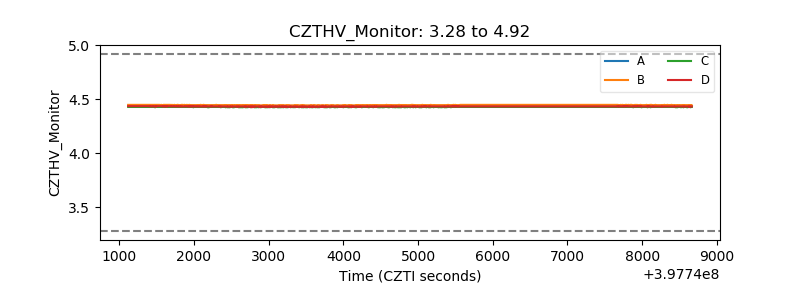 |
| D_VDD | 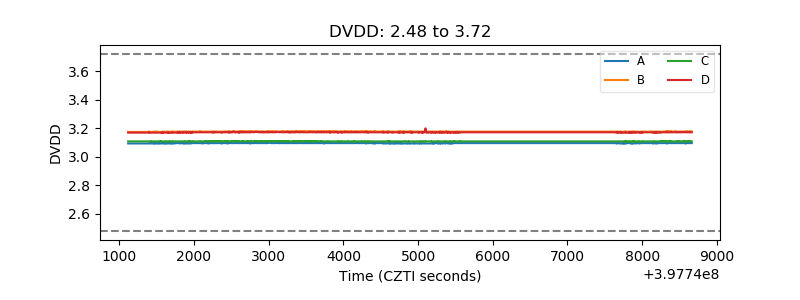 |
| Temperature 1 | 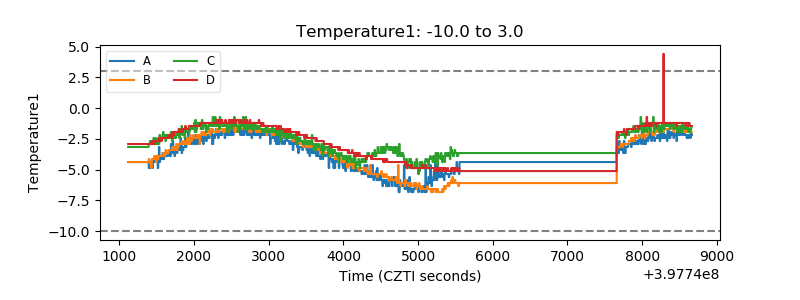 |
| Veto HV Monitor | 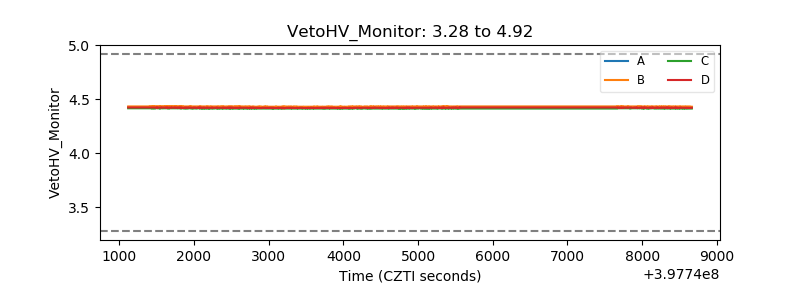 |
| Veto LLD | 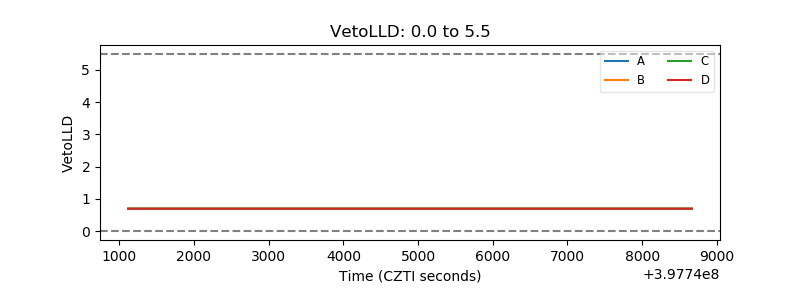 |
| Alpha Counter | 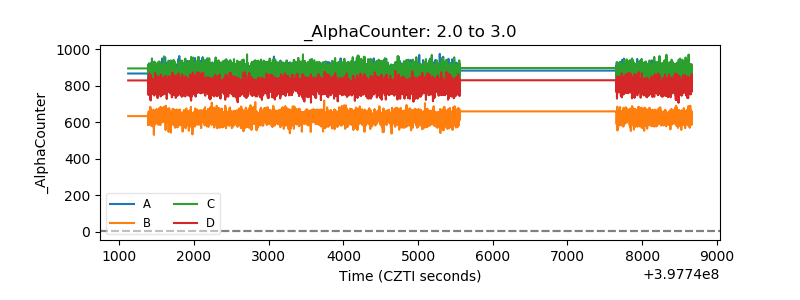 |
| _CPM_Rate | 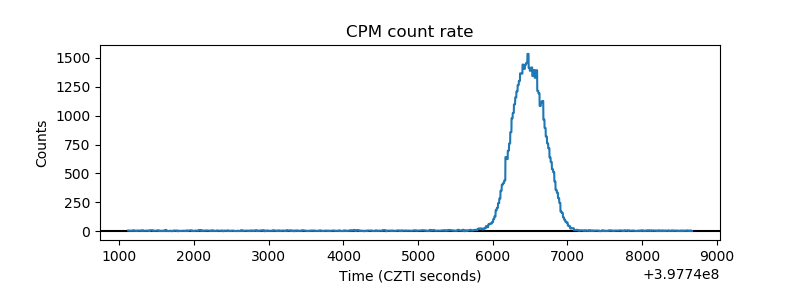 |
| CZT Counter | 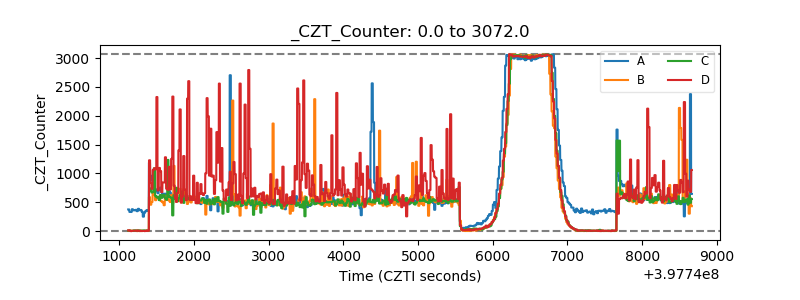 |
| +2.5 Volts monitor | 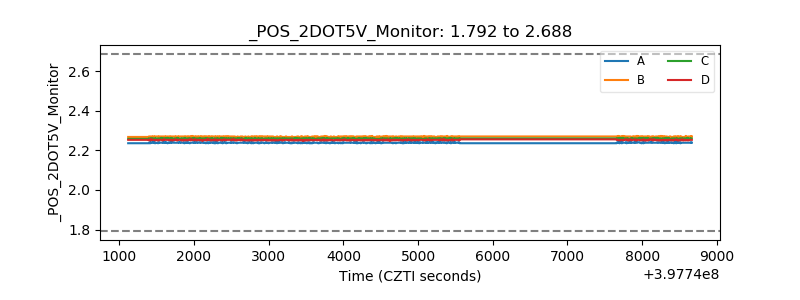 |
| +5 Volts monitor | 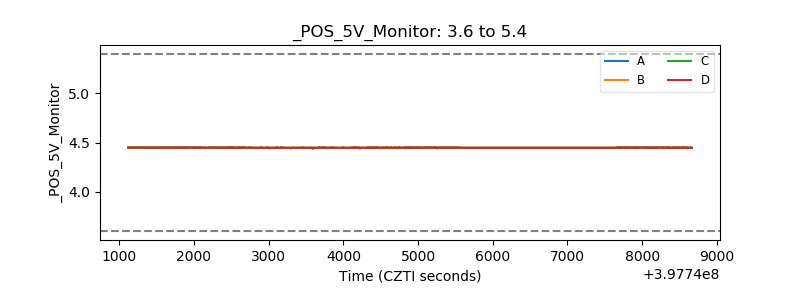 |
| _ROLL_ROT | 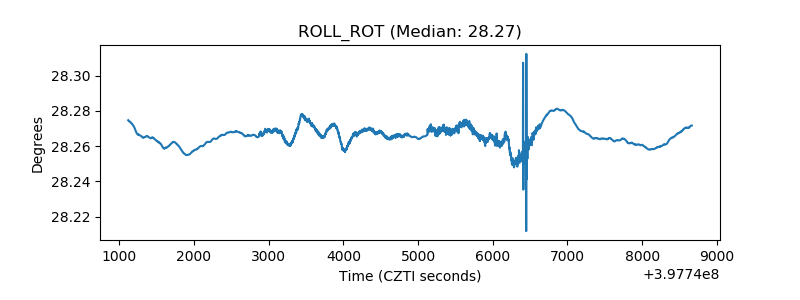 |
| _Roll_DEC | 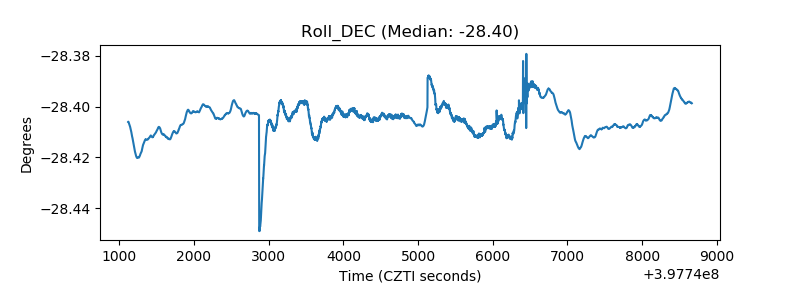 |
| _Roll_RA | 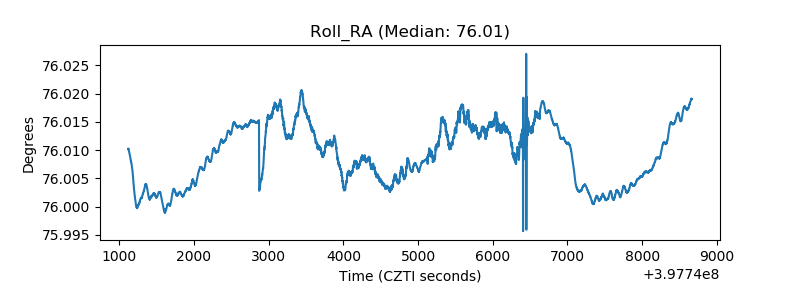 |
| Veto Counter | 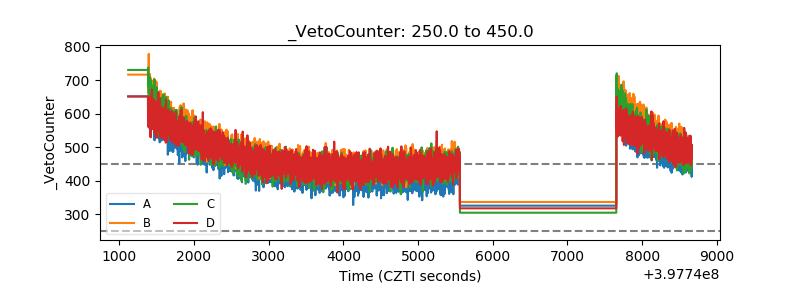 |