| Param | Original file | Final file |
|---|---|---|
| Filename | modeM0/AS1A09_138T04_9000005282_37116cztM0_level2.evt | modeM0/AS1A09_138T04_9000005282_37116cztM0_level2_quad_clean.evt |
| Size (bytes) | 440,634,240 | 46,543,680 |
| Size | 420.2 MB | 44.4 MB |
| Events in quadrant A | 2,927,767 | 271,710 |
| Events in quadrant B | 3,015,969 | 269,767 |
| Events in quadrant C | 2,694,003 | 260,804 |
| Events in quadrant D | 4,362,736 | 251,040 |
| Mode SS | |||
|---|---|---|---|
| Quadrant | BADHDUFLAG | Total packets | Discarded packets |
| A | 0 | 102 | 0 |
| B | 0 | 102 | 0 |
| C | 0 | 102 | 0 |
| D | 0 | 102 | 0 |
| Mode M0 | |||
|---|---|---|---|
| Quadrant | BADHDUFLAG | Total packets | Discarded packets |
| A | 0 | 11637 | 3 |
| B | 0 | 11932 | 2 |
| C | 0 | 10735 | 2 |
| D | 0 | 16359 | 2 |
| Mode M9 | |||
|---|---|---|---|
| Quadrant | BADHDUFLAG | Total packets | Discarded packets |
| A | 0 | 26 | 0 |
| B | 0 | 26 | 0 |
| C | 0 | 26 | 0 |
| D | 0 | 27 | 0 |
| Quadrant | Total seconds | Saturated seconds | Saturation percentage |
|---|---|---|---|
| A | 5075 | 57 | 1.123153% |
| B | 5075 | 145 | 2.857143% |
| C | 5075 | 4 | 0.078818% |
| D | 5075 | 424 | 8.354680% |
Noise dominated data is calculated using 1-second bins in cleaned event files. If a bin has >2000 counts, and if more than 50% of those come from <1% of pixels, then it is considered to be noise-dominated and hence unusable.
| Quadrant | # 1 sec bins | Bins with >0 counts | Bins with >2000 counts | High rate bins dominated by noise | Noise dominated (total time) | Noise dominated (detector-on time) | Marked lightcurve |
|---|---|---|---|---|---|---|---|
| A | 7229 | 5076 | 52 | 52 | 0.72% | 1.02% | 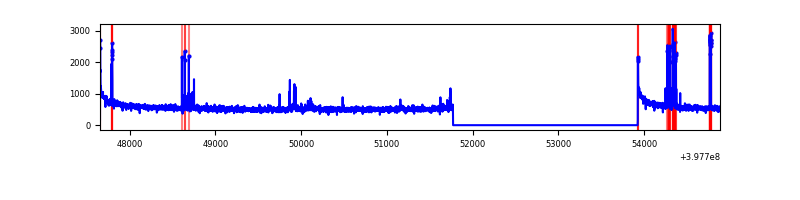 |
| B | 7228 | 5075 | 92 | 92 | 1.27% | 1.81% | 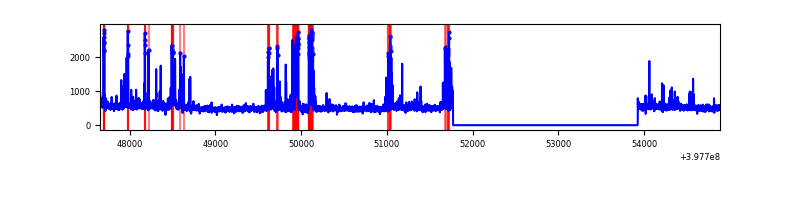 |
| C | 7228 | 5075 | 5 | 5 | 0.07% | 0.10% | 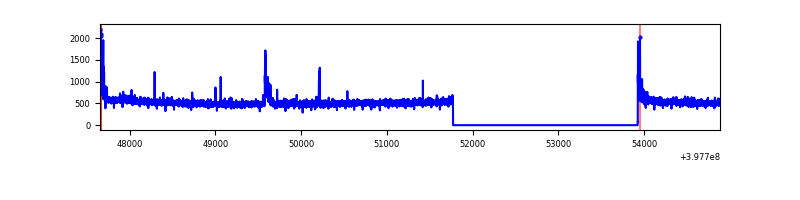 |
| D | 7229 | 5076 | 388 | 388 | 5.37% | 7.64% | 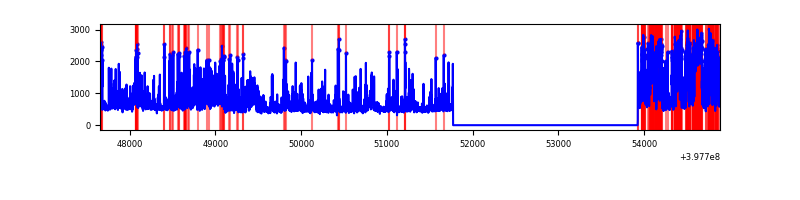 |
Top three noisy pixels from each quadrant. If the there are fewer than three noisy pixels in the level2.evt file, extra rows are filled as -1
| Pixel properties | Quadrant properties | ||||||
|---|---|---|---|---|---|---|---|
| Quadrant | DetID | PixID | Counts | Sigma | Mean | Median | Sigma |
| A | 10 | 83 | 262367 | 2044.13 | 640 | 630 | 128.0 |
| A | 15 | 237 | 139896 | 1087.65 | 640 | 630 | 128.0 |
| A | 9 | 143 | 27001 | 205.95 | 640 | 630 | 128.0 |
| B | 5 | 172 | 379257 | 3164.45 | 628 | 614 | 119.7 |
| B | 5 | 200 | 69690 | 577.29 | 628 | 614 | 119.7 |
| B | 5 | 255 | 35893 | 294.84 | 628 | 614 | 119.7 |
| C | 15 | 214 | 218913 | 1548.34 | 610 | 616 | 141.0 |
| C | 0 | 10 | 56850 | 398.86 | 610 | 616 | 141.0 |
| C | 15 | 208 | 29426 | 204.34 | 610 | 616 | 141.0 |
| D | 1 | 52 | 1355831 | 9245.71 | 600 | 584 | 146.6 |
| D | 12 | 233 | 163199 | 1109.39 | 600 | 584 | 146.6 |
| D | 13 | 171 | 152736 | 1038.01 | 600 | 584 | 146.6 |
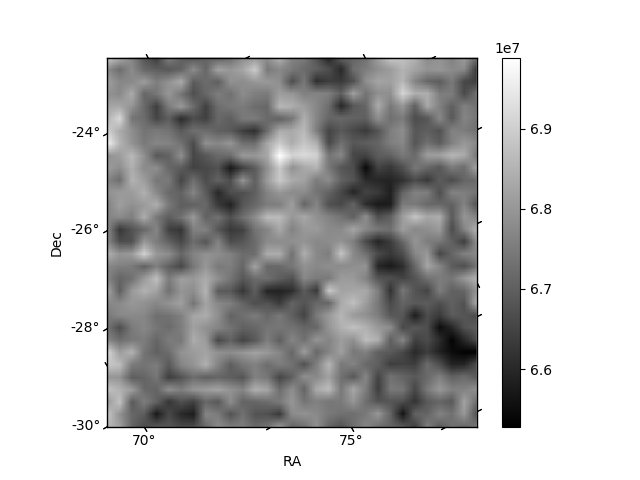
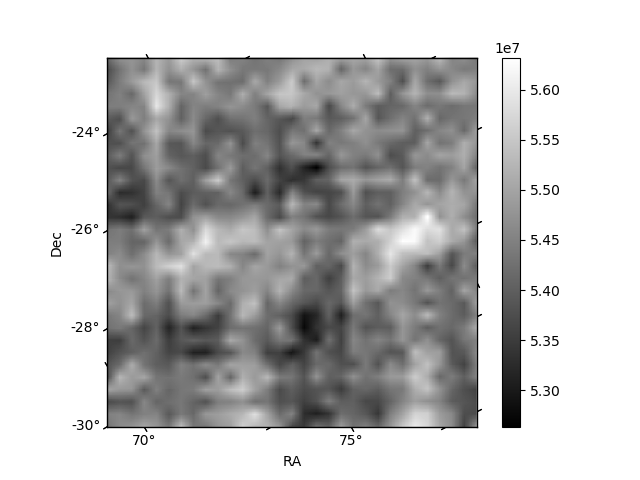
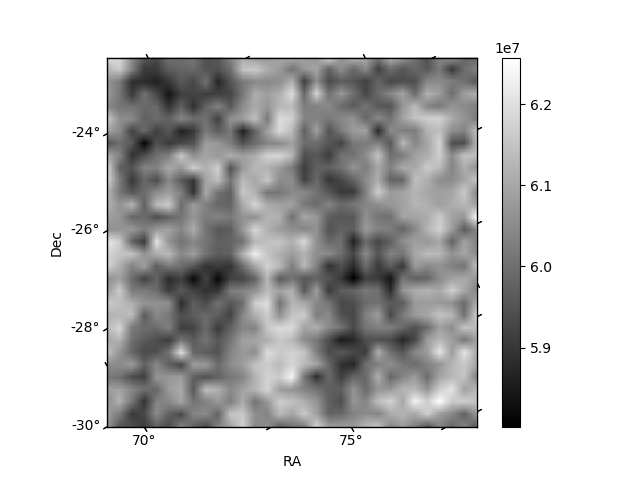
Histogram calculated using DETX and DETY for each event in the final _common_clean file
| Quadrant A | 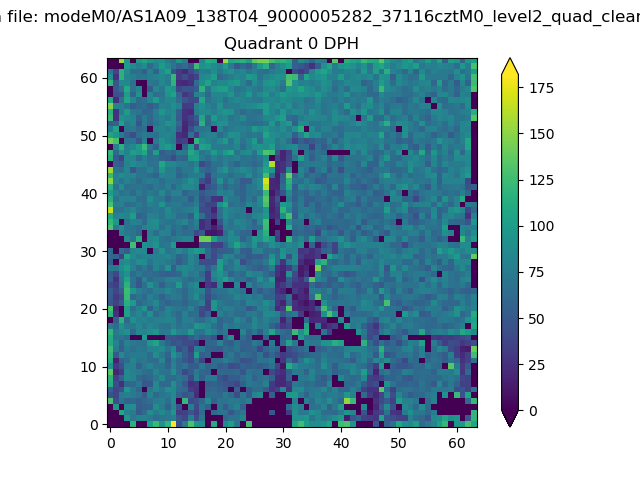 |
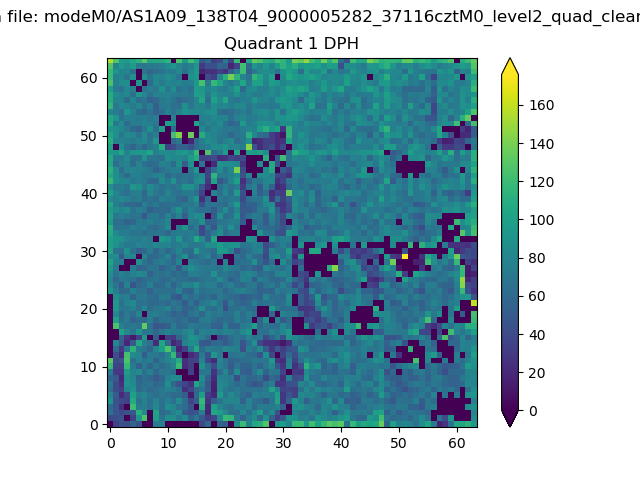 |
Quadrant B |
|---|---|---|---|
| Quadrant D |  |
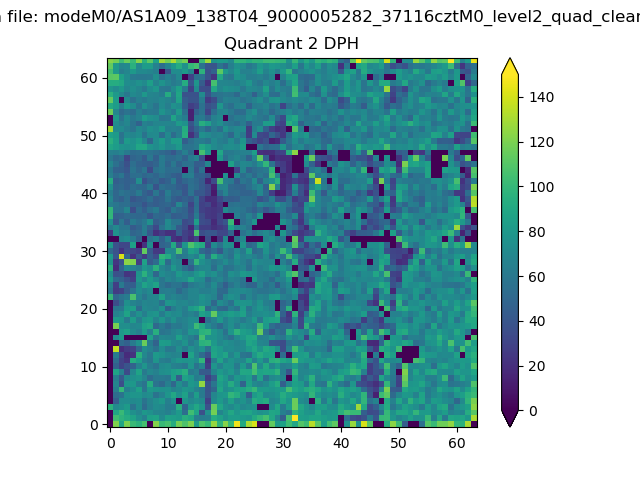 |
Quadrant C |
| Plot type | Count rate plots | Images |
|---|---|---|
| Comparison with Poisson distribution Blue bars denote a histogram of data divided into 1 sec bins. Red curve is a Poisson curve with rate = median count rate of data. |
 |
 |
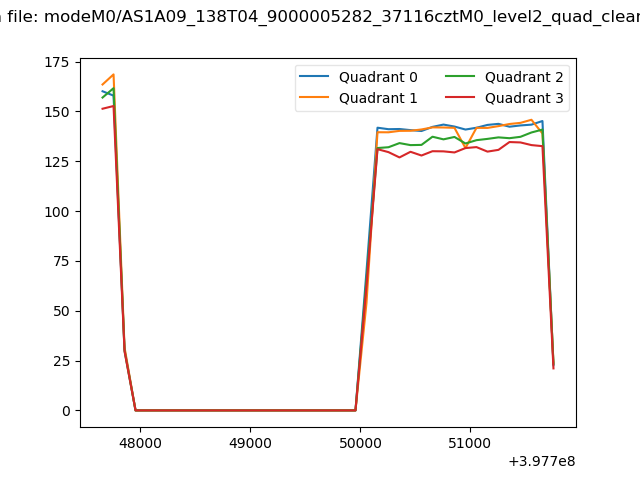
| Quadrant-wise count rates Data is divided into 100 sec bins |
 |
|
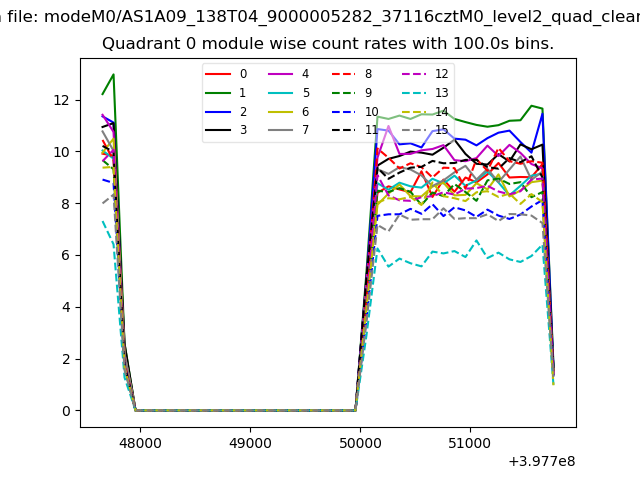
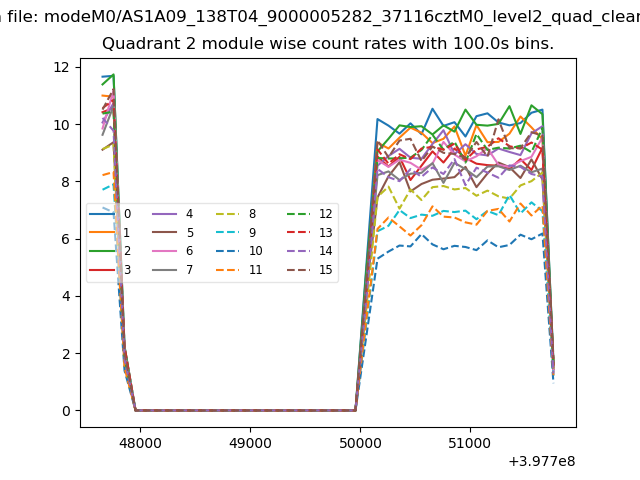
| Module-wise count rates for Quadrant A Data is divided into 100 sec bins |
 |
 |
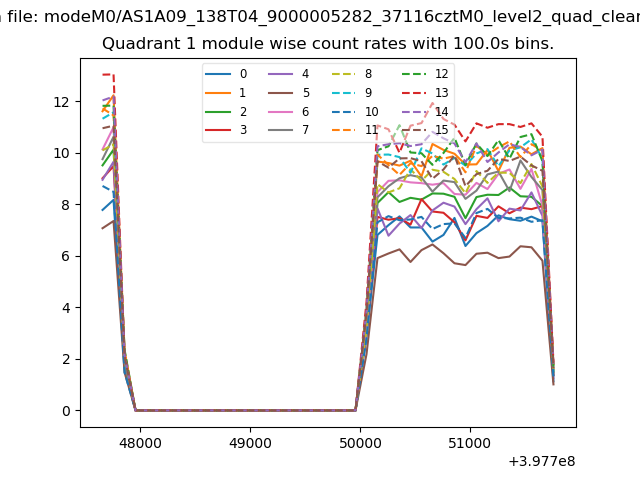
| Module-wise count rates for Quadrant B Data is divided into 100 sec bins |
 |
 |
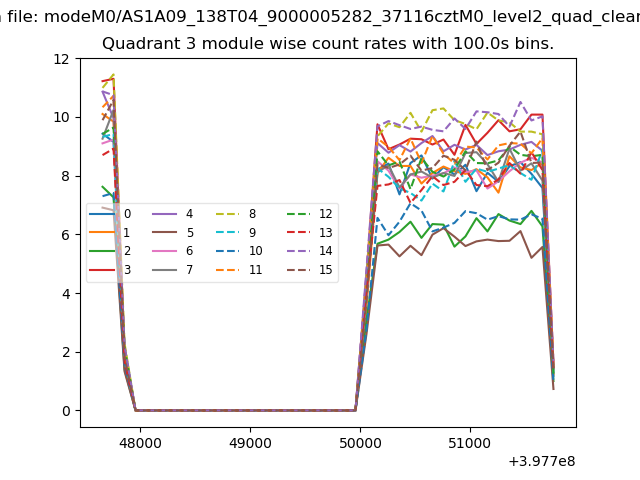
| Module-wise count rates for Quadrant C Data is divided into 100 sec bins |
 |
 |
| Module-wise count rates for Quadrant D Data is divided into 100 sec bins |
 |
 |
| Parameter | Plot |
|---|---|
| CZT HV Monitor | 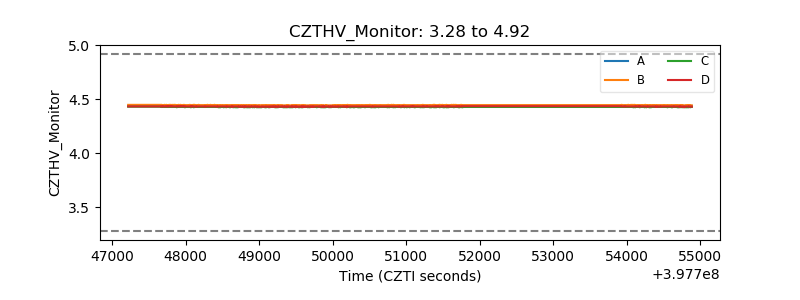 |
| D_VDD | 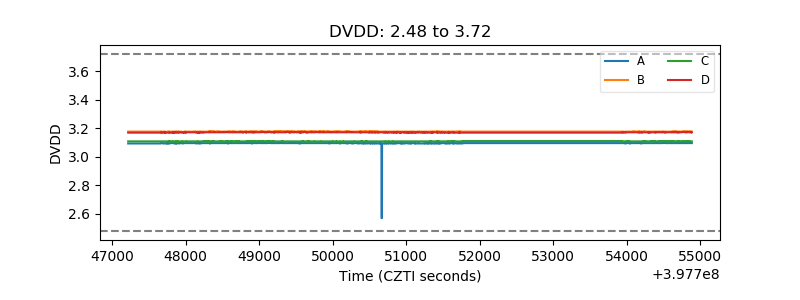 |
| Temperature 1 | 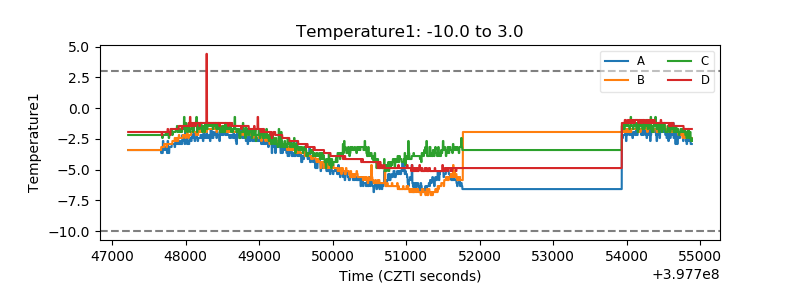 |
| Veto HV Monitor | 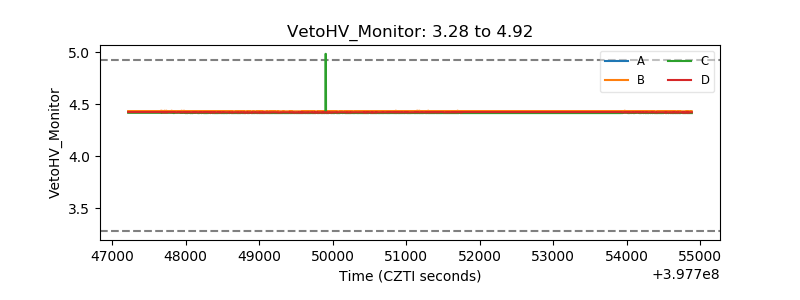 |
| Veto LLD | 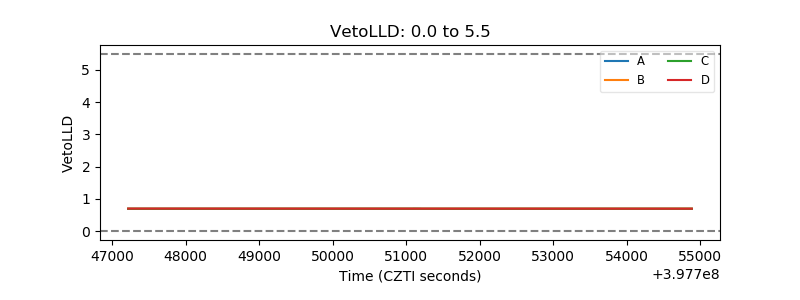 |
| Alpha Counter | 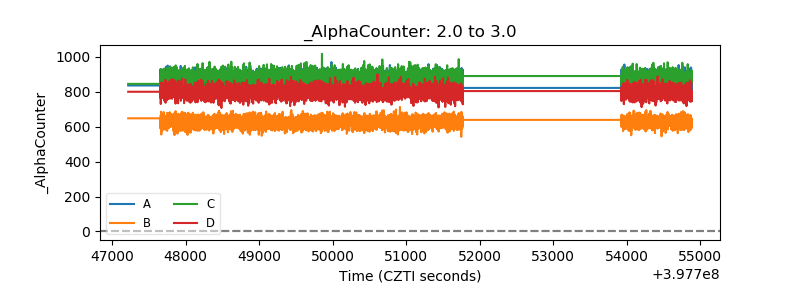 |
| _CPM_Rate | 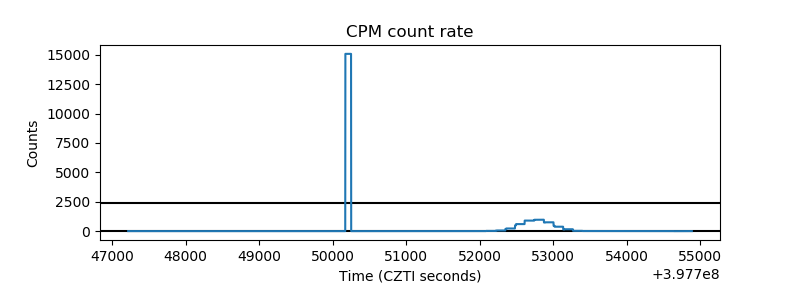 |
| CZT Counter | 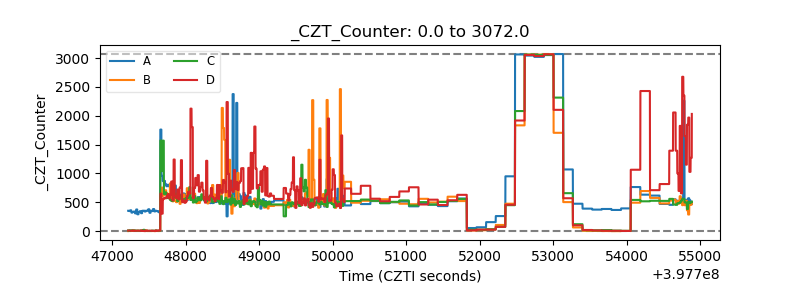 |
| +2.5 Volts monitor | 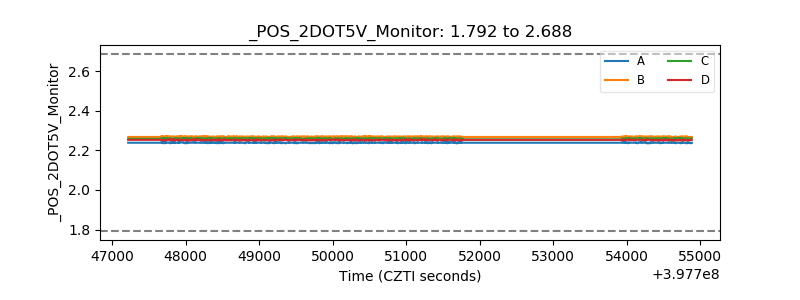 |
| +5 Volts monitor | 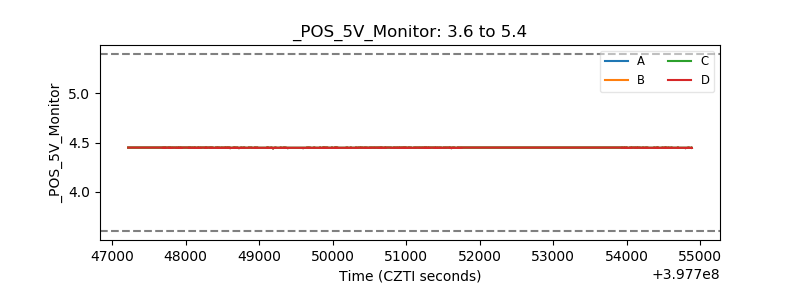 |
| _ROLL_ROT | 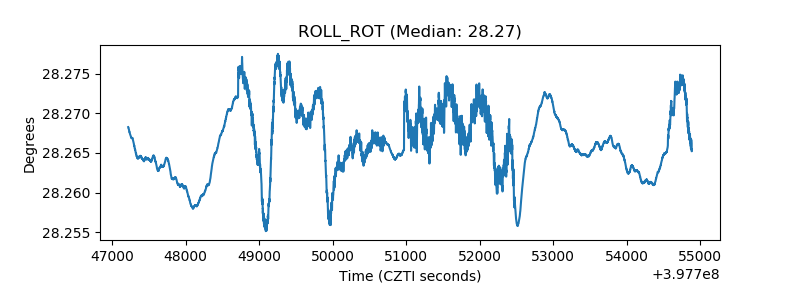 |
| _Roll_DEC | 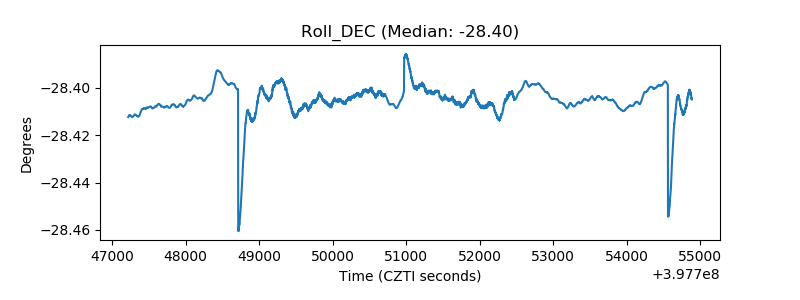 |
| _Roll_RA | 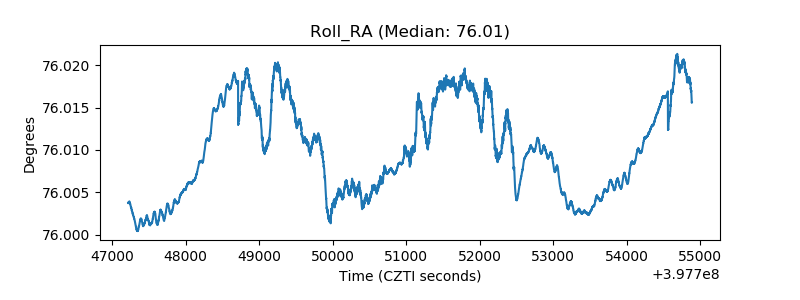 |
| Veto Counter | 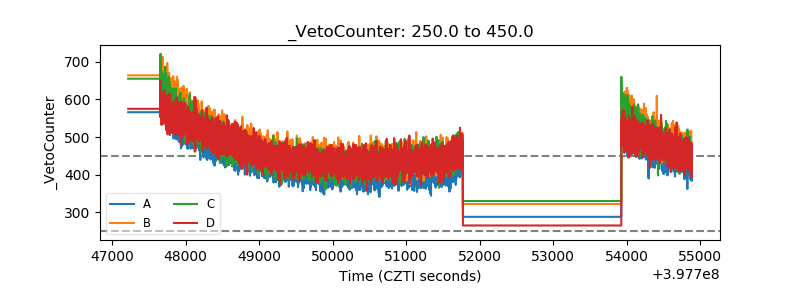 |