| Param | Original file | Final file |
|---|---|---|
| Filename | modeM0/AS1A09_138T04_9000005282_37119cztM0_level2.evt | modeM0/AS1A09_138T04_9000005282_37119cztM0_level2_quad_clean.evt |
| Size (bytes) | 407,427,840 | 72,627,840 |
| Size | 388.6 MB | 69.3 MB |
| Events in quadrant A | 2,809,704 | 468,365 |
| Events in quadrant B | 3,093,811 | 458,236 |
| Events in quadrant C | 2,904,249 | 450,105 |
| Events in quadrant D | 3,152,482 | 432,865 |
| Mode SS | |||
|---|---|---|---|
| Quadrant | BADHDUFLAG | Total packets | Discarded packets |
| A | 0 | 114 | 0 |
| B | 0 | 114 | 0 |
| C | 0 | 114 | 0 |
| D | 0 | 114 | 0 |
| Mode M0 | |||
|---|---|---|---|
| Quadrant | BADHDUFLAG | Total packets | Discarded packets |
| A | 0 | 11855 | 3 |
| B | 0 | 12794 | 2 |
| C | 0 | 11956 | 2 |
| D | 0 | 13216 | 2 |
| Mode M9 | |||
|---|---|---|---|
| Quadrant | BADHDUFLAG | Total packets | Discarded packets |
| A | 0 | 18 | 0 |
| B | 0 | 18 | 0 |
| C | 0 | 18 | 0 |
| D | 0 | 19 | 0 |
| Quadrant | Total seconds | Saturated seconds | Saturation percentage |
|---|---|---|---|
| A | 5567 | 21 | 0.377223% |
| B | 5567 | 134 | 2.407041% |
| C | 5567 | 64 | 1.149632% |
| D | 5567 | 99 | 1.778337% |
Noise dominated data is calculated using 1-second bins in cleaned event files. If a bin has >2000 counts, and if more than 50% of those come from <1% of pixels, then it is considered to be noise-dominated and hence unusable.
| Quadrant | # 1 sec bins | Bins with >0 counts | Bins with >2000 counts | High rate bins dominated by noise | Noise dominated (total time) | Noise dominated (detector-on time) | Marked lightcurve |
|---|---|---|---|---|---|---|---|
| A | 7120 | 5568 | 13 | 13 | 0.18% | 0.23% | 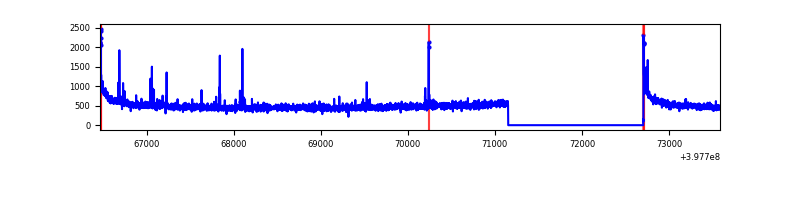 |
| B | 7120 | 5568 | 108 | 108 | 1.52% | 1.94% | 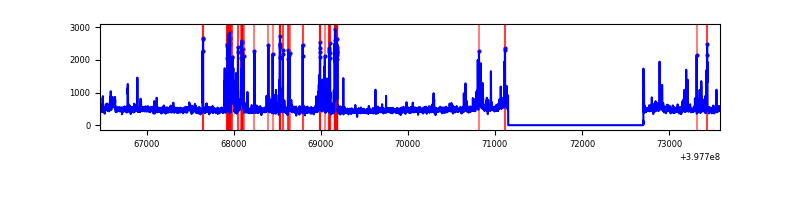 |
| C | 7120 | 5568 | 51 | 51 | 0.72% | 0.92% | 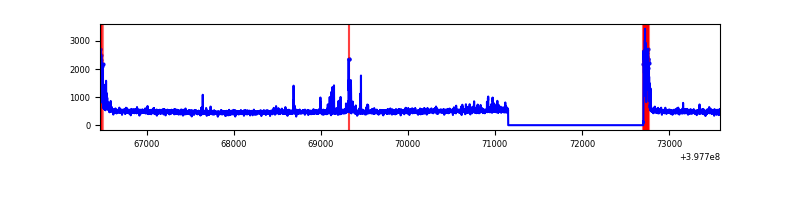 |
| D | 7120 | 5568 | 104 | 104 | 1.46% | 1.87% | 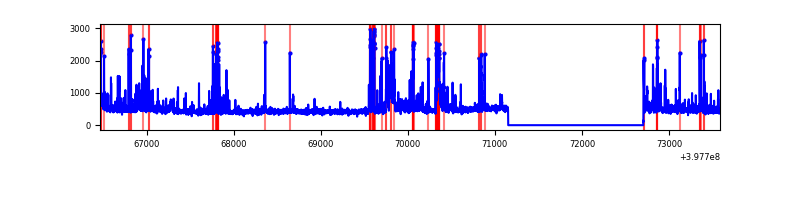 |
Top three noisy pixels from each quadrant. If the there are fewer than three noisy pixels in the level2.evt file, extra rows are filled as -1
| Pixel properties | Quadrant properties | ||||||
|---|---|---|---|---|---|---|---|
| Quadrant | DetID | PixID | Counts | Sigma | Mean | Median | Sigma |
| A | 10 | 83 | 274525 | 2123.63 | 639 | 626 | 129.0 |
| A | 9 | 143 | 53201 | 407.63 | 639 | 626 | 129.0 |
| A | 13 | 254 | 8403 | 60.3 | 639 | 626 | 129.0 |
| B | 5 | 172 | 460779 | 3746.84 | 631 | 613 | 122.8 |
| B | 0 | 182 | 36770 | 294.4 | 631 | 613 | 122.8 |
| B | 5 | 255 | 26206 | 208.39 | 631 | 613 | 122.8 |
| C | 15 | 214 | 237017 | 1630.25 | 616 | 620 | 145.0 |
| C | 0 | 10 | 186054 | 1278.8 | 616 | 620 | 145.0 |
| C | 15 | 159 | 31601 | 213.65 | 616 | 620 | 145.0 |
| D | 12 | 17 | 280919 | 1841.31 | 618 | 602 | 152.2 |
| D | 13 | 249 | 126767 | 828.73 | 618 | 602 | 152.2 |
| D | 12 | 233 | 120984 | 790.75 | 618 | 602 | 152.2 |
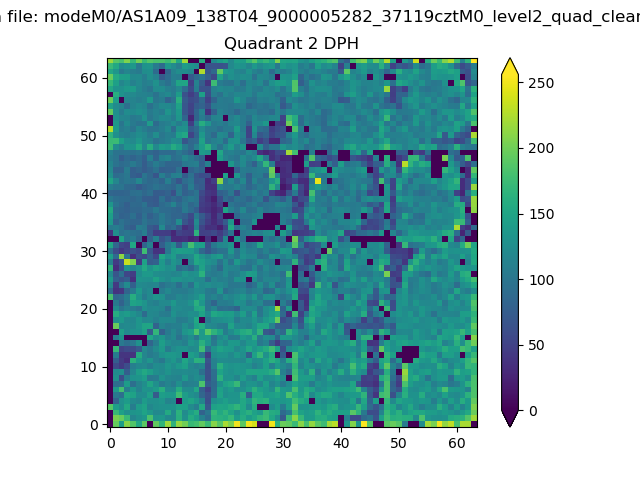
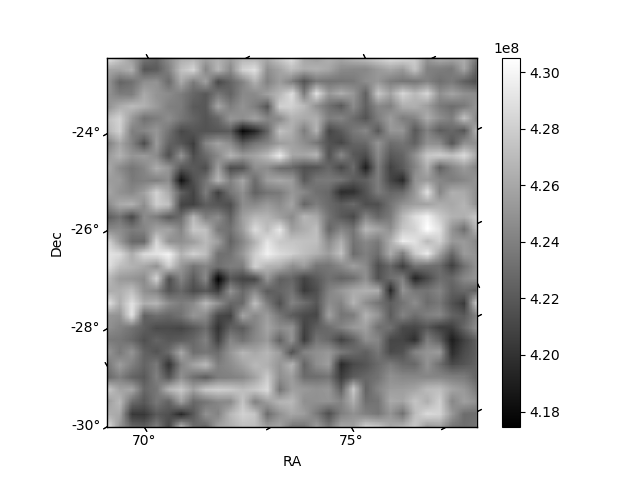
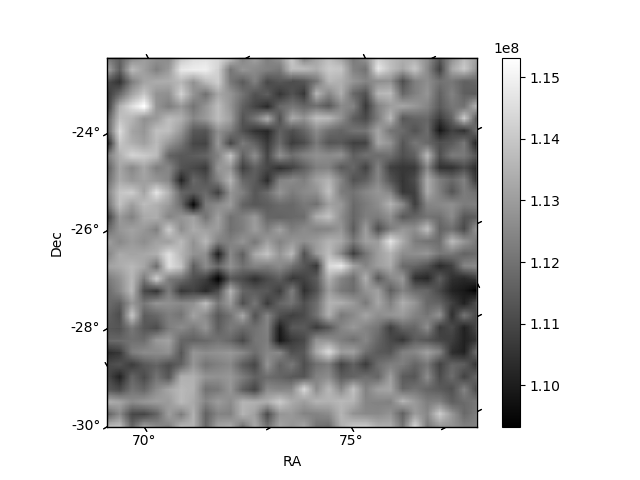
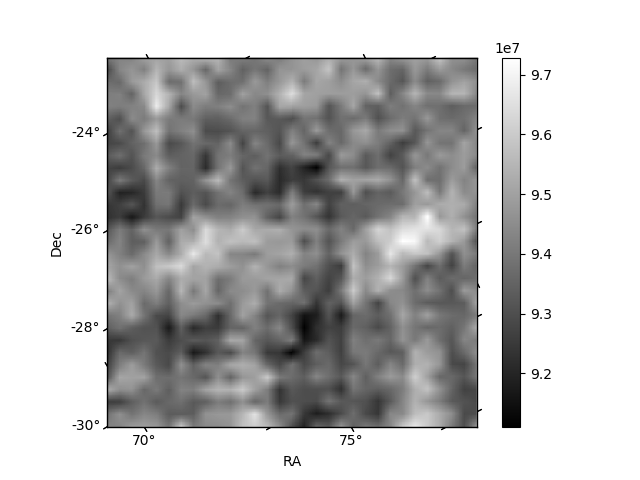
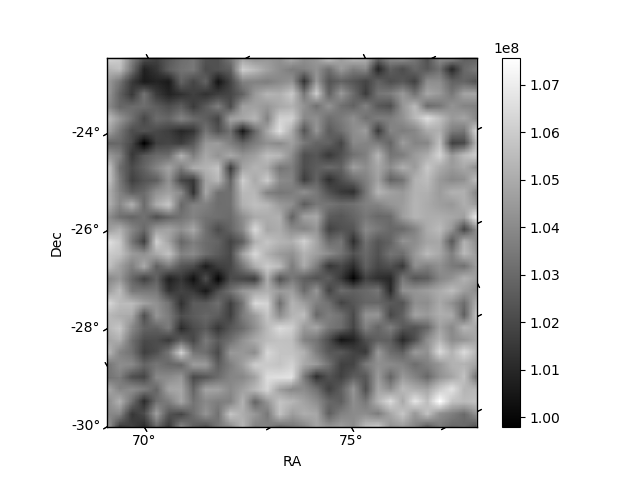
Histogram calculated using DETX and DETY for each event in the final _common_clean file
| Quadrant A | 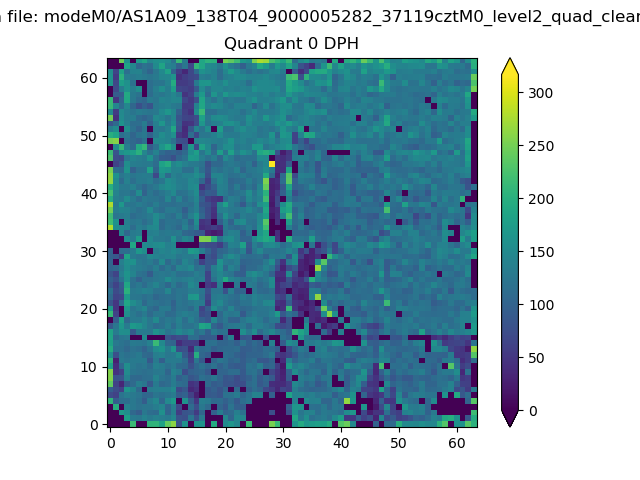 |
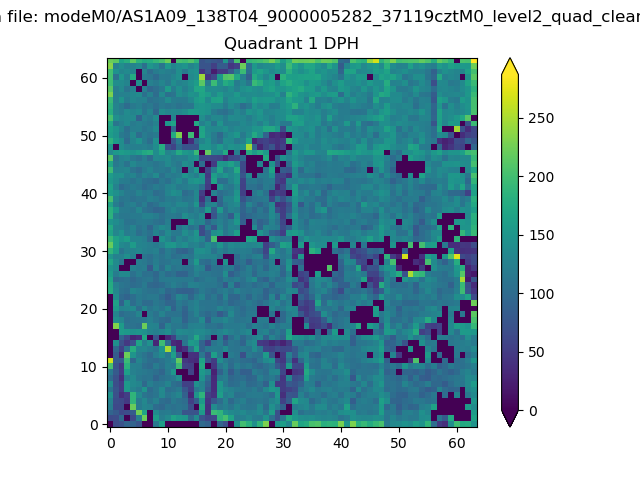 |
Quadrant B |
|---|---|---|---|
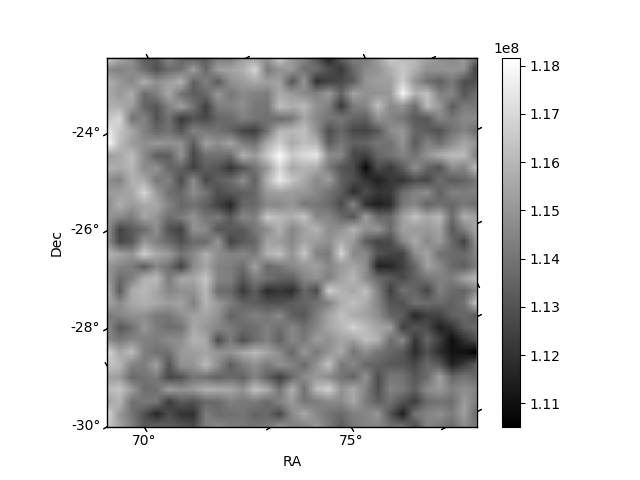
| Quadrant D | 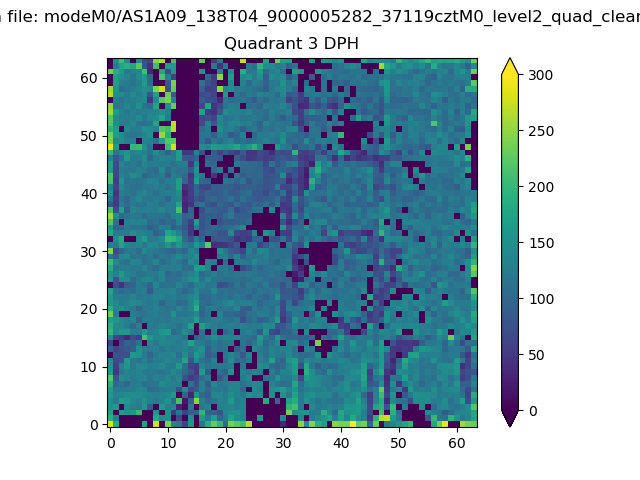 |
 |
Quadrant C |
| Plot type | Count rate plots | Images |
|---|---|---|
| Comparison with Poisson distribution Blue bars denote a histogram of data divided into 1 sec bins. Red curve is a Poisson curve with rate = median count rate of data. |
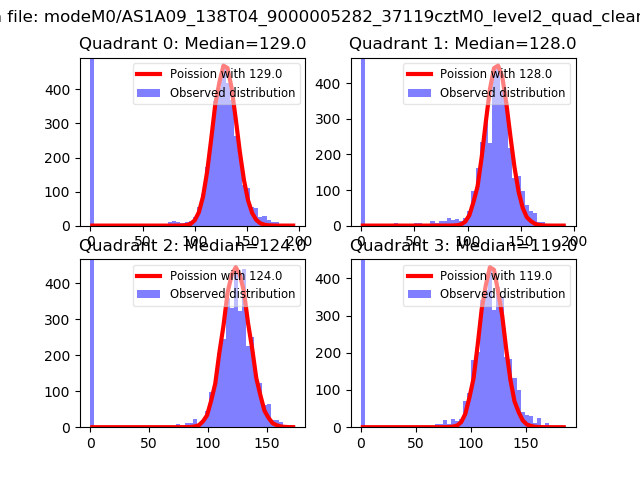 |
 |
| Quadrant-wise count rates Data is divided into 100 sec bins |
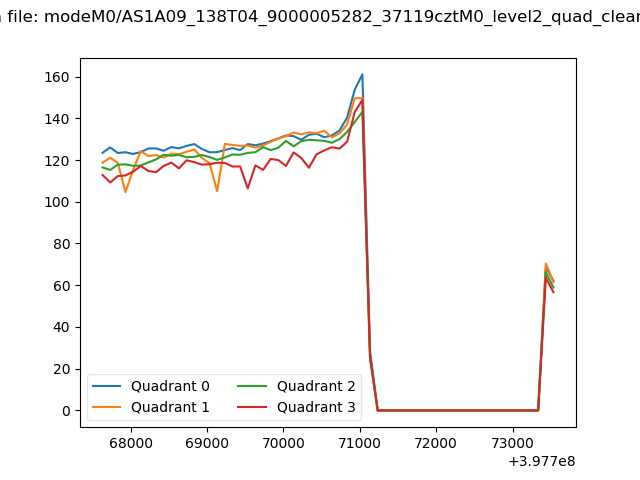 |
|
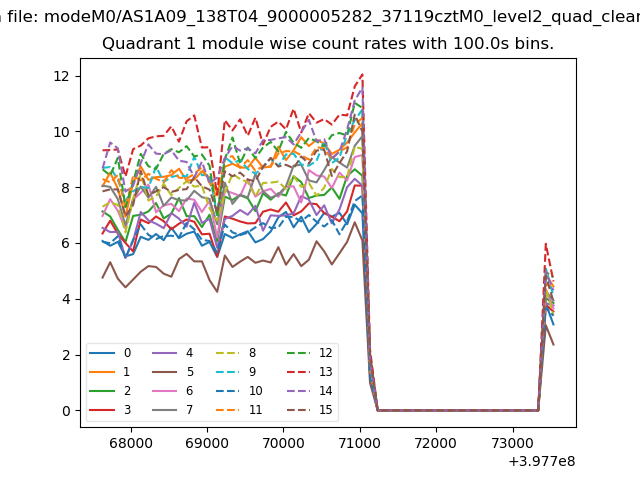
| Module-wise count rates for Quadrant A Data is divided into 100 sec bins |
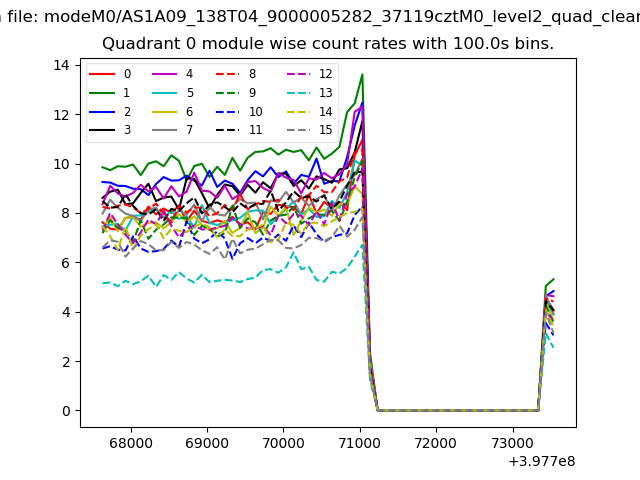 |
 |
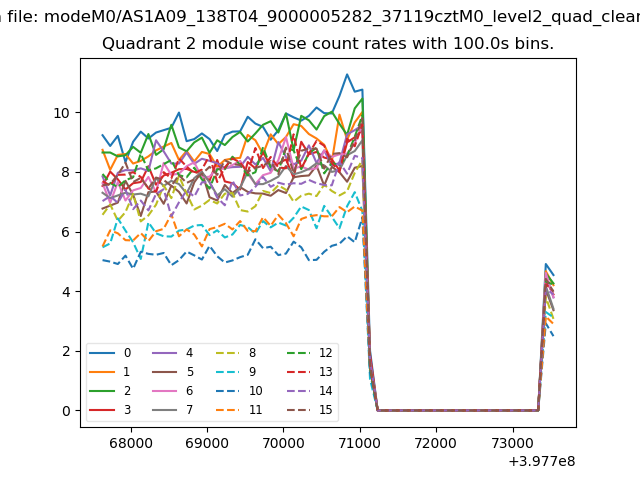
| Module-wise count rates for Quadrant B Data is divided into 100 sec bins |
 |
 |
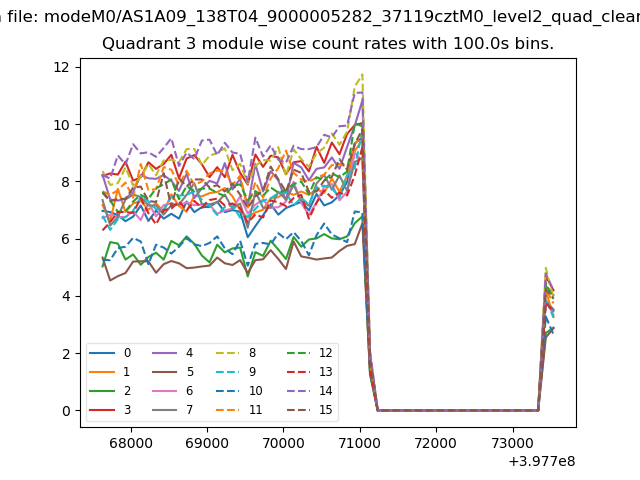
| Module-wise count rates for Quadrant C Data is divided into 100 sec bins |
 |
 |
| Module-wise count rates for Quadrant D Data is divided into 100 sec bins |
 |
 |
| Parameter | Plot |
|---|---|
| CZT HV Monitor | 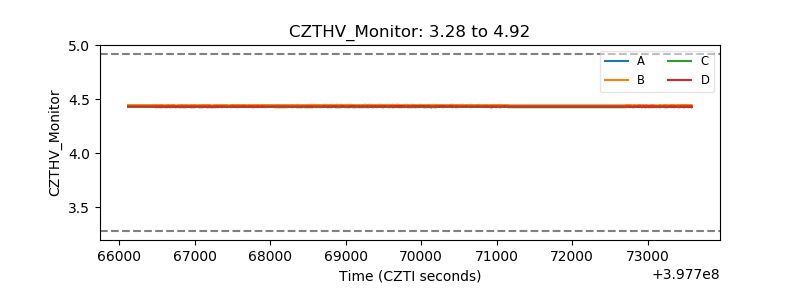 |
| D_VDD | 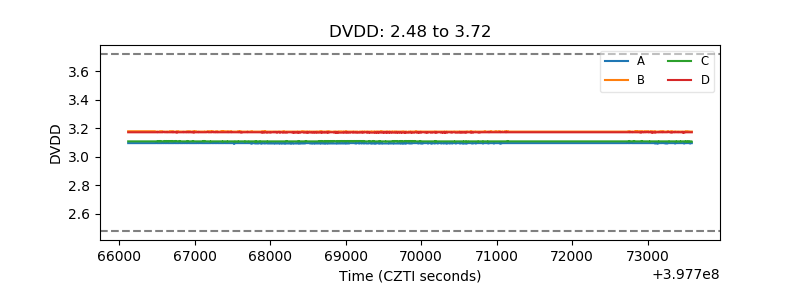 |
| Temperature 1 | 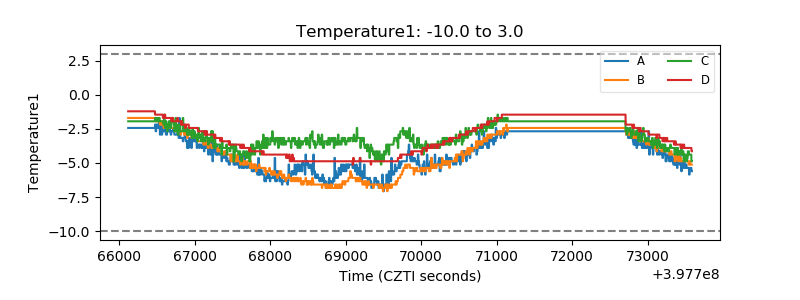 |
| Veto HV Monitor | 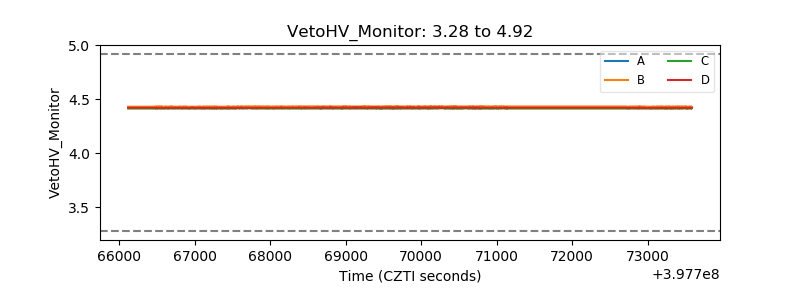 |
| Veto LLD | 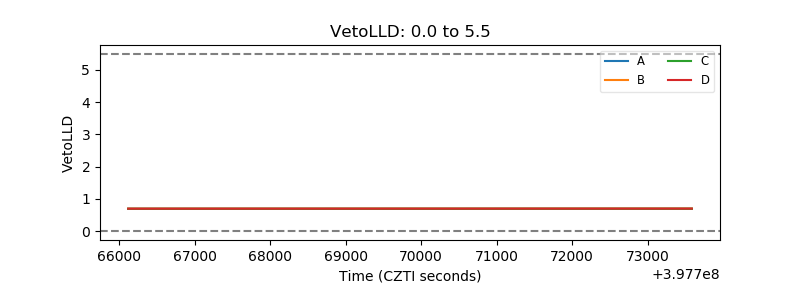 |
| Alpha Counter | 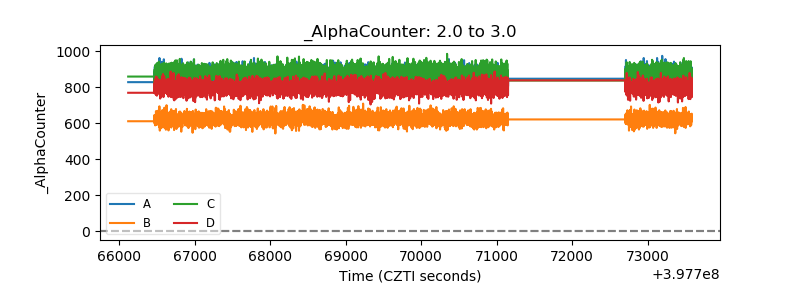 |
| _CPM_Rate | 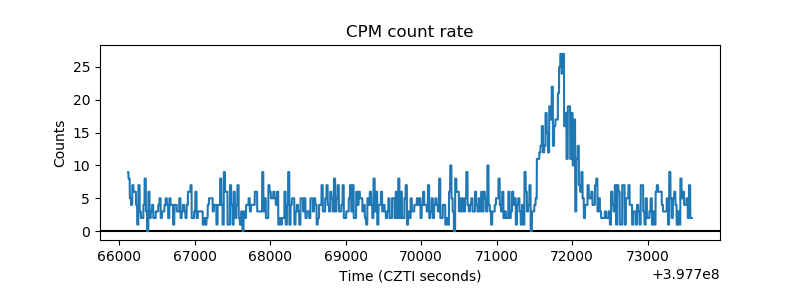 |
| CZT Counter | 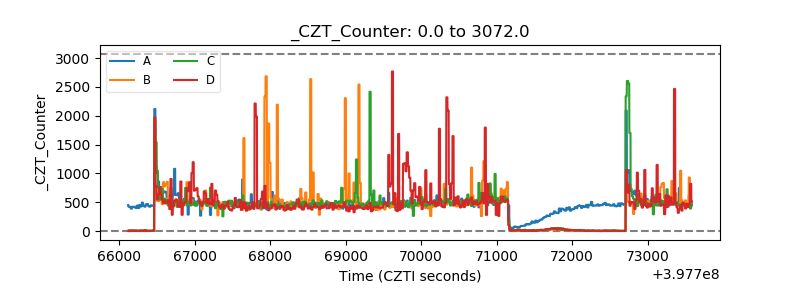 |
| +2.5 Volts monitor | 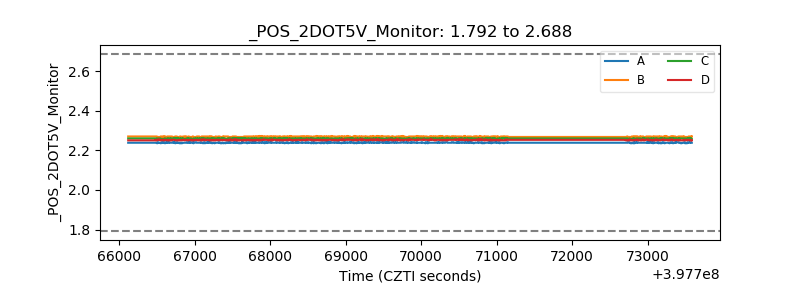 |
| +5 Volts monitor | 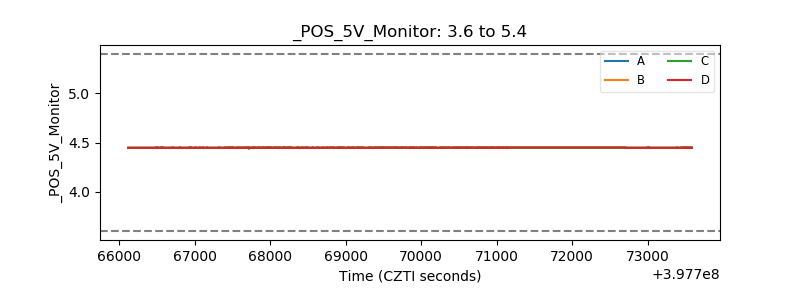 |
| _ROLL_ROT | 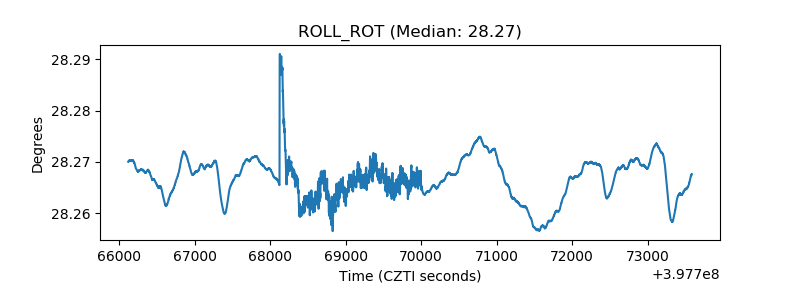 |
| _Roll_DEC | 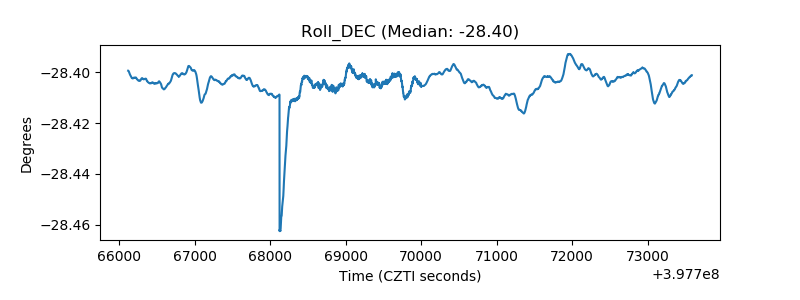 |
| _Roll_RA | 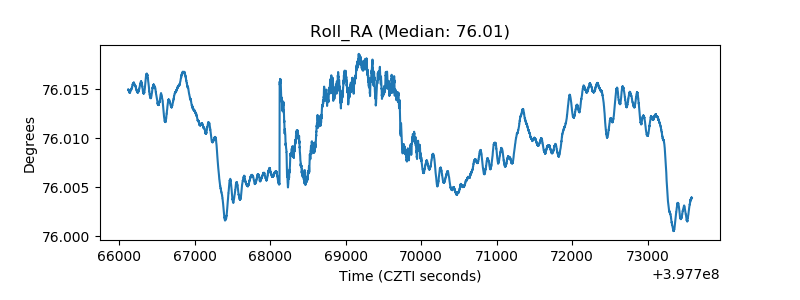 |
| Veto Counter | 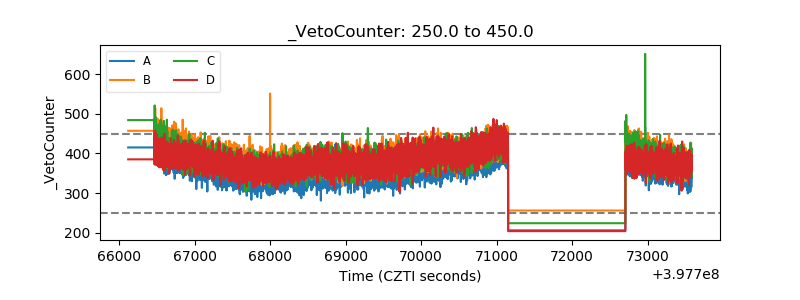 |