| Param | Original file | Final file |
|---|---|---|
| Filename | modeM0/AS1A09_138T04_9000005282_37120cztM0_level2.evt | modeM0/AS1A09_138T04_9000005282_37120cztM0_level2_quad_clean.evt |
| Size (bytes) | 443,989,440 | 79,885,440 |
| Size | 423.4 MB | 76.2 MB |
| Events in quadrant A | 3,198,880 | 506,236 |
| Events in quadrant B | 3,453,189 | 513,360 |
| Events in quadrant C | 3,419,728 | 500,745 |
| Events in quadrant D | 2,975,869 | 488,855 |
| Mode SS | |||
|---|---|---|---|
| Quadrant | BADHDUFLAG | Total packets | Discarded packets |
| A | 0 | 120 | 0 |
| B | 0 | 120 | 0 |
| C | 0 | 120 | 0 |
| D | 0 | 120 | 0 |
| Mode M0 | |||
|---|---|---|---|
| Quadrant | BADHDUFLAG | Total packets | Discarded packets |
| A | 0 | 13266 | 3 |
| B | 0 | 14089 | 2 |
| C | 0 | 13759 | 2 |
| D | 0 | 12913 | 2 |
| Mode M9 | |||
|---|---|---|---|
| Quadrant | BADHDUFLAG | Total packets | Discarded packets |
| A | 0 | 18 | 0 |
| B | 0 | 18 | 0 |
| C | 0 | 18 | 0 |
| D | 0 | 19 | 0 |
| Quadrant | Total seconds | Saturated seconds | Saturation percentage |
|---|---|---|---|
| A | 5861 | 146 | 2.491042% |
| B | 5861 | 191 | 3.258830% |
| C | 5861 | 170 | 2.900529% |
| D | 5861 | 65 | 1.109026% |
Noise dominated data is calculated using 1-second bins in cleaned event files. If a bin has >2000 counts, and if more than 50% of those come from <1% of pixels, then it is considered to be noise-dominated and hence unusable.
| Quadrant | # 1 sec bins | Bins with >0 counts | Bins with >2000 counts | High rate bins dominated by noise | Noise dominated (total time) | Noise dominated (detector-on time) | Marked lightcurve |
|---|---|---|---|---|---|---|---|
| A | 7204 | 5862 | 82 | 82 | 1.14% | 1.40% |  |
| B | 7204 | 5862 | 135 | 135 | 1.87% | 2.30% | 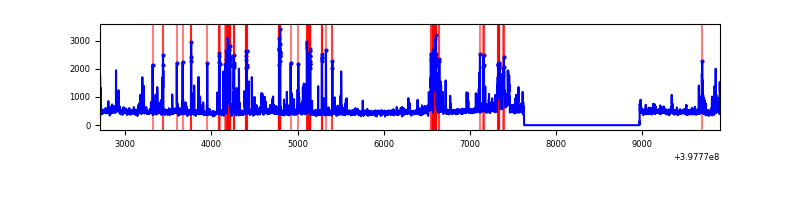 |
| C | 7204 | 5862 | 143 | 143 | 1.99% | 2.44% | 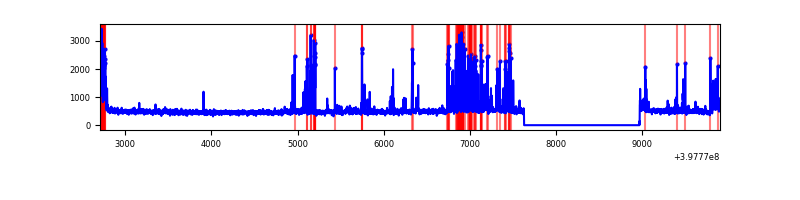 |
| D | 7204 | 5862 | 54 | 54 | 0.75% | 0.92% |  |
Top three noisy pixels from each quadrant. If the there are fewer than three noisy pixels in the level2.evt file, extra rows are filled as -1
| Pixel properties | Quadrant properties | ||||||
|---|---|---|---|---|---|---|---|
| Quadrant | DetID | PixID | Counts | Sigma | Mean | Median | Sigma |
| A | 10 | 83 | 271848 | 2039.32 | 656 | 643 | 133.0 |
| A | 15 | 237 | 260308 | 1952.54 | 656 | 643 | 133.0 |
| A | 9 | 143 | 95317 | 711.9 | 656 | 643 | 133.0 |
| B | 5 | 172 | 543958 | 4268.26 | 658 | 639 | 127.3 |
| B | 5 | 184 | 168172 | 1316.12 | 658 | 639 | 127.3 |
| B | 5 | 200 | 69113 | 537.93 | 658 | 639 | 127.3 |
| C | 0 | 10 | 497643 | 3317.67 | 642 | 647 | 149.8 |
| C | 15 | 214 | 245033 | 1631.38 | 642 | 647 | 149.8 |
| C | 14 | 254 | 138050 | 917.23 | 642 | 647 | 149.8 |
| D | 13 | 249 | 125646 | 780.64 | 649 | 631 | 160.1 |
| D | 13 | 171 | 110208 | 684.24 | 649 | 631 | 160.1 |
| D | 12 | 233 | 55364 | 341.77 | 649 | 631 | 160.1 |
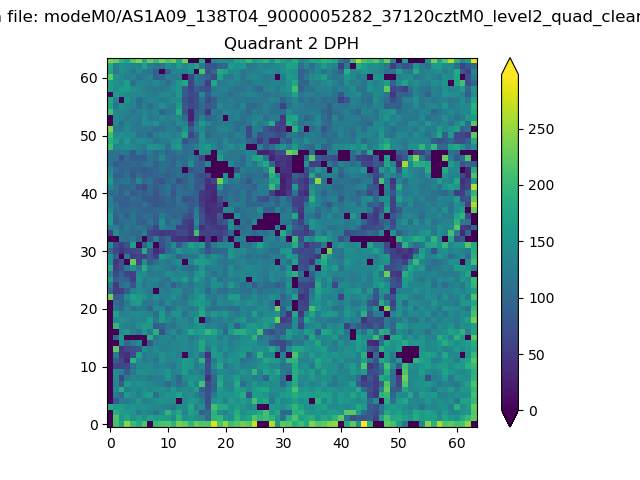
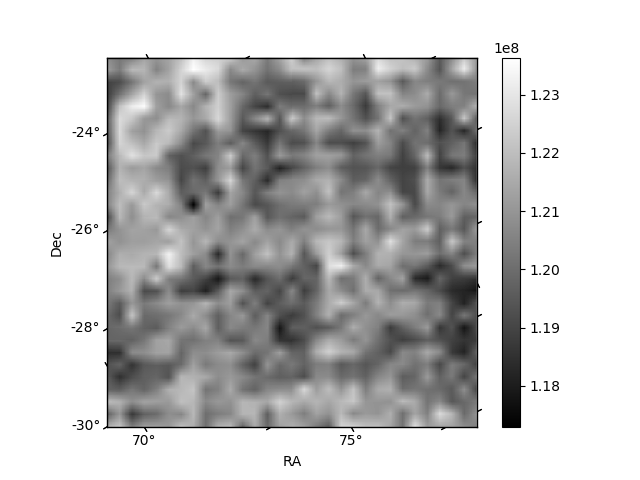
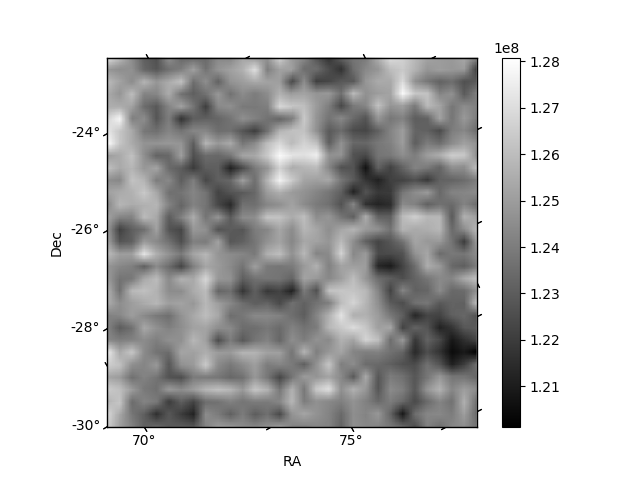
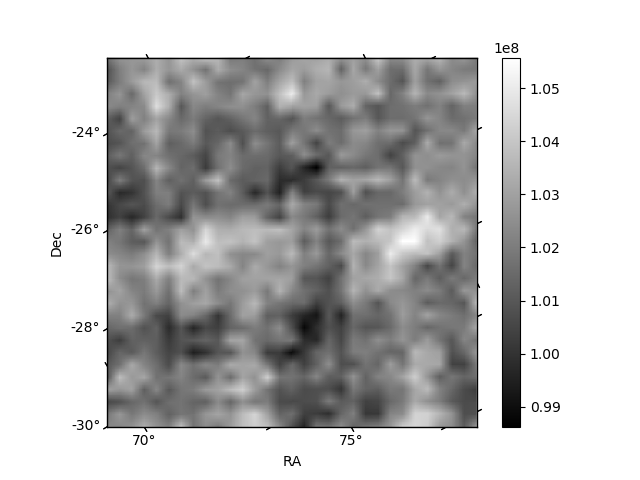
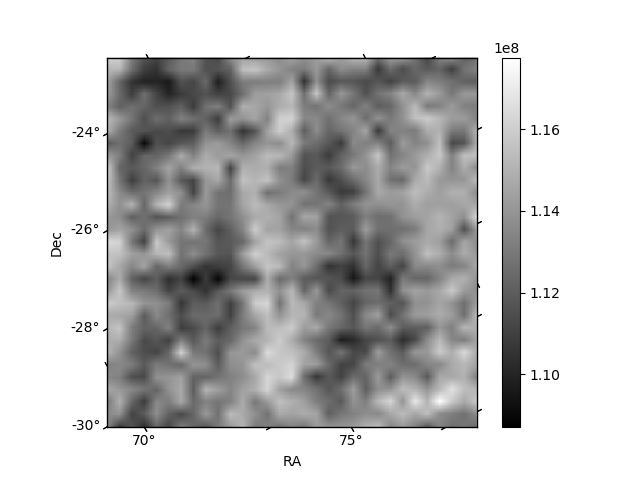
Histogram calculated using DETX and DETY for each event in the final _common_clean file
| Quadrant A | 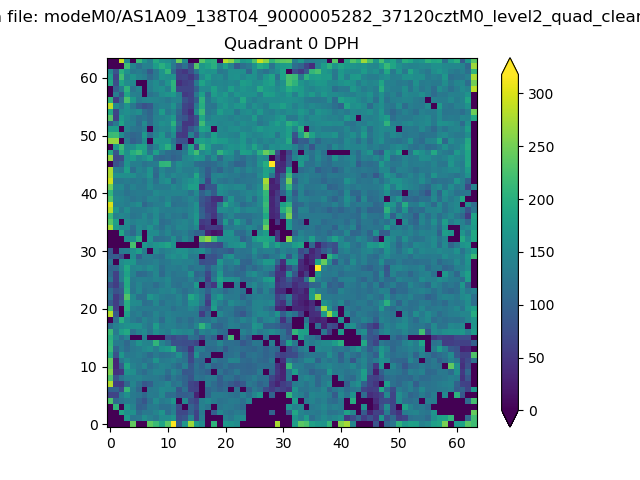 |
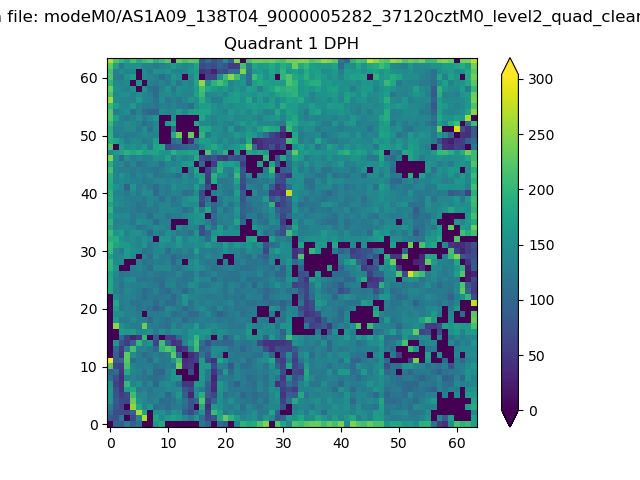 |
Quadrant B |
|---|---|---|---|
| Quadrant D | 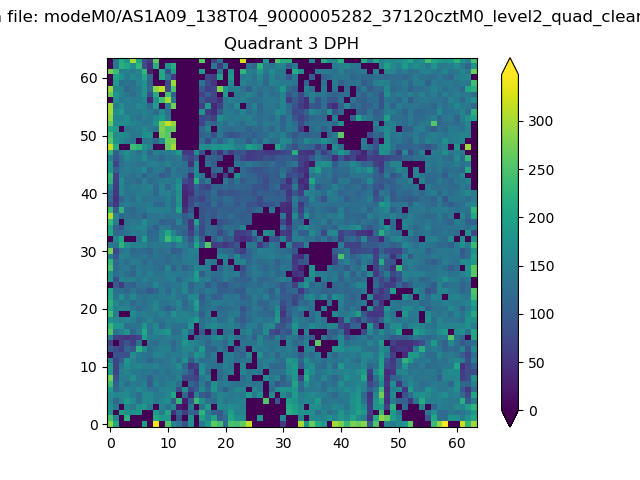 |
 |
Quadrant C |
| Plot type | Count rate plots | Images |
|---|---|---|
| Comparison with Poisson distribution Blue bars denote a histogram of data divided into 1 sec bins. Red curve is a Poisson curve with rate = median count rate of data. |
 |
 |
| Quadrant-wise count rates Data is divided into 100 sec bins |
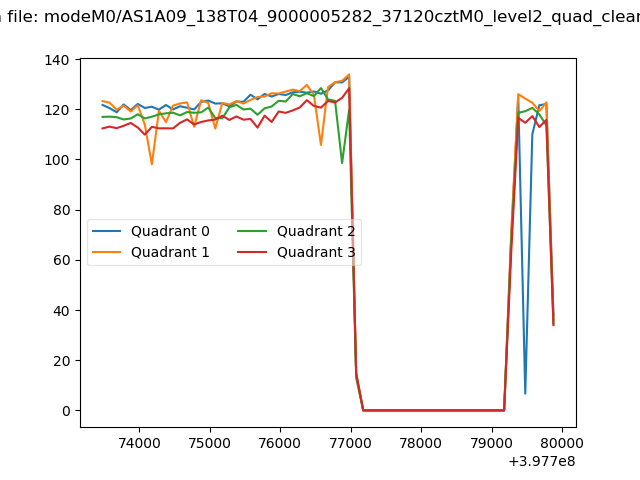 |
|
| Module-wise count rates for Quadrant A Data is divided into 100 sec bins |
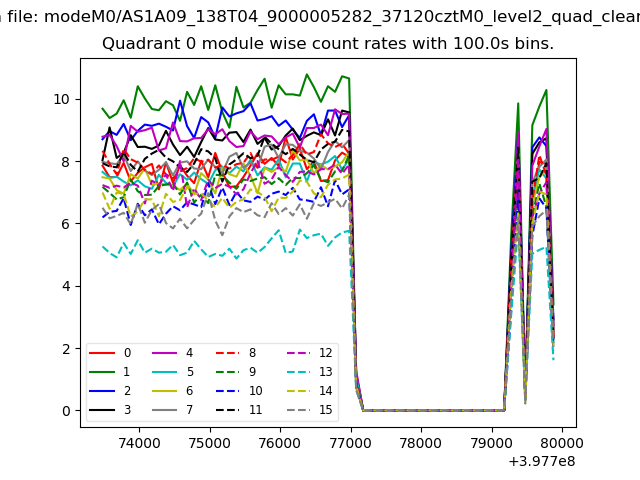 |
 |
| Module-wise count rates for Quadrant B Data is divided into 100 sec bins |
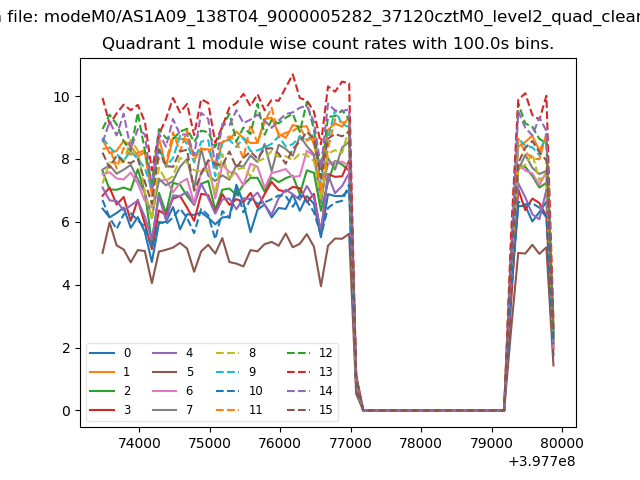 |
 |
| Module-wise count rates for Quadrant C Data is divided into 100 sec bins |
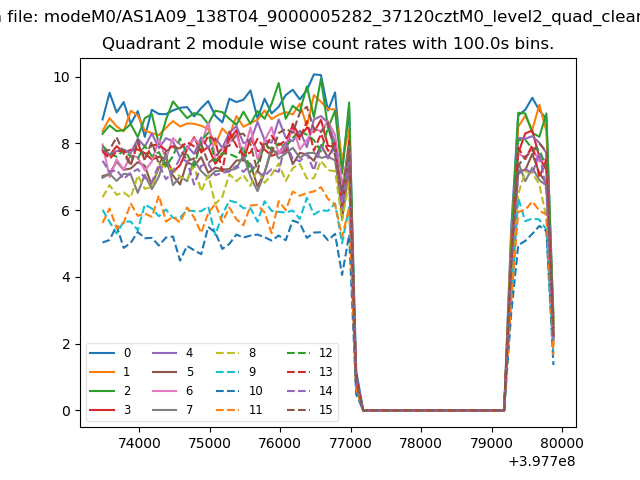 |
 |
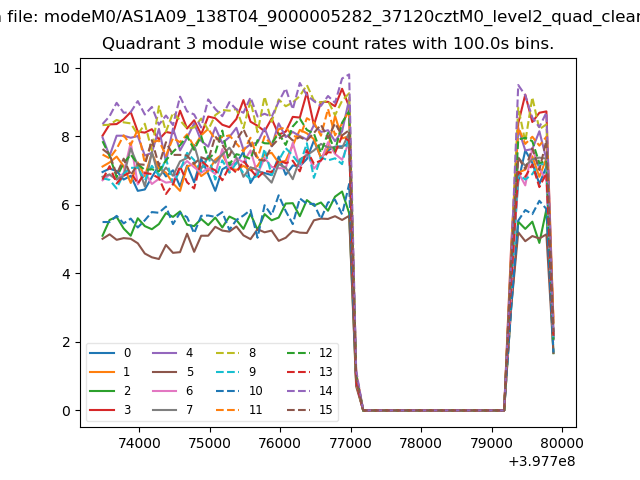
| Module-wise count rates for Quadrant D Data is divided into 100 sec bins |
 |
 |
| Parameter | Plot |
|---|---|
| CZT HV Monitor | 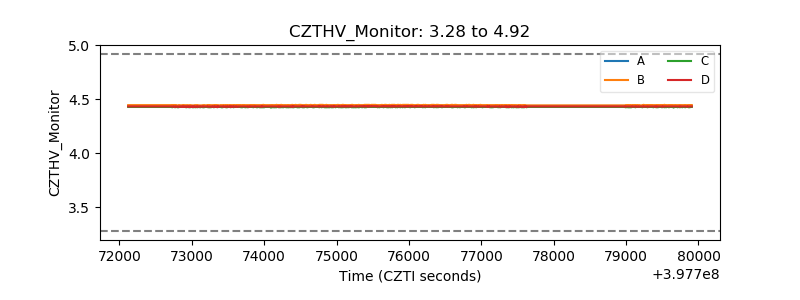 |
| D_VDD | 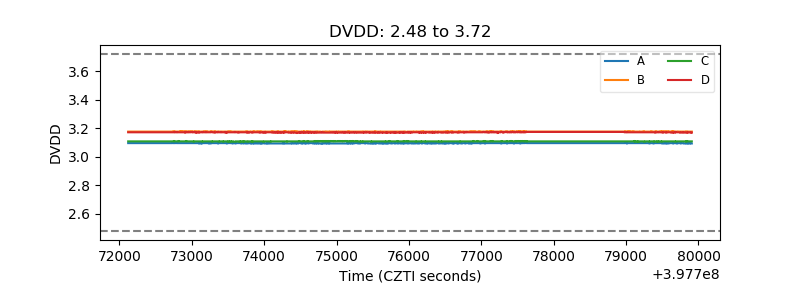 |
| Temperature 1 | 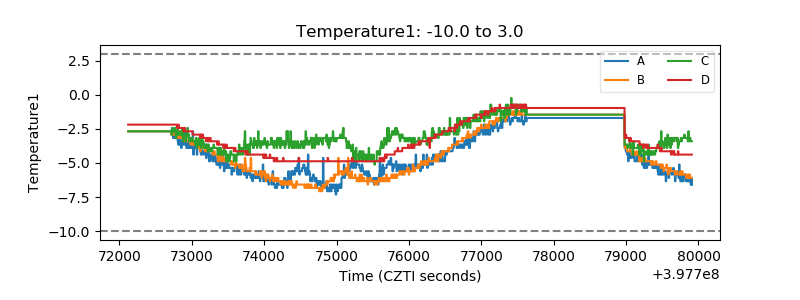 |
| Veto HV Monitor | 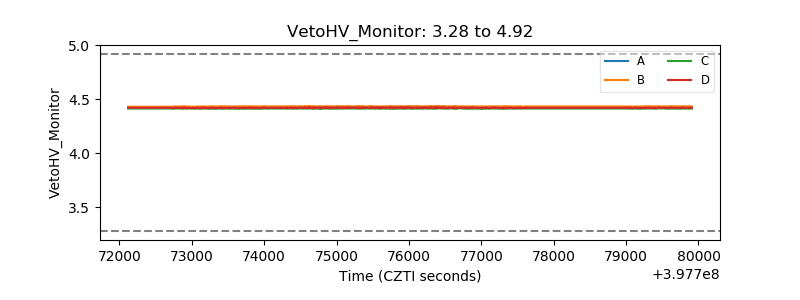 |
| Veto LLD | 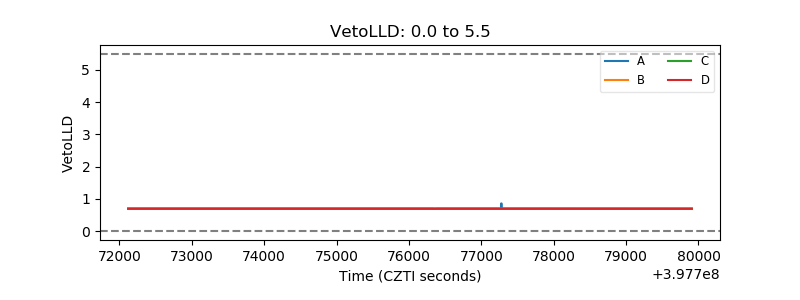 |
| Alpha Counter | 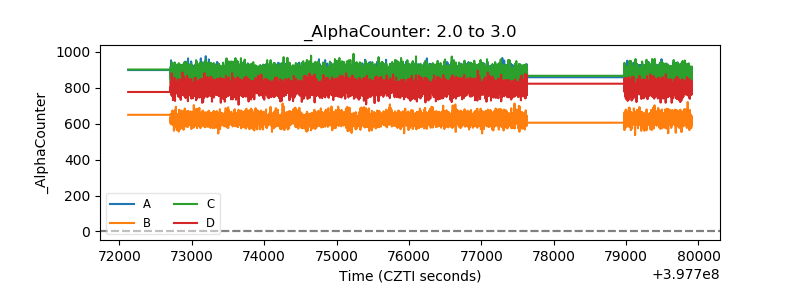 |
| _CPM_Rate | 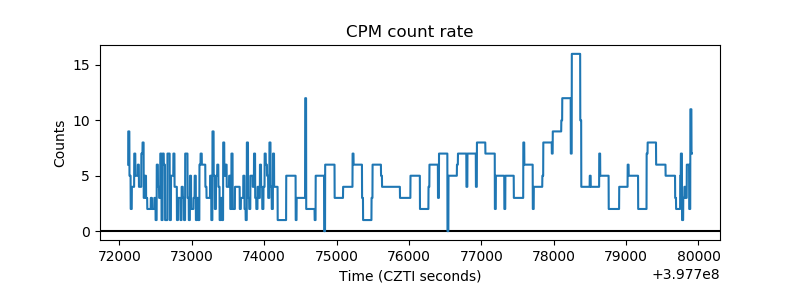 |
| CZT Counter | 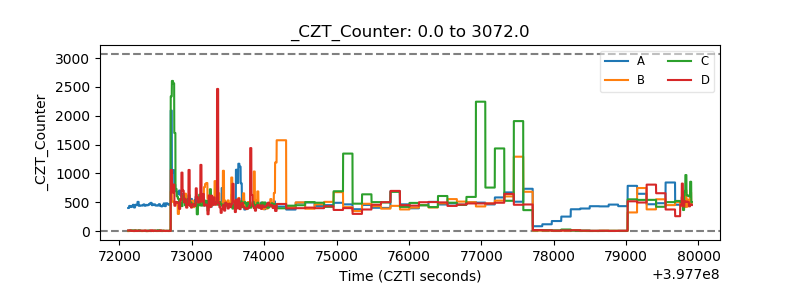 |
| +2.5 Volts monitor | 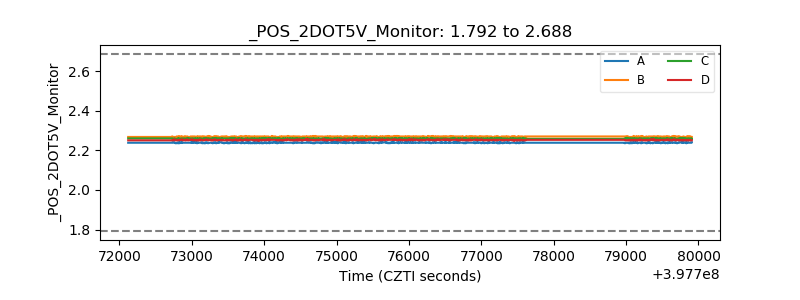 |
| +5 Volts monitor | 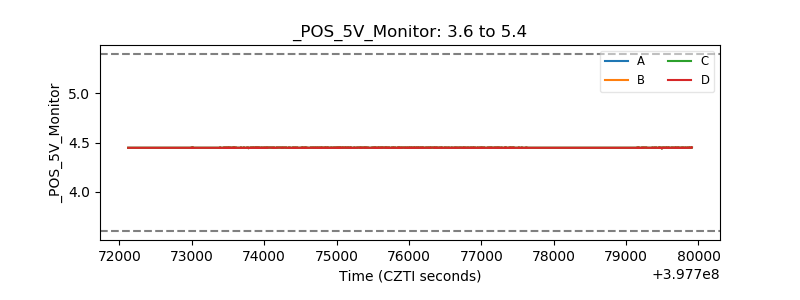 |
| _ROLL_ROT | 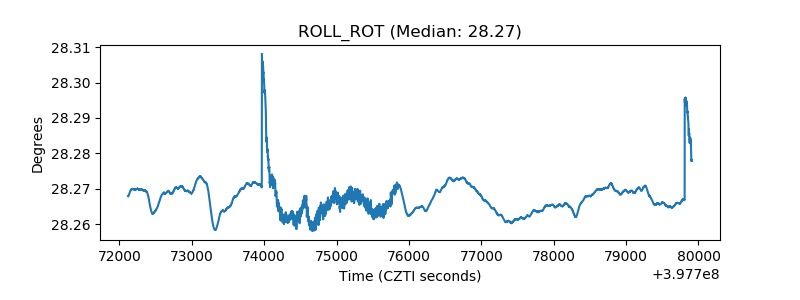 |
| _Roll_DEC | 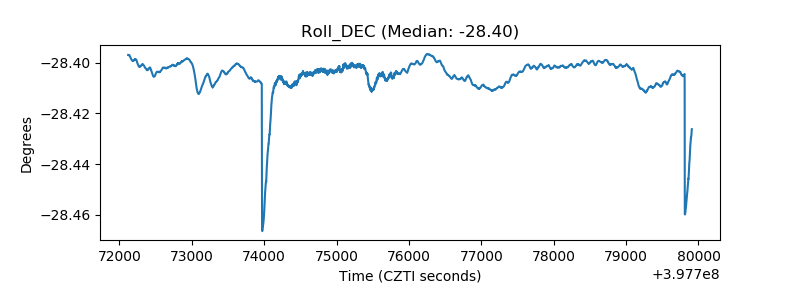 |
| _Roll_RA | 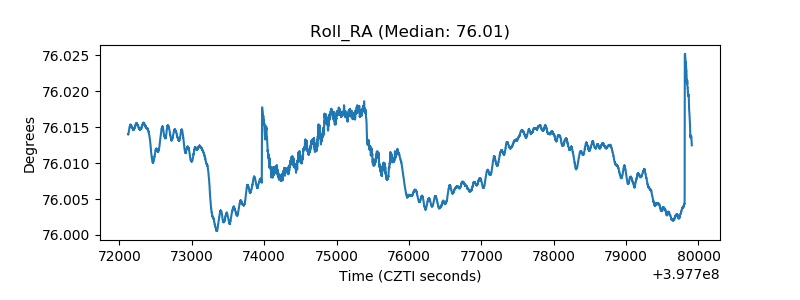 |
| Veto Counter | 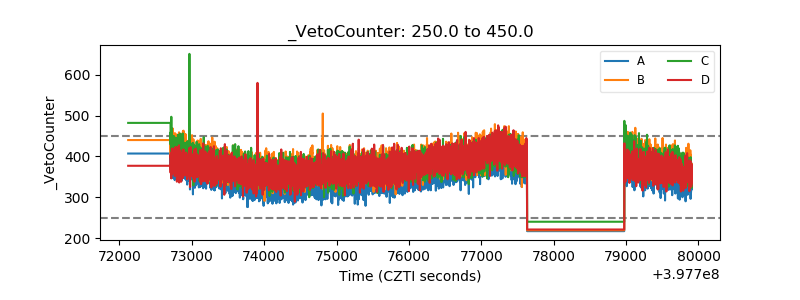 |